João Pinto (Portugal), Paulo Alves (Portugal)
The economics of securitization: evidence from the European
markets
Abstract
This paper surveys the literature examining securitization. Besides describing the economic motivation for the use of securitization, the paper provides details on securitization characteristics and players, presents the recent trends of securitization markets, describes the role played by securitization in the 2007-2008 financial crisis, and compares the financial characteristics of securitization transactions for a large cross-section of ABS, MBS and CDO tranches issued during the 2000-2011 period. Securitization creates value by increasing liquidity, reducing the cost of funding, allowing originators to diversify funding sources, improving originators’ risk management, and allowing originators to benefit from regulatory arbitrage and to improve key financial ratios. However, securitization transactions are complex undertakings, they are expensive to set up, and increase the deadweight transaction costs associated with principal-agent and asymmetric information problems when used inappropriately.
Keywords: securitization, structured finance, financial crisis, unconventional monetary policies. JEL Classification: G01, G23, G24.
Introduction©
Securitization is an economically significant financial market segment, worthy of empirical analysis in its own right. According to the Association for Financial Markets (see 5.2), the volume of securitized assets in Western Europe grew from €78.2 billion in 2000 to €753.9 billion in 2008, an increase of 864.1%, followed by a sharp decrease after 2008. In 2014, a total of €199.0 billion of securitized products were issued in Western Europe, a decline of 73.6% from 2008. The interest of studying securitization is also justified by the puzzling role of securitization. There is a broad consensus concerning the important role played by securitization in the development and propagation of the 2007-2008 financial crisis (IMF, 2008a and 2008b; Benmelech and Dlugosz, 2009; Brunnermeier, 2009; Keys et al., 2010; Demyanyk and Van Hemert, 2011; Purnanandam, 2011). Additionally, several authors argue that securitization may have lowered the impact of monetary policy, because banks derive more of their funding from capital markets (Estrella, 2002; Kuttner, 2002; Goswami et al., 2009; Loutskina and Strahan, 2009; Loutskina, 2011). However, recent studies have pointed out that securitization played a relevant role in allowing financial institutions to
© João M. Pinto, Paulo P. Alves, 2016.
João Pinto, Professor of Finance, Católica Porto Business School, Universidade Católica Portuguesa (Porto) (Catholic University of Portugal (Porto)), Portugal.
Paulo Alves, Professor of Accounting and Finance, Universidade Católica Portuguesa (Catholic University of Portugal (Porto)), Portugal and International Centre for Research in Accounting, Lancaster University Management School, UK.
The authors thank Álvaro Nascimento, João Santos, Jorge Alcover, Mário Santos, Manuel Marques, Miguel Ferreira, and Bill Megginson for their helpful comments on earlier drafts. A special word of appreciation is due to Goldman Sachs for providing access to DCM Analytics database.
solve liquidity and funding problems in the post-crisis period, namely as an active tool to access various lending schemes by central banks (Altunbas et al., 2009; Cardone-Riportella et al., 2010; Krebsz, 2011). As a result, there is an increased need to understand what securitization transactions are, the motivations behind them, their benefits, features and problems.
The term securitization is used to represent the process whereby financial assets are pooled together, with their cash flows, and converted into negotiable securities to be placed in the market; i.e., it is a technique used to transform illiquid assets into securities. As asserted by Fabozzi et al. (2006), securitization ‘refers to the sale of assets, which generate cash flows, from the entity that owns them to another entity that has been specially set up for the purpose, and the issuing of notes by this second entity’1. Securitization is thus a structured finance technique that allows credit to be provided directly through market processes rather than through financial intermediaries – the so-called financial disintermediation.
The key element of securitization is that the obligation of the issuer to repay investors is backed by the value of a pool of financial assets or credit support provided by a third party to the transaction. The markets for the securities issued through securitization are composed of three main classes (Blum and DiAngelo, 1997; Choudhry and Fabozzi, 2004): asset-backed securities (ABS), backed by consumer-backed products; mortgage-backed securities (MBS), backed by mortgages; and collateralized debt obligations (CDO), backed by debt obligations.
1 For further details see, e.g., Davidson et al. (2003), Roever and Fabozzi (2003), Tavakoli (2008), Tasca and Zambelli (2005), Kothari (2006), Jobst (2007), Krebsz (2011), Gorton and Metrick (2013), and references therein.
To understand the relevance of securitization, we are taken back to the Modigliani and Miller (1958) capital structure irrelevance theorem. In a Modigliani and Miller world, securitization transactions would not exist, as they would offer no advantages over less costly alternatives; i.e., in a world of perfect and liquid financial markets, where asymmetric information is not an issue, tranching or the act of encapsulating a pool of assets in an ad hoc organization would not add value and a firm’s financing structure would be irrelevant. Thus, the existence of market imperfections, including asymmetric information, agency conflicts, and market incompleteness can explain tranching, ‘off-balance sheet financing,’ and the benefits of securitization instruments. Consequently, securitization may matter, because it creates value by minimizing the net costs associated with the stated market imperfections. Despite the previously mentioned economic benefits for sponsors and investors, securitization also has disadvantages, namely: (1) complexity; (2) off-balance sheet treatment; (3) asymmetric information problems; (4) agency problems; and (5) higher transaction costs. Besides the fact that securitization instruments are complex vis-à-vis straight debt finance products, problems (3) and (4) are commonly pointed out, underlying the roots of the 2007-2008 financial crisis (Calomiris, 2009; Jobst, 2009; Gorton, 2009; McConnell and Buser, 2011; Purnanandam, 2011). Our paper sheds some light on the puzzling role of securitization. In addition, to our knowledge, no
full-scale survey of securitization literature has yet been published, namely studying the interconnection between the 2007-2008 crisis and the subsequent European sovereign debt crisis and securitization transactions. We also describe the issues that future researches should address to better understand the impact of securitization on banks’ liquidity and funding costs, as well as the role of the European Central Bank (ECB) ABS purchase program on asset prices and longer-term private borrowing rates.
The remainder of the paper is organized as follows. Sections 1 and 2 describe the typical securitization transaction scheme and main instruments, respectively. The economic motivations and problems of securitization are presented in section 3. Section 4 discusses the role of securitization in the 2007-2008 financial crisis. Section 5 compares the financial characteristics of ABS, MBS and CDO tranches and presents the recent trends of Western European securitization markets. The final section presents our conclusions.
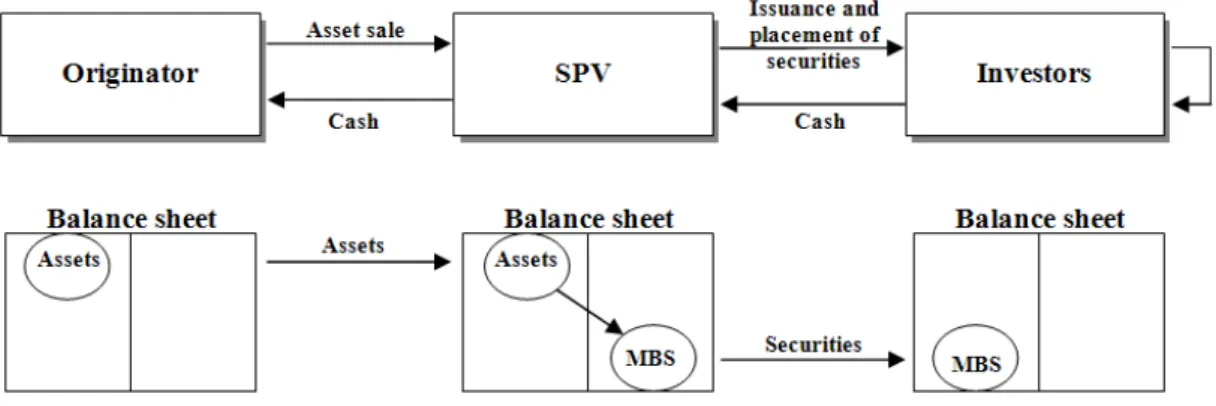
1. The typical securitization transaction scheme A securitization transaction is implemented through a transfer of assets from the originator to a special purpose vehicle (SPV), which then issues securities, in the form of debt instruments, to be placed in the market through a private or public offering2. Figure 1 presents a representation of the financial flows in a typical securitization transaction3.
Note: Adapted from Roever and Fabozzi (2003) and Tasca and Zambelli (2005).
Fig. 1. Financial flows in a securitization transaction
There are two basic deals involved: (1) the asset sale; and (2) the issuance of securities. For example, if a bank intends to raise money by selling a specific pool of mortgages through securitization, the financial flows would be: (1) the bank (originator) sells the assets to a separate entity, the SPV; (2) the SPV transforms them into negotiable securities to be placed into the capital market; (3) the issuance of securities backed by the acquired assets in order to finance the asset purchase; and (4) the cash flows originated by the acquired pool of assets are then
used to pay the principal and interest of the securities to the final investors. 4
2 It can be presented the following issuers of asset-backed securities: (1) captive finance companies of manufacturing firms that provide financing only for their parent company’s products; (2) financing subsidiaries of major industrial corporations; (3) independent finance companies; and (4) domestic and foreign commercial banks.
3 By typical we mean a cash flow based or funded securitization. Securitization can also be implemented based on a synthetic structure. See section 2 for further analysis of funded securitizations versus synthetic securitization.
The standard structure for securitization in Europe is somewhat different from the US, where trusts play an important role. They own assets such as mortgage loans and investors have a direct ownership interest in the trust. In Europe, all deals use a variant of the following structure: (1) the originator sells the assets to an SPV; and (2) the SPV then issues a bond, which is purchased by various investors, backed by the assets owned by the SPV. This vehicle company is usually a company subject to corporate law, but restricted in activity, and may be exempted from certain taxes. However, in any part of the world, the securitization
process involves a standard number of analyses prior to the issuance of securities, namely: (1) assessing the collateral; (2) modeling cash flows; (3) quantifying risk factors via stress tests or other techniques; and (4) structuring the transaction, bearing several factors in mind, such as the client’s specifications, the type of assets, the rating agencies’ opinion, the availability of data, and the investor’s interest in the deal.
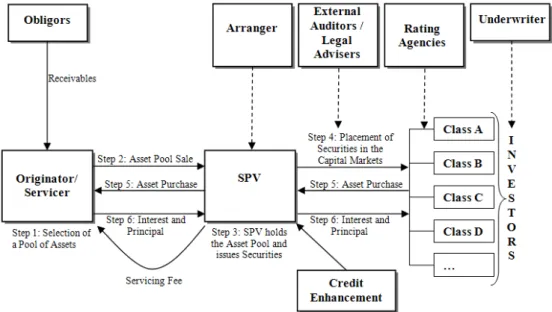
In order to understand the whole securitization process, Figure 2 describes the major steps in a typical securitization transaction.
Fig. 2. Basic securitization process
In more detail, Step 1: the originator identifies a pool of assets (receivables) that can5be securitized4; Step 2: the pool of assets is transferred to an SPV at par value and based on a true sale transaction; Step 3: the SPV holds the asset pool, paying for it by issuing securities; Step 4: securities are structured into different classes and offered to capital markets, which are usually purchased by banks, insurance companies, pension funds and other institutional investors; Step 5: payment of the asset purchase; and Step 6: the originator – who has proximity with the borrowers and typically has an infrastructure and systems in place for doing so – collects cash flows related to the assets, i.e., retains the servicing function. The highest rating for Class A (the most senior class) is explained by two factors: (1) the assets’ segregation from bankruptcy risks of the originator; and (2) the implementation of different credit enhancement strategies. One strategy is the creation of a credit risk mitigation device by subordination of
4 The originator typically identifies assets with similar characteristics. Theoretically, any asset producing regular cash flows can be securitized.
Classes B, C, D, …, such that those lower classes provide credit support to Class A. Often the size of classes B and C is determined in order to meet the rating objective for Class A. Likewise, the size of Class C is settled in order to meet the desired rating for Class B. In other words, the entire transaction is structured to meet specific investor needs.6
Additional credit enhancement mechanisms may be necessary to improve the credit rating of the issued securities and reduce the risks transferred to investors5. These mechanisms can be either internally determined or externally provided. External credit enhancement mechanisms are provided by third-party guarantees, providing first-loss protection against first-losses up to a certain amount. Examples are: (1) guarantees; (2) letters of credit; and (3) bond insurance. This kind of guarantee can either apply to all the issued tranches or, more typically, only to one particular tranche. Internal credit enhancement mechanisms are: (1) subordination;
5 See, for example, Roever and Fabozzi (2003) and Fabozzi and Kothari (2007) for an indepth description of internal and external credit enhancement mechanisms.
(2)7overcollateralization6; (3) cash reserve accounts; (4) excess spread7; (5) trigger events; and (6) minimum debt or interest service coverage levels. The type and amount of credit enhancement employed in a transaction represents the matching point of the issuer’s need to maximize deal proceeds and the rating agencies’ judgment with respect to how much credit enhancement is required to achieve the desired rating on the senior bond classes (Fabozzi et al., 2006). One important difference between the approach used to rate securitized debt and bonds is that corporate obligations are rated ex post while securitized products are rated ex ante. Securitization transactions are thus structured by issuing securities aiming at a specific rating profile (Roever and Fabozzi, 2003).
Regarding the securitization’s financing structure, there are two essential characteristics. The first concerns the SPV, which represents a critical player within the process. Secondly, the transaction is realized through a ‘true sale’ of assets by the originator to the SPV, which allows the isolation of a group of financial assets, separating their risk from the firm8. Therefore, the expected return to investors relies mainly on the risk of the cash flows guaranteed by the pool of assets, rather than the default risk of the originator. The SPV role is paramount and provides an investor with greater protection. With the separate incorporation of the SPV the assets are no longer available to the originator or its creditors. Although the remoteness from bankruptcy may be achieved ensuring independence of the SPV from the originator, in practice this has been thrown somewhat into doubt during the credit crisis as the true sale status has been challenged in some federal courts in the US. Originators need to carefully ensure that the assets transferred to the SPV are ring-fenced from further originator interaction and have to analyze cautiously if any structural feature of the transaction may threaten the true sale claim.
2. Securitization structures
Securitization can be implemented in two ways: (1) a true sale (or cash flow based or funded) securitization – the underlying assets are sold by the originator to the SPV and removed from its balance sheet; or (2) a
6
The overlying bonds are lower in value compared to the underlying asset pool: for example, €250 million nominal of assets are used as backing for €200 million nominal of issued bonds.
7 The excess spread results from the positive difference between cash inflows from assets and the interest service requirements of liabilities, and it acts as the first line of credit support for the deal.
8 Contrary to the US, in Europe, in many jurisdictions (e.g., Germanic type of law), there is a sale or assignment of the assets to an SPV but the perfection of the sale is often postponed until various trigger events occur in order to avoid complicated borrower notification laws. See Davidson et al. (2003) for further discussion of European securitization legislation.
synthetic securitization – the underlying assets remain on the balance sheet of the originator, and only the risk of the underlying assets is transferred to the SPV by buying credit derivatives such as CDS over these assets (Tasca and Zambelli, 2005). As in synthetic securitization there is no sale of assets, the originator does not receive any cash flow and the SPV is not the owner of the pool of assets, but rather the entity carrying the associated credit risk.
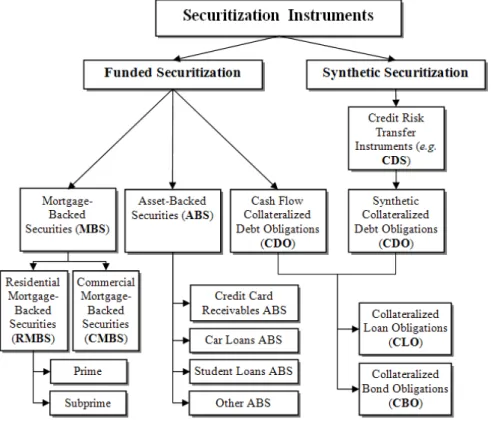
Figure 3 provides an overview of the main securitization instruments. Funded securitizations include three main categories: (1) MBS; (2) ABS; and (3) CDO9. In practice, CDO can be classified either as funded securitization, synthetic securitization or a hybrid form incorporating elements of both10.
Given the important role played by CDO in the 2007-2008 financial turmoil, we carried out a more detailed analysis of such structures. CDO, first introduced in 1988, are a type of securitization in which an SPV issues bonds or notes backed by debt obligations such as investment-grade and high-yield corporate bonds, emerging market bonds, MBS, ABS, bank loans, special-situation loans and distressed debt, and other CDO. A specific type of CDO are the Multisector CDO, also known as ABS CDO, ABS of ABS, CDO squared, or CDO cubed. Multisector CDO emerged in 1999 as a response to investors’ desire to securitize their own positions of structured product, with the implementation of both balance-sheet and off-balance-sheet arbitrage deals. These products are very complex, nearly impossible for sophisticated investors to fairly value, and played an important role in the 2007-2008 financial crisis – CDO based on MBS linked to the subprime market were negatively affected inflicting enormous losses on investors. For example, in a Multisector CDO including subprime collateral, one can find subprime mortgage loans, subprime auto loans, credit card receivables, and mezzanine tranches of CDO. 3. The economic motivations and problems of securitization
The Modigliani and Miller (1958) capital structure irrelevance theorem holds that capital structure is irrelevant to firm value. In such an economy, securitization would not exist as it would offer no advantages over less costly alternatives. Considering that in the real world there are a plethora of different capital structures, securitization can strongly affect the value of the firm.
9 See, among others, Jobst (2003, 2006b) and Vink and Thibeault (2008) for further discussion. Criado and Rixtel (2008) present a description of each type of securitization instrument.
10 See, among others, Fabozzi et al. (2006), Lancaster et al. (2008) and Tavakoli (2008) for further discussion of CDO deals, namely concerning the difference between cash flow structures and synthetic securitization vehicles.
Fig. 3. Securitization instruments
According to Hill (1996), securitization can help to reduce real-world costs, like regulatory costs and information costs. Reduction of information costs is aggravated for firms facing severe ‘lemons problems’ (Akerlof, 1970). Hill (1996) argues that securitization offers a low cost and credible way for information about the firm’s receivables to be accessed by investors. Similarly, Iacobucci and Winter (2005) state that ‘asset securitization is driven by the propensity of the market to allocate assets to investors, who are best informed about asset values.’
The rationale for the emergence of securitization transactions should be found in the economic advantages of (1) increasing liquidity and funding (Greenbaum and Thakor, 1987; Pavel and Phillis, 1987; Hess and Smith, 1988; Roever and Fabozzi, 2003; Jobst, 2006a; Krebsz, 2011; Casu et al., 2013)11; (2) reducing the cost of funding (Goldberg and Rogers, 1988; Rosenthal and Ocampo, 1988; Davidson et al., 2003; Roever and Fabozzi, 2003; Calomiris and Mason, 2004; Fabozzi et al., 2006; Jost, 2006a; Fabozzi and Kothari,122007)12; (3) allowing originators to diversify funding sources (Jones, 2000; Davidson et al., 2003; Roever and Fabozzi, 2003; Fabozzi and Kothari, 2007; Krebsz, 2011); (4) improving
11 Roever and Fabozzi (2003) and Jobst (2006a) refer to securitization as a reliable and relatively unconstrained source of off-balance sheet financing that mitigates traditional funding constrains and can promote a firm’s growth.
12 Indirect evidence is provided by Nadauld and Weisbach (2012), which find that a loan that is subsequently securitized has a lower yield than an otherwise identical loan.
originators’ risk – credit, interest rate, and prepayment risks – management (Cumming, 1987; Greenbaum and Thakor, 1987; Pavel and Phillis, 1987; Hess and Smith, 1988; Goldberg and Rogers, 1988; Rosenthal and Ocampo, 1988; Davidson et al., 2003; Jobst, 2006a; Fabozzi and Kothari, 2007); (5) increasing the segmentation between the origination and investment functions (Davidson et al., 2003); (6) allowing originators to benefit from regulatory and/or tax arbitrage (Cumming, 1987; Jones, 2000; Davidson et al., 2003; Krebsz, 2011)13; and (7) allowing originators to improve key financial ratios (Goldberg and Rogers, 1988; Roever and Fabozzi, 2003; Fabozzi and Kothari, 2007; Krebsz, 2011).
The main motivations for securitization can be analyzed from both the perspectives of a non-bank or a bank corporation. According to Fabozzi et al. (2006), the principal reasons a non-bank corporation may elect to issue an ABS are: (1) to reduce funding costs; (2) to diversify funding sources; and (3) to accelerate earnings for financial reporting purposes. Similarly, Lupica (1998) presents the following motivations: (1) improving liquidity; (2) increasing diversification of funding sources; (3) lowering the effective interest rate; (4) improving risk management; and (5) achieving accounting-related
13 Basel II and Basel III are major economic drivers of new securitization transactions, because the applicable calculation rules (e.g., standardized approach vs internal ratings-based approach vs advanced ratings-based approach) highly influence the regulatory capital charge.
advantages. For bank corporations, the motivations are: (1) new sources of funding (Goldberg and Rogers, 1988; Jones, 2000; Fabozzi et al., 2006; Loutskina and Strahan, 2009; Cardone-Riportella et al., 2010); (2) risk management and the transfer of credit risk, to fund risky financial assets and minimize financial distress costs (Goldberg and Rogers, 1988; Fabozzi et al., 2006; Jobst, 2006a; Cardone-Riportella et al., 2010; Chiesa, 2008); (3) new profit opportunities, by recognizing accounting gains when the market value of loans exceed their book value (Flannery, 1989; DeMarzo, 2005; Affinito and Tagliaferri, 2010); and (4) the adjustment of capital ratios (Donahoo and Shaffer, 1991; Berger and Udell, 1993; Berger et al., 1995; Carlstrom and Samolyk, 1995; Jagtiani et al., 1995; Jones, 2000; Calomiris and Mason, 2004; Ambrose et al., 2005; Fabozzi et al., 2006).
Fabozzi et al. (2006) also present the benefits of securitization from an investors’ perspective. Securitization allows investors to diversify sector interest, access different risk-reward profiles, and access sectors that are otherwise not open to them. Thus, the key benefit to investors is the ability of securitization to tailor risk-return profiles. This idea is corroborated by Jobst (2006a), who states that ‘investors of securitized debt can quickly adjust their investment holdings at low transaction costs in response to a change of personal risk sensitivity, market sentiment or consumption preferences’. Despite all of the above-mentioned advantages, securitization also has problems. Asset securitization transactions are fairly complex and involve a significant amount of due diligence, negotiation, and legal procedures. Consequently, it is more costly to implement than traditional corporate financing. This idea is corroborated by Cardone-Riportella et al. (2010), who point out that the disadvantages of securitization include the fixed costs of setting up the SPV and the potential reduction in the flow of tax benefits from keeping the assets on the balance sheet and financing them with debt. Similarly, Jobst (2006a) argues that the structural complexity as the root of the major concerns about this type of structured finance: (1) high accumulation of interest rate risks; (2) the potential for errors in the rating and pricing of complex security designs; and (3) the shortcomings of analytical models for assessing risks.
Additionally, the credit crisis of 2007-2008 has somewhat tarnished the good image prevailing of the positive role played by securitization in dispersing credit risk, thereby enhancing the resilience of the financial system to default by borrowers. By linking singular credit facilities to the aggregate pricing and valuation discipline of capital
markets, securitization was expected to help remedy deficiencies in financial markets arising from incomplete capital allocation. However, the collapse of the securitization market and the ensuing market turbulence have cast serious doubt on this economic proposition of unbundling, transforming, and redistributing credit risk via securitization instruments (Borio, 2008; IMF, 2008b; Benmelech and Dlugosz, 2009; Brunnermeier, 2009; Shin, 2009; Keys et al., 2010; Demyanyk and Van Hemert, 2011; Purnanandam, 2011).
The literature highlights the following problems related to securitization, which are essentially mentioned within the context of the 2007-2008 financial crisis: (1) complexity (Davidson et al., 2003; Caselli and Gatti, 2005; Fender and Mitchell, 2005; Fabozzi et al., 2006; Jobst, 2006a); (2) off-balance sheet treatment (Fabozzi et al., 2006; and Rutledge and Raynes, 2010); (3) asymmetric information (Gorton, 2009; Jobst, 2009; Lupica, 2009; Keys et al., 2010; Demyanyk and Van Hemert, 2011; Krebsz, 2011; Purnanandam, 2011); (4) agency problems (Jobst, 2006a; Fabozzi and Kothari, 2007; Jobst, 2009; Demyanyk and Van Hemert, 2011; Purnanandam, 2011); and (5) higher transaction costs (Davidson et al., 2003; Cardone-Riportella et al., 2010).
4. Securitization and the 2007-2008 financial crisis
The 2007-2008 financial crisis was triggered by the exposure of financial institutions to the subprime mortgage market and related financial instruments, which were primarily associated to securitization. As the IMF (2008a) states ‘the proliferation of new complex structured finance products, markets, and business models exposed the financial system to a funding disruption and breakdown in confidence’ and that particular products ‘exacerbated the depth and duration of the crisis by adding uncertainty relating to their valuation as the underlying fundamentals deteriorated.’
Two major problems can be pointed out underlying the financial crisis: (1) asymmetric information problems, and (2) agency problems. Several authors (Jobst, 2006a; Fabozzi and Kothari, 2007; Jobst, 2009) argue that securitization may lead to a severe principal-agent problem when the originator retains little or no interest in the pool of securitized assets. In this case, the originator does not have the same incentive to pay attention to the creditworthiness of its customers, as would be the case when the assets remain on its balance sheet.
Referring to asymmetric information, Gorton (2009) and Jobst (2009) argue that the loss of information when high complex structures are used to implement a
securitization transaction is a critical problem. When facing asymmetric information, originators and issuers might be tempted to pursue their own economic incentives, imposing a substantial agency cost on efficient asset securitization. Asymmetric information problems can come from (1) the information advantage of the originator with respect to the quality of borrowers and the historical performance of individual asset exposures – adverse selection; and (2) the complex security design of securitized assets, which suggests the superior information of arrangers concerning the true valuation of issued securities. Empirically, Downing et al. (2009), based on a dataset of MBS issued between 1991 and 2002, found that informed originators trade lemons in the mortgage market; i.e., the assets sold to the SPV are of lower quality compared to the ones retained on the balance sheet. This idea is also corroborated by Carey (1998), Mian and Sufi (2009), Calem et al. (2010), Keys et al. (2010), Titman and Tsyplakov (2010), Krainer and Laderman (2011), and Dell’Ariccia et al. (2012), which argue that banks tend to retain higher quality assets14.
In short, the crisis demonstrated that, in securitization, the value of the underlying cash flows varies with their repackaging, and that repackaging does not just eliminate risk. Additionally, when market deterioration becomes systemic, SPVs may be unable to withstand market inertia, and triggers will eventually be breached. Despite the weakness of the securitization process – credit risk transfer techniques undermine financial stability and emphasize the misalignment of incentives (Gorton and Pennacchi, 1995; Parlour and Plantin, 2008) and securitization went in hand in hand with a decline in credit standards (Mian and Sufi, 2009; Keys et al., 2010; Dell’Ariccia et al., 2012) – policymakers and market practitioners acknowledge its benefits and are overcoming securitization transaction shortcomings, by introducing changes in terms of standardization, transparency, and simplicity (e.g., US’s Dodd-Frank Act, Financial Accounting Standards Board amendments – FAS 166 and 167 –, and the joint work between the BoE and the ECB identifying the impediments that may be preventing the emergence of a healthy securitization market in Europe and suggesting policy options aimed at mitigating them). 5. The securitization market
5.1. Introduction. According to Tasca and Zambelli (2005), ‘the concept of asset securitization was introduced in the US financial system in the 1970s,
14 However, these results are contrary to the arguments presented by Kohen and Santomero (1980), Greenbaum and Thakor (1987), Kim and Santomero (1988), Flannery (1989), Blum (1999), Dionne and Harchaoui (2003), and Ambrose et al. (2005). They argue that banks could have an incentive to securitize lower risk assets and to retain risky assets.
when the Government National Mortgage Association issued securities backed by a pool of loans, represented by residential mortgages.’ Afterwards, the securitization was applied to other assets such as credit card payments and auto loans receivables. It has also been employed as part of asset/liability management, in order to manage balance sheet risk for financial institutions.
The first European transaction was also a RMBS, issued in the UK in 1987. The first countries to join the UK were Spain and France issuing ABS, in the early 1990s, followed by Finland, Sweden, Ireland, Italy, and Germany, in the mid-1990s. But only in the late 1990s securitization really began to take off as legislative changes in many countries began to simplify the process, allowing securitization to expand into other countries and asset classes. Finally, the introduction of the Euro in 1999 has significantly increased the importance of the European securitization market, leading to a rapid growth up until mid-2007.
The diversity of the assets and the direct involvement of the public sector are characteristics differentiating the European market from the much larger and developed US market. While, in the US, the catalyst for securitization was the government’s objective for encouraging home ownership and creating a secondary market for mortgages, in Europe, there have been no government interventions with the goal of promoting securitization. In most European countries, larger commercial banks have issued the first MBS with the objectives of regulatory arbitrage, diversification of funding sources, and as a response to the appeal of international investors. A number of governments started to use securitization to reduce public budget deficits. Additionally, the lack of a large powerful body to provide homogenization and standards and the differing legal frameworks of each European government, provide a very different setting for securitization than in the US.
In Europe, the legal setup of a deal is crucial, complicated, and is the main upfront cost for originators. There are three important areas to think about with respect to legislation: (1) type of law – Napoleonic (e.g., Belgium, Spain, France, Luxemburg, and Portugal), Anglo-Saxon (UK), or Germanic (e.g., Sweden, Denmark, Finland, Norway, Austria, Netherlands, and Germany); (2) securing the assets and cash flows; and (3) local framework for securitization. Although we may refer to the European securitization market as a single market, it is in fact a collection of distinct markets (Adams, 2005). The wide divergence in market sizes within Europe is a reflection of the very different economic, financial, political, historical, legal, and social frameworks.
5.2. Securitization in Western Europe. This section provides a statistical analysis of asset securitization (AS) in Western Europe15. We start by comparing the distribution of AS bonds across time, industry, and nationality of the issuer. The financial characteristics of ABS, MBS and CDO tranches are also presented and compared. Finally, we compare our results for Western Europe with securitization activity in Europe and the US.
Information on AS bonds was extracted from DCM Analytics database. AS transactions typically consist of several tranches funding the same SPV. Therefore, we focus on the transaction tranches. DCM Analytics only provide information about AS securities issued in the capital markets through a public offering. We select bonds in the DCM Analytics database with the deal type code of “asset-backed security” and “mortgage-backed security”. Finally, we require that the issuer country belongs to Western Europe and that the tranche size be available.
Table 1 shows the evolution of AS issues between 2000 and 2011. AS peaked in 2008 (by value) and fell in 2009. After 2009, we do not have observations in our sample. This is partly explained by the European sovereign debt crisis, which has limited the increase of securitized products, but also by the fact that an increasing number of banks have underwritten their own securitization programs to use them as a guarantee for obtaining resources in the auctions of the ECB, issuing the so-called Covered Bonds.
Table 1. Distribution of the sample of asset securitization bonds by year
Year
Asset securitization bonds Number of
tranches
Total value of tranches (€ Million) Percent of total value 2000 115 26,027 14.5 2001 81 12,990 7.3 2002 77 17,709 9.9 2003 42 14,894 8.3 2004 66 31,555 17.6 2005 53 10,034 5.6 2006 55 10,639 5.9 2007 35 3,469 1.9 2008 39 36,122 20.2 2009 36 15,694 8.8 2010 - - - 2011 - - - Total 599 179,132 100.0
Table 2 shows that AS bonds (by value) are highly concentrated in the financial industry (75.1%).
15 Austria, Belgium, Cyprus, Denmark, Finland, France, Germany, Greece, Iceland, Ireland, Italy, Luxemburg, Netherlands, Norway, Portugal, Spain, Sweden, Switzerland, and the UK.
Table 3 also shows clear differences between the Western European countries which attract AS transactions. AS bonds are highly concentrated in three countries (89.5% by value and 77% of the total number of issues are made by borrowers located in UK, Germany, and Italy), with the bulk number of issues concentrated in the UK (41.2% by value and 48.7% of all AS tranches).
Table 2. Industrial distribution of asset securitization bonds
Industrial category of issuer
Asset securitization bonds Number of tranches Total value of tranches (€ Million) Percent of total value Commercial 90 21,750 12.1 Industrial 33 11,622 6.5 Utilities 27 8,522 4.8 Financial institutions 444 134,457 75.1 Transportation 5 2,785 1.6 Government - - - Total 599 179,132 100.0
Table 3. Geographic distribution of asset securitization bonds
Geographic location of issuer
Asset securitization bonds Number of tranches Total value of tranches (€ Million) Percent of total value Austria 1 27 0.0 Belgium 18 1,723 1.0 Cyprus - - - Denmark - - - Finland - - - France 32 1,526 0.9 Germany 117 42,299 26.4 Greece 2 74 0.0 Iceland - - - Ireland 10 3,309 1.8 Italy 52 39,314 21.9 Luxemburg 3 173 0.1 Netherlands 42 4,270 2.4 Norway - - - Portugal 11 1,391 0.8 Spain 19 6,228 3.5 Sweden - - - Switzerland - - - United Kingdom 292 73,797 41.2 Total 599 179,132 100.0
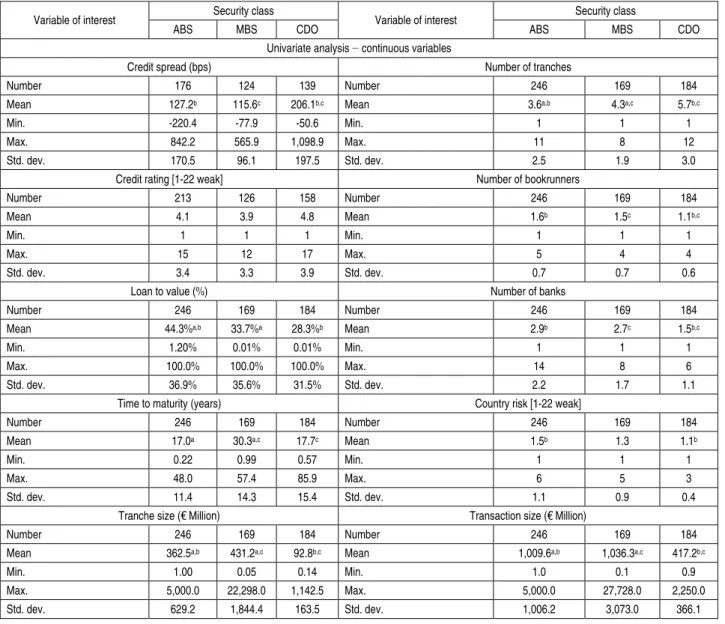
Table 4 examines and compares credit spread and contract characteristics among ABS, MBS and CDO tranches. Regarding the relative pricing of the three security classes, results show that the average credit spreads are economically and statistically higher for CDO tranches (206.1 bps) when compared to ABS (127.2 bps) and MBS (115.6 bps) tranches. On the contrary, average credit spreads for ABS and MBS tranches do not differ significantly at 1% significance level.
The average credit rating for ABS (4.1), MBS (3.9) and CDO (4.8) tranches do not differ significantly. This is interesting because contrary to the US where CDO collateral became dominated by lower level (BBB or A) of tranches recycled from other MBS whose assets were usually non-prime mortgages, in Western Europe CDO were generally diversified. Regarding country risk, only ABS issuers are, on average, located in riskier countries than in the case of CDO category. The average number of banks participating in a CDO transaction is 1.5 and is significantly smaller than the average for ABS (2.9) and for MBS (2.7). Similarly, CDO transactions have the lowest average number of bookrunners (1.1), which differ significantly from the average number of bookrunners in ABS (1.6) and MBS (1.5).
CDO issues exhibit the lowest average tranche size of €92.8 million, less than the €362.5 million and €431.2 million average tranche size exhibited by ABS and MBS, respectively. Similarly, the average
tranche size exhibited by ABS differs significantly at the 1% significance level from the average tranche size exhibited by MBS.
Currency risk clearly suggests that ABS are often similar to MBS, but otherwise fundamentally different financial instruments from CDO. ABS in Western Europe are much less likely to be subject to currency risk (22.8% for ABS versus 14.2% and 58.7% for MBS and CDO, respectively). While UK borrowers represent 57.3% of the ABS issues, they only account for 43.8% and 41.8% of the MBS and CDO issues, respectively. A significantly larger number of tranches per transaction are issued in a CDO transaction. In a typical CDO transaction, the average number of tranches per transaction is 5.7, which is larger than the average for ABS (3.6) and MBS (4.3). The average loan to value ratio – the ratio of the tranche size to the transaction size – for MBS (33.7%) and CDO (28.3%) is significantly lower than the loan to value ratio for ABS (44.3%). Table 4. Descriptive statistics for ABS, MBS and CDO
Variable of interest Security class Variable of interest Security class
ABS MBS CDO ABS MBS CDO
Univariate analysis − continuous variables
Credit spread (bps) Number of tranches
Number 176 124 139 Number 246 169 184
Mean 127.2b 115.6c 206.1b,c Mean 3.6a,b 4.3a,c 5.7b,c
Min. -220.4 -77.9 -50.6 Min. 1 1 1
Max. 842.2 565.9 1,098.9 Max. 11 8 12
Std. dev. 170.5 96.1 197.5 Std. dev. 2.5 1.9 3.0
Credit rating [1-22 weak] Number of bookrunners
Number 213 126 158 Number 246 169 184
Mean 4.1 3.9 4.8 Mean 1.6b 1.5c 1.1b,c
Min. 1 1 1 Min. 1 1 1
Max. 15 12 17 Max. 5 4 4
Std. dev. 3.4 3.3 3.9 Std. dev. 0.7 0.7 0.6
Loan to value (%) Number of banks
Number 246 169 184 Number 246 169 184
Mean 44.3%a,b 33.7%a 28.3%b Mean 2.9b 2.7c 1.5b,c
Min. 1.20% 0.01% 0.01% Min. 1 1 1
Max. 100.0% 100.0% 100.0% Max. 14 8 6
Std. dev. 36.9% 35.6% 31.5% Std. dev. 2.2 1.7 1.1
Time to maturity (years) Country risk [1-22 weak]
Number 246 169 184 Number 246 169 184
Mean 17.0a 30.3a,c 17.7c Mean 1.5b 1.3 1.1b
Min. 0.22 0.99 0.57 Min. 1 1 1
Max. 48.0 57.4 85.9 Max. 6 5 3
Std. dev. 11.4 14.3 15.4 Std. dev. 1.1 0.9 0.4
Tranche size (€ Million) Transaction size (€ Million)
Number 246 169 184 Number 246 169 184
Mean 362.5a,b 431.2a,c 92.8b,c Mean 1,009.6a,b 1,036.3a,c 417.2b,c
Min. 1.00 0.05 0.14 Min. 1.0 0.1 0.9
Max. 5,000.0 22,298.0 1,142.5 Max. 5,000.0 27,728.0 2,250.0 Std. dev. 629.2 1,844.4 163.5 Std. dev. 1,006.2 3,073.0 366.1
Table 4 (cont.). Descriptive statistics for ABS, MBS and CDO
Variable of interest Security class Variable of interest Security class
ABS MBS CDO ABS MBS CDO
Univariate analysis − dummy variables
Floating rate issue Currency risk
N. of issues with data available 246 169 184 N. of issues with data available 246 169 184 N. of issues with dummy = 1 150a,b 146a 154b N. of issues with dummy = 1 56b 24c 108b,c % of total available data 61.0% 86.4% 83.7% % of total available data 22.8% 14.2% 58.7%
Financial institutions U.K. borrowers
N. of issues with data available 246 169 184 N. of issues with data available 246 169 184 N. of issues with dummy = 1 120a,b 150a 174b N. of issues with dummy = 1 141a,b 74a 77b % of total available data 48.8% 88.8% 94.6% % of total available data 57.3% 43.8% 41.8%
Notes: ABS, MBS, and CDO mean asset-backed securities, mortgage-backed securities, and collateralized debt obligations, respectively. The variables are as follows: Credit spread: spread at issue over comparable risk-free government security with a comparable maturity; Credit rating: S&P and Moody's rating at issuance – AAA=Aaa=1, AA+=Aa1=2, and so on until D=22; Loan to value: the ratio of the tranche size to the transaction size of a given bond; Time to maturity: maturity of bonds, in years; Number of tranches: the number of tranches for each transaction; Number of banks: the number of financial institutions participating in the bond issuance; Number of bookrunners: the number of financial institutions participating in the bond issuance as bookrunners; Country risk: S&P’s country credit rating at close – AAA=1, AA+=2, and so on until D=22. Floating rate issue: dummy equal to 1 if a bond is floating price and 0 otherwise; Currency risk: dummy equal to 1 for bonds that are denominated in a currency different from the currency in the deal’s nationality. The tests for similar distributions in contract characteristics across samples are the
Wilcoxon rank-sum test for continuous variables and the Fisher’s exact test for dummy variables. a Indicate significant difference at
the 1% level between ABS and MBS. b Indicate significant difference at the 1% level between ABS and CDO. c Indicate significant
difference at the 1% level between MBS and CDO.
An MBS tranche of average size matures over just 30.3 years, which is a long period if we compare it with the average 17.0 and 17.7 years for ABS and CDO tranches, respectively. Finally, a significantly larger fraction of ABS tranches are fixed rate (39%) compared to the full sample of MBS (13.6%) and CDO (16.3%) tranches.
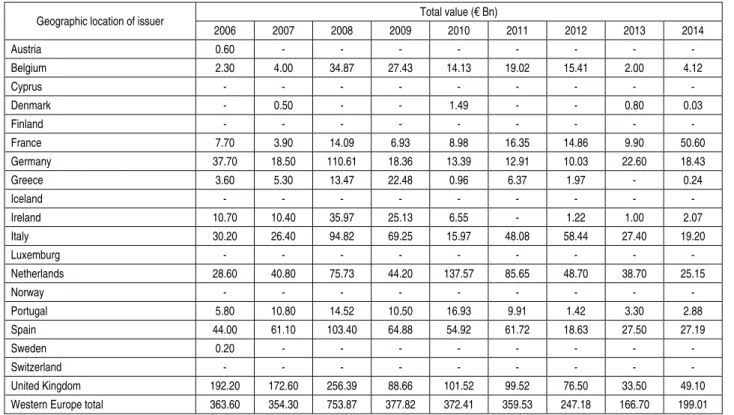
Looking to the evolution of the structured finance markets, it is possible to conclude that securitization has become one of the most visible consequences of
financial innovation in recent years (Table 5). According to the Association for Financial Markets, the volume of securitized assets in Western Europe grew from €78.2 billion in 2000 to €753.9 billion in 2008. The 2007-2008 financial crisis, in which securitization seems to have played a determinant role, provoked a sharp change after the first quarter of 2008. In 2014, a total of €199.0 billion of securitized products were issued in Western Europe, a decline of 73.6% from 2008 (€753.9 billion). Table 5. Distribution of asset securitization bonds by year: Europe versus US
Geographic location of issuer Total value (€ Bn)
2006 2007 2008 2009 2010 2011 2012 2013 2014 Austria 0.60 - - - - - - Belgium 2.30 4.00 34.87 27.43 14.13 19.02 15.41 2.00 4.12 Cyprus - - - - - - - Denmark - 0.50 - - 1.49 - - 0.80 0.03 Finland - - - - - - - France 7.70 3.90 14.09 6.93 8.98 16.35 14.86 9.90 50.60 Germany 37.70 18.50 110.61 18.36 13.39 12.91 10.03 22.60 18.43 Greece 3.60 5.30 13.47 22.48 0.96 6.37 1.97 - 0.24 Iceland - - - - - - - Ireland 10.70 10.40 35.97 25.13 6.55 - 1.22 1.00 2.07 Italy 30.20 26.40 94.82 69.25 15.97 48.08 58.44 27.40 19.20 Luxemburg - - - - - - - Netherlands 28.60 40.80 75.73 44.20 137.57 85.65 48.70 38.70 25.15 Norway - - - - - - - Portugal 5.80 10.80 14.52 10.50 16.93 9.91 1.42 3.30 2.88 Spain 44.00 61.10 103.40 64.88 54.92 61.72 18.63 27.50 27.19 Sweden 0.20 - - - - Switzerland - - - - - - - United Kingdom 192.20 172.60 256.39 88.66 101.52 99.52 76.50 33.50 49.10 Western Europe total 363.60 354.30 753.87 377.82 372.41 359.53 247.18 166.70 199.01
Table 5 (cont.). Distribution of asset securitization bonds by year: Europe versus US PanEurope 1.70 2.10 12.42 20.32 2.60 3.04 0.41 9.10 14.82 Other Europe 1.90 1.10 12.91 1.82 1.63 3.38 2.95 4.70 1.93 Multinational 3.70 96.20 39.42 23.65 0.74 6.02 0.49 0.40 0.19 Europe in total 370.90 453.70 818.62 423.61 377.39 371.97 251.03 180.90 215.95 U.S. total NA 2,404.90 933.63 1,358.90 1,276.69 1,013.72 1,550.18 1,508.87 1,070.34
Note: Data according to the Association for Financial Markets in Europe, available at: http://www.afme.eu/reports.aspx. The
difference between the values obtained from the AFM versus DCM Analytics database is due to the fact that the latter only contains AS transactions issued in the capital markets.
As pointed out in Table 6 (see Appendix), MBS (RMBS and CMBS) continues to make up the majority of the issues carried out in Europe (€116.9 billion in 2014), followed by ABS (€47.6 billion), SME loans (€33.3 billion), and Whole business securitization (€3.7 billion). In Q4 2014, €59.6 billion (€56.4 billion Q4 2013) of securitized product was issued in Europe, an increase of 59.6% from Q3 2014 (€37.3 billion) but a decline of 40.1% from Q4 2012 (€99.5 billion).
The volume of securitized assets in the US declined from €2,404.9 billion in 2007 to €933.6 billion in 2008, a decline of 61.2%. In 2014, a total of €1.070.3 billion of securitized products were issued in the US, an increase of 14.6% from 2008. As for Europe, MBS (RMBS and CMBS) continues to make up the majority of the issues carried out (€818.2 billion in 2014), followed by ABS (€169.8 billion), and CDO (€82.3 billion). The link between CDO and the 2007-2008 financial crisis is well demonstrated in Table 6. The weight of CDO in the total securitized assets in the US decreased from 10.5% in 2007 to 4.3% and 0.11% in 2008 and 2009, respectively.
Conclusion
Using a cross-section of 599 Western European asset securitization bonds closed during the 2000-2011 period, we find that the average credit spread is economically and statistically higher for CDO when compared to ABS and MBS. Investors face higher deadweight transaction costs associated with principal-agent and asymmetric information problems when investing in a CDO vis-à-vis ABS and MBS, since CDO are more complex and the underlying pool of assets can be managed in terms of assets and cash flows. Considering the securitization instruments studied as a whole, we document important univariate differences, namely: (1) the average number of banks participating in a CDO transaction is significantly smaller than the average for ABS and for MBS; (2) CDO issues exhibit the lowest average tranche size of €92.8 million, less than the €362.5 million and €431.2 million average tranche size exhibited by ABS and
MBS, respectively; (3) currency risk suggests that ABS are often similar to MBS, but otherwise fundamentally different financial instruments from CDO; (4) MBS tranches have much longer average maturity than ABS and CDO tranches; and (5) ABS tranches are more likely to be fixed rate rather than floating rate.
The transition from the traditional originate-to-hold model to the originate-to-distribute model, as well as its reliance on credit markets as a continuing source of credit, has been blamed by academics and practitioners for the financial crisis of 2007-2008. If the originator does not hold the credit it originates, but distributes the loan and its risks to other entities through securitization, the originator has a reduced incentive to monitor the credit granting process. Thus, this model brings with it a major principal-agent problem in the credit screening process, because the credit incentives of the originator are not aligned with those of the entity that ultimately holds the loan. When we add the complexity associated with the securitization process, the result is a ‘market for lemons’ problem (Akerlof, 1970), leading to the collapse of the market for securitized assets.
However, during the 2007-2008 financial crisis and the subsequent European sovereign debt crisis the ECB implemented several unconventional monetary policies to restore bank funding, enhancing the transmission of monetary policy and providing further monetary policy accommodation, like the more recently announced (September 2014) ABS purchase program16. This dual role of securitization raises two questions: (1) What is the impact of securitization on bank liquidity and funding costs? (2) What will the impact of the ECB ABS purchase programme be on the corporate cost of funding?16 Answering these questions is an important avenue for further research. So far, the empirical literature
16 Additionally, the ECB implemented two Covered Bond Purchase Programs in 2009 and 2011 (CBPP1 and CBPP2), and more recently announced (September 2014) the third covered bond purchase program (CBPP3). See Beirne et al. (2011) for further details.
has devoted little attention to this issue. For example, Joyce et al. (2010) attempt to access the impact of Quantitative Easing Policy on asset prices, while Gagnon et al. (2010) conclude that the purchase of longer-term assets by the Federal Reserve since 2008 was successful in reducing longer-term private borrowing rates and stimulating the economy. Regarding the Euro Area, Beirne et al. (2011) analyzed
the impact of the first Covered Bond Purchase Program on bank funding conditions, with results showing that covered bonds yield in the euro area were reduced by approximately 12 bps. Further research could also explore how securitization changed the way banks manage their funding and liquidity and how these changes have in turn altered the traditional links between bank liquidity, cost of funds, and loan supply. References
1. Adams, P. (2005). An Introduction to the European Securitization Markets, Journal of Structured Finance, 11, pp. 33-39.
2. Affinito, M. and Tagliaferri, E. (2010). Why Do (or Did?) Banks Securitize Their Loans? Evidence from Italy, Journal of Financial Stability, 6, pp. 189-202.
3. Akerlof, G. (1970). The Market for ‘Lemons’: Quality Uncertainty and the Market Mechanism, The Quarterly Journal of Economics, 84, pp. 488-500.
4. Altunbas, Y., Gambacorta, L., and Marques-Ibanez, D. (2009). Securitisation and the bank lending channel, European Economic Review, 53, pp. 996-1009.
5. Ambrose, B., Lacour-Little, M., and Sanders, M. (2005). Does Regulatory Capital Arbitrage, reputation, or Asymmetric Information Drive Securitization? Journal of Financial Services Research, 28, pp. 113-133.
6. Beirne, J., Dalitz, L., Ejsing, J., Grothe, M., Manganelli, S., Monar, F., Sahel, B., Sušec, M., Tapking, J., and Vong, T. (2011). The impact of the eurosystem’s covered bond purchase programme on the primary and secondary markets. ECB occasional paper no. 122, European Central Bank.
7. Benmelech, E., and Dlugosz, J. (2009). The alchemy of CDO credit ratings, Journal of Monetary Economics, 56, pp. 617-634.
8. Berger, A., Herring, R., and Szego, G. (1995). The Role of Capital in Financial Institutions, Journal of Banking and Finance, 19, pp. 393-430.
9. Berger, A., and Udell, G. (1993). Securitization, risk and the liquidity problem in banking. In: Klausner, M., and White, L. (eds), Structural Change in Banking, NYU Press.
10. Blum, J. (1999). Do capital adequacy requirements reduce risks in banking? Journal of Banking and Finance, 22, pp. 755-771.
11. Blum, L. and DiAngelo, C. (1997). Structuring Efficient Asset-Backed Transactions. In: Bhattacharya, A., and Fabozzi, F. (eds) Asset-Backed Securities, Frank Fabozzi Associates.
12. Borio, C. (2008). The Financial Turmoil of 2007-?: A Preliminary Assessment and Some Policy Considerations. BIS working paper no. 251, Bank of International Settlements.
13. Brunnermeier, M. (2009). Deciphering the Liquidity and Credit Crunch 2007-2008, Journal of Economic Perspectives, 23, pp. 77-100.
14. Calem, P., Henderson, C., and Liles, J. (2010). ‘Cream-Skimming’ in Subprime Mortgage Securitizations: Which Subprime Mortgage Loans Were Sold by Depository Institutions Prior to the Crisis of 2007? Federal Reserve Bank of Philadelphia working paper no. 10-8.
15. Calomiris, C. (2009). The Subprime Turmoil: What’s Old, What’s New, and What’s Next, Journal of Structured Finance, 15, pp. 6-52.
16. Calomiris, C., and Mason, J. (2004). Credit card securitization and regulatory arbitrage, Journal of Financial Services Research, 26, pp. 5-27.
17. Cardone-Riportella, C., Samaniego-Medina, R., and Trujillo-Ponce, A. (2010). What drives bank securitisation? The Spanish experience, Journal of Banking and Finance, 34, pp. 2639-2651.
18. Carey, M. (1998). Credit Risk in Private Debt Portfolios, Journal of Finance, 53, pp. 1363-1387.
19. Carlstrom, C., and Samolyk, K. (1995). Loan sales as a response to market-based capital requirements, Journal of Banking and Finance, 19, pp. 627-646.
20. Caselli, S., and Gatti, S. (2005). Characteristics and Common Features of Structured Finance Operations. In: Caselli, S., and Gatti, S. (eds), Structured Finance: Techniques, Products and Markets, Springer, Berlin, pp. 1-4. 21. Casu, B., Clare, A., Sarkisyan, A., and Thomas, S. (2013). Securitization and Bank Performance, Journal of
Money, Credit and Banking, 45, pp. 1617-1658.
22. Chiesa, G. (2008). Optimal Credit Risk Transfer, Monitored Finance, and Banks, Journal of Financial Intermediation, 17, pp. 464-77.
23. Choudhry, M. and Fabozzi, F. (2004). The Handbook of European Structured Financial Products. Wiley Finance. 24. Criado, S. and Rixtel, A. (2008). Structured Finance and the Financial Turmoil of 2007-2008: An Introductory
Overview. Bank of Spain occasional paper no. 0808.
25. Cumming, C. (1987). The Economics of Securitization, Federal Reserve Bank of New York Quarterly Review, 12, pp. 11-23.
26. Davidson, A., Sanders, A., Wolff, L., and Ching, A. (2003). Securitization: Structuring and Investment Analysis, Wiley & Sons, Inc., Hoboken, New Jersey.
27. Dell’Ariccia, G., Igan, D., and Laeven, L. (2012). Credit Booms and Lending Standards: Evidence from the Subprime Mortgage Market, Journal of Money, Credit and Banking, 44, pp. 367-84.
28. DeMarzo, P. (2005). The Pooling and Tranching of Securities: A Model of Informed Intermediation, Review of Financial Studies, 18, pp. 1-35.
29. Demyanyk, Y. and Hemert, V. (2011). Understanding the Subprime Mortgage Crisis, Review of Financial Studies, 24, pp. 1848-1880.
30. Dionne, G. and Harchaoui, T. (2003). Banks’ Capital, Securitization and Credit Risk: An Empirical Evidence for Canada. HEC working paper no. 03-01, HEC Montréal.
31. Donahoo, K. and Shaffer, S. (1991). Capital requirements and the securitization decision, Quarterly Review of Economics and Business, 4, pp. 12-23.
32. Downing, C., Jaffee, D., and Wallace, N. (2009). Is the Market for Mortgage-Backed Securities a Market for Lemons? The Review of Financial Studies, 22, pp. 2257-2294.
33. Estrella, A. (2002). Securitization and the Efficacy of Monetary Policy, Economic Policy Review, 8, pp. 243-255. 34. Fabozzi, F., Davis, H., and Choudhry, M. (2006). Introduction to Structured Finance, Wiley Finance.
35. Fabozzi, F. and Kothari, V. (2007). Securitization: The Tool of Financial Transformation. Yale ICF working paper no. 07-07.
36. Fender, I. and Mitchell, J. (2005). Structured finance: complexity, risk and the use of ratings, BIS Quarterly Review, June, pp. 67-79.
37. Flannery, M. (1989). Capital regulation and insured banks’ choice of individual loan default rates, Journal of Monetary Economics, 24, pp. 235-258.
38. Gagnon, J., Raskin, M., Remache, J., and Sack, B. (2010). Large Scale Asset Purchases by the Federal Reserve: Did They Work? Federal Reserve Bank of New York Staff Reports no. 441.
39. Goldberg, C. and Rogers, K. (1988). An Introduction to Asset Backed Securities, Journal of Applied Corporate Finance, 1, pp. 20-31.
40. Goswami, M., Jobst, A., and Long, X. (2009). An Investigation of Some Macro-Financial Linkages of Securitization. IMF Research Bulletin no. 26, International Monetary Fund.
41. Gorton, G. (2009). The Subprime Panic, European Financial Management, 15, pp. 10-46.
42. Gorton, G. and Metrick, A. (2013). Securitization. In: Constantinides, G., Harris, M., and Stulz, R. (eds). Handbook of the Economics of Finance, Elsevier, Vol. 2A, pp. 1-70.
43. Gorton, G. and Pennacchi, G. (1995). Banks and Loan Sales: Marketing Nonmarketable Assets, Journal of Monetary Economics, 35, pp. 389-411.
44. Greenbaum, S. and Thakor, V. (1987). Bank Funding Modes: Securitization versus Deposits, Journal of Banking and Finance, 11, pp. 379-401.
45. Hess, A. and Smith, C. (1988). Elements of Mortgage Securitization, Journal of Real Estate Finance and Economics, 1, pp. 331-46.
46. Hill, C. (1996). Securitization: A Low-Cost Sweetener for Lemons, Washington University Law Quarterly, 74, pp. 1061-1120.
47. Iacobucci, E. and Winter, R. (2005). Asset Securitization and Asymmetric Information, Journal of Legal Studies, 34, pp. 161-206.
48. IMF. (2008a). Global Financial Stability Report: Containing Systemic Risks and Restoring Financial Soundness. International Monetary Fund, April.
49. IMF. (2008b). The Recent Financial Turmoil − Initial Assessment, Policy Lessons, and Implications for Fund Surveillance, International Monetary Fund, April.
50. Jagtiani, J., Saunders, A., and Udell, G. (1995). The effect of bank capital requirements on bank off-balance sheet financial innovations, Journal of Banking and Finance, 19, pp. 647-658.
51. Jobst, A. (2003). Collateralized Loan Obligations (CLOs) – A primer, The Securitization Conduit, 6, pp. 7-14. 52. Jobst, A. (2006a). Asset securitisation as a risk management and funding tool: What small firms need to know,
Managerial Finance, 32, pp. 731-760.
53. Jobst, A. (2006b). What is Structured Finance? The Securitization Conduit, 8, pp. 1-9.
54. Jobst, A. (2007). A primer on Structured Finance, Journal of Derivatives and Hedge Funds, 13, pp. 199-213. 55. Jobst, A. (2009). Islamic Securitization After the Subprime Crisis, Journal of Structured Finance, 14, pp. 41-57. 56. Jones, D. (2000). Emerging problems with the Basel Capital Accord: regulatory capital arbitrage and related
issues, Journal of Banking and Finance, 24, pp. 35-58.
57. Joyce, M., Lasaosa, A., Stevens, I., and Tong, M. (2010). The Financial Market Impact of Quantitative Easing. BoE working paper no. 393, Bank of England.
58. Keys, B., Mukherjee, T., Seru, A., and Vig, V. (2010). Did securitization lead to tax screening? Evidence from subprime loans, The Quarterly Journal of Economics, 125, pp. 307-362.
59. Kim, D. and Santomero, A. (1988). Risk in banking and capital regulation, Journal of Finance, 43, pp. 1219-1233. 60. Kohen, M. and Santomero, A. (1980). Regulation of bank capital and portfolio risk, Journal of Finance, 35,
pp. 1235-1244.
61. Kothari, V. (2006). Securitization: The Financial Instrument of the Future, John Wiley & Sons, Wiley Finance. 62. Krainer, J. and Laderman, E. (2011). Mortgage Loan Securitization and Relative Loan Performance, Federal
63. Krebsz, M. (2011). Securitization and structured finance post credit crunch: A best practice deal lifecycle guide, John Wiley & Sons, Wiley Finance.
64. Kuttner, K. (2002). Securitization and the Efficacy of Monetary Policy, Economic Policy Review, 8, pp. 1-13. 65. Lancaster, B., Schultz, G., and Fabozzi, F. (2008). Structured Products and Related Credit Derivatives: A
Comprehensive Guide for Investors, The Frank J. Fabozzi Series, John Wiley & Sons, Wiley Finance.
66. Loutskina, E. (2011). The role of securitization in bank liquidity and funding management, Journal of Financial Economics, 100, pp. 663-684.
67. Loutskina, E. and Strahan, P. (2009). Securitization and the declining impact of bank financial condition on loan supply, Journal of Finance, 64, pp. 861-889.
68. Lupica, L. (1998). Asset Securitization: The Unsecured Creditor’s Perspective, Texas Law Review, 76, pp. 595-660. 69. Lupica, L. (2009). Credit Rating Agencies, Structured Securities, and the Way Out of the Abyss, Review of
Banking and Financial Law, 28, pp. 639-673.
70. McConnell, J. and Buser, S. (2011). The Origins and Evolution of the Market for Mortgage-Backed Securities, Annual Review of Financial Economics, 3, pp. 173-192.
71. Mian, A. and Sufi, A. (2009). The Consequences of Mortgage Credit Expansion: Evidence from the U.S. Mortgage Default Crisis, Quarterly Journal of Economics, 124, pp. 1449-96.
72. Modigliani, F. and Miller, M. (1958). The Cost of Capital, Corporation Finance and the Theory of Investment, American Economic Review, 48, pp. 261-297.
73. Nadauld, T. and Weisbach, M. (2012). Did securitization affect the cost of corporate debt? Journal of Financial Economics, 105, pp. 332-352.
74. Parlour, C. and Plantin, G. (2008). Loan Sales and Relationship Banking, Journal of Finance, 63, pp. 1291-1314. 75. Pavel, C. and Phillis, D. (1987). Why Commercial Banks Sell Loans: An Empirical Analysis, Economic
Perspectives, 14, pp. 3-14.
76. Purnanandam, A. (2011). Originate-to-distribute model and the subprime mortgage crisis, The Review of Financial Studies, 24, pp. 1881-1915.
77. Roever, W. and Fabozzi, F. (2003). A Primer on Securitization, Journal of Structured and Project Finance, 9, pp. 5-20. 78. Rosenthal, J. and Ocampo, J. (1988). Analyzing the Economic Benefits of Securitized Credit, Journal of Applied
Corporate Finance, 1, pp. 32-44.
79. Rutledge, A. and Raynes, S. (2010). Elements of Structured Finance, Oxford University Press, New York. 80. Shin, H. (2009). Securitization and Financial Stability, Economic Journal, 119, pp. 309-332.
81. Tasca, R. and Zambelli, S. (2005). The Asset Securitization Activity in Italy: Current and Future Trends. In: Caselli, S., and Gatti, S. (eds), Structured Finance: Techniques, Products and Market, Springer, Berlin.
82. Tavakoli, J. (2008). Structured Finance Collateralized & Debt Obligations: New Developments in Cash & Synthetic Securitization, John Wiley & Sons, Wiley Finance.
83. Titman, S. and Tsyplakov, S. (2010). Originator Performance, CMBS Structures, and Risk of Commercial Mortgages, Review of Financial Studies, 23, pp. 3558-3594.
84. Vink, D. and Thibeault, A. (2008). ABS, MBS, and CDO Pricing Comparisons: An Empirical Analysis, Journal of Structured Finance, 14, pp. 27-45.
Appendix
Table 6. Distribution of asset securitization bonds by collateral: Europe versus US
2007 2008 2009 2010 2011 2012 2013 2014 €Bn % €Bn % €Bn % €Bn % €Bn % €Bn % €Bn % €Bn % Europe ABS 57.80 12.74% 73.02 8.92% 52.49 12.39% 31.40 8.32% 71.14 19.13% 52.47 20.90% 71.62 39.59% 47.63 22.06% CDO 88.65 19.54% 48.08 5.87% 107.14 25.29% 29.64 7.85% 9.24 2.48% 13.45 5.36% 9.25 5.11% 14.34 6.64% MBS 307.27 67.72% 697.52 85.21% 263.98 62.32% 272.19 72.12% 229.76 61.77% 137.82 54.90% 74.35 41.10% 116.93 54.15% SME - - - - - - 39.68 10.51% 59.59 16.02% 45.17 17.99% 20.24 11.19% 33.32 15.43% WBS/PFI - - - - - - 4.48 1.19% 2.24 0.60% 2.12 0.84% 5.44 3.01% 3.73 1.73% Total 453.72 100.00% 818.62 100.00% 423.61 100.00% 377.39 100.00% 371.97 100.00% 251.03 100.00% 180.90 100.00% 215.95 100.00% U.S. ABS 666.90 27.73% 88.72 9.50% 102.95 7.58% 82.63 6.47% 90.56 8.93% 153.51 9.90% 140.36 9.30% 169.79 15.86% CDO 252.50 10.50% 40.12 4.30% 1.56 0.11% 2.68 0.21% 7.73 0.76% 36.12 2.33% 60.80 4.03% 82.32 7.69% MBS 1,485.54 61.77% 804.79 86.20% 1,254.39 92.31% 1,191.38 93.32% 915.43 90.30% 1,360.55 87.77% 1,307.71 86.67% 818.23 76.45% Total 2,404.94 100.00% 933.63 100.00% 1,358.90 100.00% 1,276.69 100.00% 1,013.72 100.00% 1,550.18 100.00% 1,508.87 100.00% 1,070.34 100.00%
Note: ABS: asset-backed securities; MBS: mortgage-backed securities; CDO: collateralized debt obligations; SME: small and medium enterprises; WBS/PFI: whole business securitizations/public finance initiatives. stm e nt M anage m e nt an d F inanc ial Inno v atio ns , V o lu m e 13 , Is su e 1, 2 0 16 6