Research Article
Raquel P. F. Guiné, Maria João Lima*
Study of the drying kinetics and calculation of
mass transfer properties in hot air drying of
Cynara cardunculus
https://doi.org/10.1515/opag-2020-0062 received May 05, 2020; accepted June 17, 2020
Abstract: In the present work, mass transfer properties of thistleflower (Cynara cardunculus L.) were evaluated for the convective drying carried out at temperatures between 35 and 65°C, with an airflow of 0.5 m/s. The calculations followed two different algorithms, based on mathematical models derived from the thin layer drying equation and Fick’s second law of diffusion. The results obtained indicated that different methodologies resulted in different values of mass transfer properties, which is an alert that care must be taken when choosing which calculation method might be more appropriate in a specific practical application. In all cases, the values of moisture diffusion and mass transfer coefficient were found to increase with in-creasing operating temperature. The values of diffusivity increased from 2.7866× 10⁻⁹to 1.4027× 10⁻⁸m2/s for the thin layer model-based algorithm and from 1.9256 × 10⁻¹⁰to 1.2033× 10⁻⁹m2/s for Fick’s equation model. The values of the mass transfer coefficient increased from 8.4335 × 10⁻⁸to 8.4400× 10⁻⁷m/s and from 5.8277× 10⁻⁹to 7.2398× 10⁻⁸m/ s, respectively, for the thin layer and Fick’s law-based models.
Keywords: convective drying, diffusivity, mass transfer coefficient, activation energy
1 Introduction
Thistle is a plant belonging to the family Asteraceae, which comprises a number of genres, including the genus Cynara L. which comprises the following eight species: C. cardunculus L., C. syriaca Boiss., C. auranitica Post, C. cornigera Lindley, C. algarbiensis Cosson, C. baetica(Spreng.) Pau, C. cyrenaica Maire et Weiller and C. humilis L. The C. cardunculus L. originates from the Mediterranean area and belongs to the Asteraceae Dumortier family. It grows in rocky sites, being found both in the wild and cultivated. It comprises the following three botanical taxa: cultivated cardoon (var. altilis DC), wild cardoon (var. sylvestris (Lamk) Fiori) and globe artichoke(var. scolymus L.) (Dias et al. 2018).
The thistleflower of C. cardunculus L., Cynara genus is widely used in the manufacture of various cheeses in the Mediterranean regions, and also in Portugal, where it is used for example to manufacture the traditional cheeses bearing the Protected Designation of Origin according to European and Portuguese regulations: Serra da Estrela, Castelo Branco, Azeitão, Évora, Niza and Serpa. The aqueous extracts of C. cardunculus flowers have been used for immemorial times to coagulate ewes’ milk for the manufacture of traditional cheeses, allowing us to obtain products with very characteristic organoleptic properties, much appreciated by consumers, and conferring authenticity to these traditional foods (Roseiro et al. 2005; Scaglione et al. 2009; Barracosa et al. 2018).
Thistle flower is used to coagulate milk because it contains aspartic proteases. The thistleflower is dried to ensure its safety and allow storage during the winter season. This driedflower is used to produce an aqueous extract, which is then added to the milk as a coagulant. Traditionally, drying of the thistle flower for the production of cheese is done out of the sun, in a shadow, dry and airy place. For that, the elements are spread on trays that have to be turned and stirred
Raquel P. F. Guiné: CERNAS-IPV Research Centre, Department of Food Industry, Polytechnic Institute of Viseu, Viseu, Portugal
* Corresponding author: Maria João Lima, CERNAS-IPV Research Centre, Department of Food Industry, Polytechnic Institute of Viseu, Viseu, Portugal; Department of Food Industry, ESAV, Quinta da Alagoa, Estrada de Nelas, Ranhados, 3500-606, Viseu, Portugal, e-mail: [email protected], tel: +351-232-446-600; fax:+351-232-426-536
Open Access. © 2020 Raquel P. F. Guiné and Maria João Lima, published by De Gruyter. This work is licensed under the Creative Commons Attribution 4.0 International License.
periodically. Nevertheless, this traditional handling of the thistle flower presents some problems, either because of the uncontrolled conditions upon drying, namely temperature and relative humidity, or also due to the presence of fauna, in particular insects, which may result in meaningful damage to thefinal product as well as compromised sanitary quality (Dias et al. 2018). Hence, some experiments are being carried out to dry the thistle flower by convective drying, providing products with higher safety and more constant quality. Nevertheless, it is important to pay attention to the drying conditions, and particularly temperature, for their effect on some important bioactive molecules, since the amount of phenolic compounds and their antioxidant activity can be significantly diminished with increasing drying temperature.
Drying allows us to reduce moisture content and extend product shelf-life due to the elimination of a substantial part of the initial water present, which is extensively applied in the food industry. Besides the conservation capacity, drying also provides other ad -vantages, such as facilitating packaging, transportation and storage of foods, by reducing weight and volume of the product, as well as avoiding the expensive refrigera -tion systems. The diversity of drying methods is enormous, either as isolated techniques or in combina -tion, but undoubtedly that, among those techniques, convective drying, also known as hot air drying, is one of the most relevant at the level of industrial applicability. During convective drying the heat for evaporation of the water in the food is supplied by hot air, which contacts directly with the wet product to remove the moisture that diffuses from the inside to the surface. Because the process of moisture diffusion from the intricate three-dimensional structure of the food to the surface is one of the key factors in controlling the drying rate, it is important to know the phenomena that occur in the food and particularly the heat and mass transfer properties (Mota et al. 2010; Caparino et al. 2012; Sahni and Chaudhuri 2012; Zarein et al. 2015; Qiu et al. 2019).
Some studies have been carried out with the aim of calculating the heat and/or mass transfer properties for the drying of different food and agricultural products, such as sweet potato(Onwude et al. 2018), garlic (Tao et al. 2018), pear (Guiné et al. 2013), longan fruit (Apinyavisit et al. 2018), apple (Guiné et al. 2014; Khan et al. 2020), kiwi (Mohammadi et al. 2019; Hou et al. 2020), carrot (Khubber et al. 2020), mushroom (Gon-zález-Pérez et al. 2019), goji berry (Dermesonlouoglou et al. 2018), corn (Wei et al. 2019) and soy (Granella et al. 2019). It is known that mass transfer properties greatly impact the drying processes and, therefore, this study
aimed to evaluate the mass transfer properties of thistle flower (C. cardunculus L.) submitted to convective drying, performed at different temperatures, starting at 35°C and going up until 65°C. For the determination of the mass transfer properties, two different algorithms were used, which allowed calculating the values of the drying constant, the effective moisture diffusion coefficient, the mass transfer coefficient and also the activation energy in the range of temperatures studied.
2 Materials and methods
2.1 Samples
In this study, samples of thistleflower of the species C. cardunculus L. harvested in Viseu, situated in the centre region of Portugal, at the time offlowering, i.e., in June, were used. The samples were collected and immediately transported to the laboratory to proceed with the experiments, without any storage. The petals of the thistleflower were separated prior to drying. The petals are oblong, with about 10 mm long and 1 mm diameter.
2.2 Drying experiments
The thistle flowers were dried at different temperatures (35, 45, 55 and 65°C) in a forced convection chamber set to maintain a constant desired temperature. The choice of this temperature range was based on one hand on the factor that temperatures lower than 35–40°C are very long drying processes, and on the other hand that temperatures too high, above 65–70°C, may have an adverse effect on the phenolic compounds present in the thistleflower and also on their aspartic proteases which have the milk clogging capacity. The choice of these particular temperatures allowed covering the desired range of possible drying temperatures with a reduced number of experimental drying assays (four). The chamber used was a forced convection oven (model WTB Binder; BINDER GmbH company, Germany), with an airflow of 300 m3/h, corresponding to an airflow rate of 0.5 m/s. The initial moisture content of the thistle flower was 56.91% (wet basis) and was determined by the method of weight loss until the weight is constant on an oven at 105°C. On a periodical basis, the samples were evaluated for moisture content. For this, the whole
tray was weighed, thus giving the weight of the batch, i.e., the whole set of thistle flowers in the drier. This allowed calculating the weight loss of the batch along time, and therefore the moisture content both on wet basis and dry basis. The measurements were made at intervals of 20 min for the fastest processes (tempera-tures of 55 and 65°C) and 30 min for the slowest dryings (temperatures of 35 and 45°C). Each drying process was completed when the sample reached a final moisture content of or lower than 5%. The drying time for the different assays was 15, 7, 5 and 4 h, respectively, for 35, 45, 55 and 65°C, and four dried samples resulted from these processes, designated as D35, D45, D55 and D65.
3 Mathematical models
3.1 Thin layer model for transfer of moisture
The so-called thin-layer models consist in mathematical equations that correlate the changes in moisture during drying with certain parameters, such as the drying constant, k(1/s), or the lag factor, k0 (dimensionless), which account for the combined effects of numerous transport phenomena taking place during drying. The Henderson and Pabis model is such an example of a thin-layer model and relates the moisture ratio (MR) to time (t) according to the following equation (Kouchakzadeh 2013; Avhad and Marchetti 2016; Vijayan et al. 2016):
=k (−k t)
MR 0exp , (1)
where k0is the lag factor and k is the drying constant, as defined earlier, and the MR = (W − We)/(W0− We), with W0, Weand W, the moisture contents at the beginning, at equilibrium and at any time t, respectively. This equation can be expressed in the logarithmic form, corresponding to a linear function of the type:
( ) = ( ) −k kt
ln MR ln 0 (2)
in which the slope can be used to calculate the drying constant k.
3.2 Correlations for mass transfer
The Biot number for mass transfer, Bim, is a dimension -less number that correlates the convective mass transfer
coefficient, hm(m/s), with the diffusivity coefficient, De, (m/s2) (Dincer and Hussain 2002a):
= h z
D
Bim m ,
e (3)
where z is the characteristic dimension of the system(m). Equation (3) is valid for Bi > 0.1 (Sahin et al. 2002) and allows the estimation of hm, if the value of Bimis known. Dincer and Hussain(2002a) proposed an equation to associate the Biot number, Bim, with the dimensionless Dincer number, Di:
=
Bi 24.848
Di ,
m 0.375 (4)
where the Dincer number is defined as: = u
kz
Di (5)
where u is the flow velocity of drying air (m/s), k is the drying constant and z is the characteristic dimension. Furthermore, Dincer and Dost (1996) proposed an equation to relate the effective diffusivity, De, to the thin layer drying constant, k:
= D kz μ e 2 1 2 (6)
where μ1 is a function of the Biot number, given by (Haghi and Amanifard 2008):
= −( + )
μ1 tan10.64Bi 0.38 .
m (7)
3.3 Di
ffusion model for mass transfer
Fick’s second law of diffusion has been widely recom-mended to predict with reasonable accuracy the moisture distribution inside many food materials during drying, even though significant changes occur in their physical–chemical properties (Danish et al. 2016; Nicolin et al. 2016; Silva et al. 2016). In this way, the non-steady-state diffusion for unidirectional mass transfer is expressed by(Haghi and Amanifard 2008):
∂ ∂ = ∂ ∂ ∂ ∂ W t z D W z 1 , e (8) where W(z,t) is the dry basis moisture content (kg water/kg dry solids), t is the time (s), Deis the effective diffusivity (m2/s) and z is the characteristic dimension of the system (m). However, the partial differential equation of equation (8) can be simplified, if the following hypotheses are
considered: (a) initial moisture content is uniform throughout the solid, (b) shape of the solid remains constant and shrinkage is negligible,(c) the effect of heat transfer on mass transfer is insignificant, (d) mass transfer occurs exclusively by diffusion and (e) moisture diffusion occurs in the z direction only. In this case, equation(8) is simplified into (Haghi and Amanifard 2008):
∂ ∂ = ∂ ∂ W t D W z e 2 2 (9)
with the following initial and boundary conditions:
= ( ) = t W z at 0 : , 0 1, (10) = ∂ ( ) ∂ = z W t z at 0 : 0, 0, (11) = − ∂ ( ) ∂ = ( ) z Z D W Z t z h W Z t at : e , m , , (12)
where Z is the half thickness of slab and hm is the convective mass transfer coefficient. For the diffusion in transient conditions, assuming a uniform initial distri -bution of the moisture content and also a uniform concentration at the surface for t > 0, the solution of Fick’s law can be approximated by an infinite series, of the form(Crank 1975):
∑
= − − = ( + ) − ( + ) = ∞ W W W W n D t z n MR 8 π 1 2 1 exp 2 1 π 4 , n e 0 e 2 0 2 e 2 2 2 (13)where MR is the moisture ratio(dimensionless), and W, We and W0 are the moisture content at time t, the equilibrium moisture content and the initial moisture content, respectively, all expressed in dry basis(g water/ g dry solids). Furthermore, considering that when the Fourier numbers are higher than 0.2, the second and following terms of the series can be neglected, then the solution of Fick’s equation is given by (Crank 1975):
= − π D t π z MR 8 exp 4 , 2 e 2 2 (14)
if the following condition is satisfied, = D t >
z
Fo e 0.2,
2 (15)
where Fo is the dimensionless Fourier number.
Equation (14) can be expressed in the form of logarithm, giving place to a straight line of the form:
( ) = − π π D z t ln MR ln 8 4 2 2 e 2 (16)
from which the value of De can be calculated from the slope.
3.4 Determination of the mass transfer
properties
To determine the mass transfer properties for the different drying temperatures, two methodologies were used, based on the diffusion model and the thin layer model(Guiné et al. 2017):
Method A: Thin layer based model
• Estimate MR from the experimental drying data for every time t
• From a plot ln(MR) = f(t) estimate k and k0 through equation(2)
• Calculate Di from equation (5) • Calculate Bimfrom equation(4) • Calculate m1 from equation (7) • Calculate Defrom equation(6) • Calculate hmfrom equation(3)
Method B: Fick’s law based model
• Estimate MR from the experimental drying data for every time t
• From a plot ln(MR) = f(t) estimate De from the slope through equation(16)
• Estimate k and k0by combining equations(1) and (14): k= Dep2/(4z2), k0= 8/p2
• Calculate Di from equation (5) • Calculate Bimfrom equation(4) • Calculate hmfrom equation(3).
3.5 Activation energy for moisture di
ffusion
and for convective mass transfer
The variation of effective diffusivity with temperature is expected to follow an Arrhenius function, as expressed by the following equation (Guiné et al. 2013):
= − ( + ) D D E R T exp 273.15 , e e0 d (17)
whereDe0is the diffusivity for an infinite temperature, Ed is the activation energy for moisture diffusion, R is the constant of gases (R = 8.31451 J mol−1K−1) and T is the drying temperature(expressed in °C). A plot of ln(De) as
a function of(1/(T + 273.15)) will result in a straight line with slope equal to (−Ed/R) and intercept equal to
(D )
ln e0, from which the parameters Ed and De0 can be
estimated(Guiné et al. 2013).
In parallel, the dependence of the convective mass transfer coefficient, hm, on temperature can also be expressed by an Arrhenius function like:
= − ( + ) h h E R T exp 273.15 , m m0 c (18)
where hm0 is the Arrhenius constant and Ec is the activation energy for convective mass transfer.
Equations (17) and (18) can be linearized thus obtaining the corresponding equations of a straight line:
( ) = ( ) − ( + ) D D E R T ln ln 273.15 , e e0 d (19) ( ) = ( ) − ( + ) h h E R T ln ln 273.15 . m m0 c (20)
4 Results and discussion
4.1 Drying curves
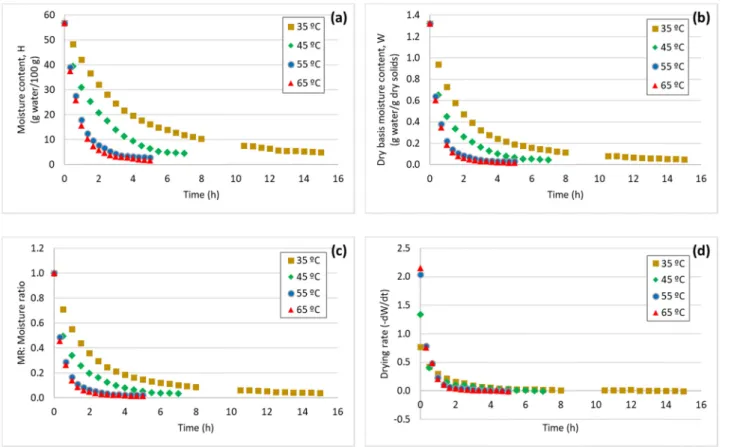
Figure 1 shows the drying curves obtained for the convective drying of thistleflower at different tempera-tures (35, 45, 55 and 65°C). The results in Figure 1(a) indicate that the drying time was highly variable as the temperature changed, although the kinetic profiles for the wet basis moisture content, H, for all temperatures were relatively similar, i.e., corresponding to a de -creasing function of time. The drying time increased from about 5 to 15 h when the temperature decreased from 65°C to 35°C. The curves in Figure 1(b) show a very similar trend for the dry basis moisture content, W, with a very fast decrease particularly for the highest temperatures: 55°C and 65°C. The MR, represented in Figure 1(c), is a dimensionless function expressing the variations of moisture during drying and, in the case of thistle flower drying, the values showed a trend practically equal to that of the dry basis moisture content. The form of the curves for W corresponded for all temperatures to decreasing exponential functions, which is similar to what has been reported for the drying of several agricultural products(Vega-Gálvez et al. 2010; Wang et al. 2015; Romdhane et al. 2016). The drying rate, calculated as the difference in W divided by the corresponding difference in time (Figure 1(d)), was very
high in the initial moments of drying for the tempera -tures 55°C and 65°C, a little lower for 45°C and even lower for 35°C. Nevertheless, for all temperatures in the first 2 h the drying rate decreased to almost zero. This is very important considering that faster processes are preferable for allowing us to obtain the products in less time, and therefore with less costs, provided that quality is guaranteed, namely considering the effects of tem-perature on the properties of the dried product.
4.2 Estimation of mass transfer properties
from the thin layer model
Table 1 summarizes the values obtained for the slope and intercept of the linearization of equation(2), which is the logarithmic form of the thin-layer model Henderson and Pabis, and which was used to calculate the parameters drying constant(k) and lag factor (k0) by method A. The values of the regression coefficient (R2) were relatively close to 1, varying in the range 0.8687–0.9440, in-dicating that thefit obtained to the linear functions was good in all cases, with just exception for the data obtained at 55°C, in which case the value was lower than 0.9 (R2 = 0.8687). This lower value found for the regression coefficient was because in this drying experi-ment the measured values of the moisture content were not fitted to the linear model with the same accuracy as that in the other cases, for which the model best fitted the experimental values.
Table 2 presents the results obtained when calcu -lating the different mass transfer properties for the evaluated temperatures through the algorithm of method A. According to the values in Table 2, it is possible to verify that the drying constant, k, increased when the temperature was raised from 35°C to 65°C, which would be expected having in consideration that a higher temperature provides more heat that will in turn promote a higher rate of water removal. The values of the drying constant for thistle flower in the temperature range studied varied between 5.2791 × 10⁻⁵s−1 and 3.2989 × 10⁻⁴s−1. These values stand in the same range as those for the drying constant in the Henderson and Pabis thin layer model reported by Guiné et al.(2017) for the drying of kiwi and eggplant in a temperature range from 50°C to 80°C and at the same hot airflow rate used in this work (0.5 m/s) (values comprised between 1.1530 × 10⁻⁴ and 6.0176 × 10⁻⁴), as well as those reported by Darıcı and Şen (2015), for kiwi dried at 60°C and the same air
Table 1: Parameters obtained for the linearization of the function ln(MR) = f(t), for the different temperatures tested
Drying temperature Slope(s−1) Intercept Regression coefficient (R2 )
35°C −5.2791 × 10⁻⁵ −7.0022 × 10⁻¹ 0.9299
45°C −1.2494 × 10⁻⁴ −5.7533 × 10⁻¹ 0.9505
55°C −1.9301 × 10⁻⁴ −9.3886 × 10⁻¹ 0.8687
65°C −3.2989 × 10⁻⁴ −4.9460 × 10⁻¹ 0.9440
Figure 1: Drying curves for the thistleflower: (a) wet basis moisture content, (b) dry basis moisture content, (c) MR and (d) drying rate.
Table 2: Mass transfer properties for the drying of thistleflower, calculated by method A Drying temperature Mass transfer propertiesa
k (s−1) k0 Di Bi μ1 De(m2/s) hm(m/s) 35°C 5.2791× 10⁻⁵ 0.4965 3.1571× 10⁶ 0.0908 0.4129 2.7866 × 10⁻⁹ 8.4335× 10⁻⁸ 45°C 1.2494× 10⁻⁴ 0.5625 1.3340× 10⁶ 0.1254 0.4314 6.0430× 10⁻⁹ 2.5263× 10⁻⁷ 55°C 1.9301× 10⁻⁴ 0.3911 8.6353× 10⁵ 0.1476 0.4430 8.8501 × 10⁻⁹ 4.3553× 10⁻⁷ 65°C 3.2989× 10⁻⁴ 0.6098 5.0523× 10⁵ 0.1805 0.4601 1.4027× 10⁻⁸ 8.4400× 10⁻⁷ a
k = drying constant; k0= lag factor; Di = Dincer number; Bi = Biot number; μ1= constant; De= effective diffusivity coefficient; hm= convective mass transfer coefficient.
velocity (2.696 × 10⁻²min−1 corresponding to 4.493 × 10⁻⁴s−1). The values of the lag factor, k0, found in the present study, are in the range from 0.3911 to 0.6089, which are lower than those reported for the convective drying of kiwi and eggplant in the work by Guiné et al. (2017) (1.3539–1.5046) and also lower than the values reported by Darıcı and Şen (2015) (0.9741).
The values of the Di number in Table 2 varied in the range from 5.0523× 10⁵to 3.1571× 10⁶, and these values are somewhat similar to those reported by Guiné et al. (2013) for the drying of pears (3.7135 × 10⁵–2.3174 × 10⁶). However, Dincer and Hussain(2002a) found values of Di number considerably lower for the hot air drying of spherical potatoes(1.2356 × 10⁴), being these differences probably owing to the much different size and geometry of the samples, as well as the drying conditions or even considering the different nature of the product.
Table 2 also reveals the values found for the Biot number, which varied in the range 0.0908–0.1805, increasing with increasing temperature and which are very similar to those reported by Guiné et al.(2017) for the drying of two food products(0.1217–0.2261, respec-tively, for kiwi and for eggplant). As one can confirm, these values are all over 0.1, which makes it possible to use equation(3) for the estimation of the mass transfer coefficients. Guiné et al. (2013) reported values of Bi between 0.1020 and 0.2026 for the drying of pears under variable drying conditions, and Dincer and Hussain (2002a) obtained a value of Bi for the convective drying of spherical potatoes equal to 0.3119. These values are of the same magnitude of those found in this study for the drying of thistle. Nevertheless, Srikiatden and Roberts (2006) reported values for Bi for mass transfer in potato and carrot samples dried by convective hot air drying considerably higher than the ones found in the present study(1.44 × 10⁴–9.70 × 10⁴for 1.5 m/s at 50–70°C and 0.97 × 10⁵–2.77 × 10⁵ for 3.0 m/s at 40–70°C). These differences are probably due to the air velocities used in their study, which were three and six times higher than that used in the present work for the drying of thistle.
Table 2 further presents the values ofμ1, which were found to vary from 0.4129 to 0.4601, which are very similar to the ones encountered by Guiné et al.(2017) for the drying of two food products(0.4294–0.4652 for kiwi and 0.4439–0.4832 for eggplant). In contrast, the value reported by Dincer and Hussain (2002a) for the air drying of spherical potatoes was lower(0.2781).
The values of the effective diffusion coefficient, De, shown in Table 2, varied between 2.7866 × 10⁻⁹ and 1.4027× 10⁻⁸m2/s, rising with increasing temperature, as expected. These values are similar to those found by
Guiné et al. (2017) for the drying of kiwi and eggplant (5.6281 × 10⁻⁹–2.3152 × 10⁻⁸m2/s) and to those reported by Tripathy and Kumar (2009) for potato (2.43 × 10⁻⁸–6.09 × 10⁻⁸m2/s). Nevertheless, many authors have reported values of De much lower for the drying of variable food products: 1.997 × 10⁻¹¹ for rough rice (Silva et al. 2010), 3.320 × 10⁻¹⁰to 9.000× 10⁻⁹m2/s for berberis fruits(Aghbashlo et al. 2008), 6.7904 × 10⁻¹⁰to 4.7722 × 10⁻⁹m2/s for pears(Guiné et al. 2013), 8.94 × 10⁻¹¹ to 9.63 × 10⁻¹¹m2/s for cocoa beans (Dina et al. 2015), 2.7906 × 10⁻¹¹ to 1.8489 × 10⁻¹⁰m2/s for mango (Dissa et al. 2011), 1.20 × 10⁻¹¹to 1.33× 10⁻¹¹m2/s for mint (Sallam et al. 2015) and 5.00 × 10⁻¹⁰to 1.95× 10⁻⁹m2/s for mushroom(Reyes et al. 2014). In fact, although there are many studies evaluating the diffusion coefficients of variable food products, it is not possible to accurately compare the data obtained in the present study with other findings, due to differences in the drying condi-tions, the nature of the products or even the shape and size of the elements dried.
Finally, Table 2 also presents the values of the convective mass transfer coefficient, hm, which were found to vary from to 8.4335× 10⁻⁸to 8.4400× 10⁻⁷m/s. Other values reported in the literature for other diverse food products include 3.798× 10⁻⁷for rough rice(Silva et al. 2010), 2.2831 × 10⁻⁷–1.7882 × 10⁻⁶m/s for kiwi and eggplant (Guiné et al. 2017), 1.3520 × 10⁻⁸–1.3976 × 10⁻⁹m/s for pears (Guiné et al. 2013) and 3.2665 × 10⁻⁵m/s for potatoes(Dincer and Hussain 2002b). Again, like it was observed for the effective diffusion coefficient, accurate comparisons of the mass transfer coefficient are difficult across variable products and drying conditions.
4.3 Estimation of mass transfer properties
from the di
ffusional model
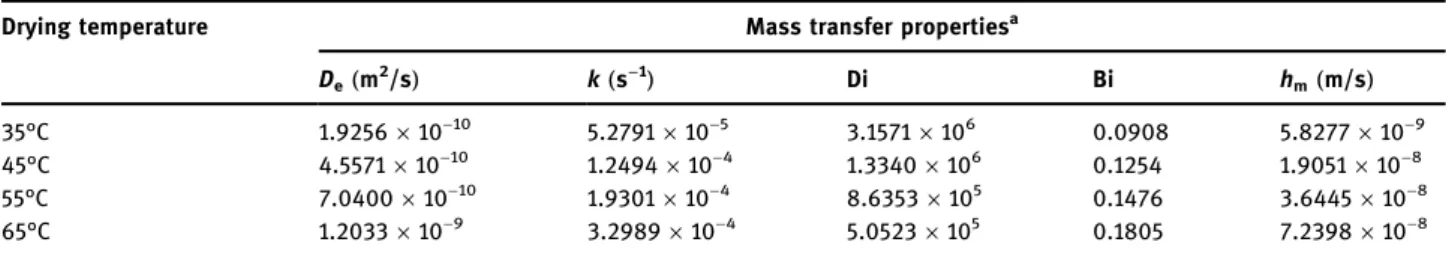
Table 3 shows the values obtained in this work for the different mass transfer properties evaluated with the algorithm described in method B. The values of the diffusion coefficient, De, in this case varied from 1.9256× 10⁻¹⁰ to 1.2033 × 10⁻⁹m2/s, which are lower when compared to those found using the algorithm in method A, which proves that the algorithm used for the calculation of diffusivity is conditioned according to the fundamentals of mass transfer considered: use of Fick’s law of diffusion or use of thin layer empirical models. Fick’s equation is of a fundamental origin, but has some assumptions that might eventually lead to a discrepancy between the theoretical model and the
reality of the moisture diffusion inside the specific matrix of the food considered. On the other hand, the thin layer models rely on empirical equations, which, even though resulting from an attempt tofit experimental data with accuracy, also have some limitations as to their applic -ability. The values of the mass transfer coefficient range from 5.8277× 10⁻⁹to 7.2398× 10⁻⁸m/s, which are lower than those in Table 2.
4.4 Calculation of activation energy
Table 4 presents the results obtained through the linearization (by linear regression) of the functions ln (De) or ln(hm) versus 1(T + 273.15), which express the variations in diffusivity and mass transfer coefficient with temperature by means of Arrhenius-type equations (equations (19) and (20)). The values of the regression coefficient are high in both cases, with R2 close to 1, which would be the perfectfit.
Table 5 shows the calculated values of the constants in equations (19) and (20), including the activation energies for moisture diffusion and for convective mass transfer. The results obtained for the constants De0 and
hm0 were 0.1146 and 6766.2 m/s, respectively, while the activation energy for moisture diffusion, Ed, was 51.5 kJ/ mol, and the activation energy for convective mass transfer, Ec, was 70.9 kJ/mol. It is once again difficult to compare the values with those from the literature, because there are no studies about the drying of the thistle flower stems, and therefore any comparisons
include necessarily other types of food products and eventually other drying conditions. Reported values for
De0include 4.2458× 10⁻⁴for kiwi and 2.3640 × 10⁻⁴for
eggplant (Guiné et al. 2017). The value obtained for hm0
by Thripathy and Kumar (2009) for the solar drying of potato slices was 0.285 m/s and those obtained by Guiné et al. (2017) for the drying of kiwi and eggplant slices were 3.0738 and 1.5752 m/s, respectively. Values re -ported for activation energy for moisture diffusion, Ed, in other works include 18.6 kJ/mol for tomato(Fiorentini et al. 2015) or the range 110.837–124.356 for berberis fruits (Aghbashlo et al. 2008). Other authors have reported values of the activation energy for convective mass transfer, Ec, for different foods, for example, for pumpkin 86.25 kJ/mol (Guiné et al. 2012) or for potato slices 4.42 kJ/mol(Tripathy and Kumar 2009).
Table 4: Parameters for linearization of equations(19) and (20), respectively, for ln(De) and ln(hm) for the drying of thistle flower
Equation Slope Intercept Regression coefficient (R2
) Equation(19): moisture diffusion −6199.0879 −2.1667 0.9836
Equation(20): convective mass transfer −8523.7459 8.8197 0.9836 Table 3: Mass transfer properties for the drying of thistleflower, calculated by method B
Drying temperature Mass transfer propertiesa De(m 2 /s) k (s−1) Di Bi hm(m/s) 35°C 1.9256× 10⁻¹⁰ 5.2791× 10⁻⁵ 3.1571× 10⁶ 0.0908 5.8277× 10⁻⁹ 45°C 4.5571× 10⁻¹⁰ 1.2494× 10⁻⁴ 1.3340× 10⁶ 0.1254 1.9051 × 10⁻⁸ 55°C 7.0400× 10⁻¹⁰ 1.9301× 10⁻⁴ 8.6353× 10⁵ 0.1476 3.6445× 10⁻⁸ 65°C 1.2033× 10⁻⁹ 3.2989× 10⁻⁴ 5.0523× 10⁵ 0.1805 7.2398 × 10⁻⁸ a
De= effective diffusivity coefficient; k = drying constant; Di = Dincer number; Bi = Biot number, hm= convective mass transfer coefficient.
Table 5: Activation energy for moisture diffusion and for convective mass transfer of thistleflower
Value Moisture diffusiona
De0(m2/s) 1.1456× 10
−1
Ed(J/mol) 51,542
Convective mass transferb
hm0(m/s) 6.7662× 10
3
Ec(J/mol) 70,871
aD
e0= diffusivity for an infinite temperature; Ed= activation energy for moisture diffusion.bhm0= Arrhenius constant; Ec = activation energy for convective mass transfer.
The knowledge of the mass transfer properties and activation energy has practical implications in the optimization of the drying processes and, namely, in the energy input for the process.
5 Conclusions
The results obtained in this study allowed estimation of the values of some important numbers related to mass transfer in drying, such as the Dincer or Biot numbers, as well as the diffusivity and mass transfer coefficients for the drying of thistle flower using two different algo-rithms. The values obtained by the two methods were relatively different, thus indicating that the definition of a calculation method may importantly influence the results, with some conditioning as to the design of drying equipment and definition of operating conditions. As the diffusion model is based on fundamental equations, whereas the thin layer model is based on empirical drying kinetic equations, the results obtained through the first method would be more reliable. The values of diffusivity and mass transfer coefficient for both calculating methodologies increased with in -creasing temperature, as expected, because higher temperatures tend to favour the moisture diffusion and also the convective mass transfer. The drying of thistle flower was faster at 65°C, taking only about 3 h to reach an approximately constant moisture content of about 5% or lower, in contrast to the 15 h needed when the drying took place at 35°C. Nevertheless, other factors must be considered when choosing the most appropriate drying temperature, namely to verify the effect of high temperatures on the activity of the aspartic proteases, which will later be fundamental for the coagulation of the milk in the cheese manufacturing process. Although this particular aspect was not investigated in the present study, it is important to suggest it as future work. Acknowledgments: This work was funded by National Funds through the FCT– Foundation for Science and Technology, I. P., within the scope of the project Refª UIDB/00681/2020. Furthermore, we would like to thank the CERNAS Research Centre and the Polytechnic Institute of Viseu for their support. This work was prepared in the ambit of the project approved andfinanced by FCT with reference 02/SAICT/2016/23290, titled “QClasse: Caracterização e Valorização da autenticidade do QSE DOP e sua vocação para a promoção da Saúde.”
Conflict of interest: The authors declare no conflict of interest.
References
[1] Aghbashlo M, Kianmehr MH, Samimi-Akhijahani H. Influence of drying conditions on the effective moisture diffusivity, energy of activation and energy consumption during the thin -layer drying of berberis fruit(Berberidaceae). Energy Convers Manag. 2008;49:2865–71. doi: 10.1016/
j.enconman.2008.03.009.
[2] Apinyavisit K, Nathakaranakule A, Mittal GS, Soponronnarit S. Heat and mass transfer properties of longan shrinking from a spherical to an irregular shape during drying. Biosyst Eng. 2018;169:11–21. doi: 10.1016/j.biosystemseng.2018.01.007. [3] Avhad MR, Marchetti JM. Mathematical modelling of the drying
kinetics of Hass avocado seeds. Ind Crop Products. 2016;91:76–87. doi: 10.1016/j.indcrop.2016.06.035. [4] Barracosa P, Oliveira J, Barros M, Pires E. Morphological
evaluation of cardoon(Cynara cardunculus L.): assessing biodiversity for applications based on tradition, innovation and sustainability. Genet Resour Crop Evolution.
2018;65:17–28. doi: 10.1007/s10722-017-0579-0. [5] Caparino OA, Tang J, Nindo CI, Sablani SS, Powers JR,
Fellman JK. Effect of drying methods on the physical proper-ties and microstructures of mango(Philippine “Carabao” var.) powder. J Food Eng. 2012;111:135–48. doi: 10.1016/
j.jfoodeng.2012.01.010.
[6] Crank J. The mathematics of diffusion, 2nd edn. London: Oxford University Press; 1975.
[7] Danish M, Jing H, Pin Z, Ziyang L, Pansheng Q. A new drying kinetic model for sewage sludge drying in presence of CaO and NaClO. Appl Therm Eng. 2016;106:141–52. doi: 10.1016/ j.applthermaleng.2016.05.191.
[8] Darıcı S, Şen S. Experimental investigation of convective drying kinetics of kiwi under different conditions. Heat Mass Transf. 2015;51:1167–76. doi: 10.1007/s00231-014-1487-x. [9] Dermesonlouoglou E, Chalkia A, Dimopoulos G, Taoukis P.
Combined effect of pulsed electric field and osmotic dehydration pre-treatments on mass transfer and quality of air dried goji berry. Innov Food Sci Emerg Technol.
2018;49:106–15. doi: 10.1016/j.ifset.2018.08.003. [10] Dias MI, Barros L, Barreira JCM, Alves MJ, Barracosa P,
Ferreira ICFR. Phenolic profile and bioactivity of cardoon (Cynara cardunculus L.) inflorescence parts: Selecting the best genotype for food applications. Food Chem. 2018;268:196–202. doi: 10.1016/j.foodchem.2018.06.081. [11] Dina SF, Ambarita H, Napitupulu FH, Kawai H. Study on
effectiveness of continuous solar dryer integrated with desiccant thermal storage for drying cocoa beans. Case Stud Therm Eng. 2015;5:32–40. doi: 10.1016/j.csite.2014.11.003. [12] Dincer I, Dost S. A modelling study for moisture diffusivities
and moisture transfer coefficients in drying of solid objects. Int J Energy Res. 1996;20:531–9. doi: 10.1002/(SICI)1099-114X (199606)20:6<531:AID-ER171>3.0.CO;2-6.
[13] Dincer I, Hussain MM. Development of a new Bi–Di correlation for solids drying. Int J Heat Mass Transf. 2002a;45:3065–9. doi: 10.1016/S0017-9310(02)00031-5.
[14] Dincer I, Hussain MM. Development of a new Bi–Di correlation for solids drying. Int J Heat Mass Transf. 2002b;45:3065–9. doi: 10.1016/S0017-9310(02)00031-5.
[15] Dissa AO, Bathiebo DJ, Desmorieux H, Coulibaly O, Koulidiati J. Experimental characterisation and modelling of thin layer direct solar drying of Amelie and Brooks mangoes. Energy. 2011;36:2517–27. doi: 10.1016/j.energy.2011.01.044. [16] Fiorentini C, Demarchi SM, Quintero Ruiz NA, Torrez
Irigoyen RM, Giner SA. Arrhenius activation energy for water diffusion during drying of tomato leathers: the concept of characteristic product temperature. Biosyst Eng.
2015;132:39–46. doi: 10.1016/j.biosystemseng.2015.02.004. [17] González-Pérez JE, López-Méndez EM, Ochoa-Velasco CE,
Ruiz-López II. Mass transfer and morphometric characteristics of fresh and osmodehydrated white mushroom pilei during convective drying. J Food Eng. 2019;262:181–8. doi: 10.1016/ j.jfoodeng.2019.06.017.
[18] Granella SJ, Bechlin TR, Christ D, Zanardi B, Rego JM, Machado Coelho SR. Improvement of heat & mass transfer with added ozone into drying air on corn-soy. Eng Agric Environ Food. 2019;12:427–34. doi: 10.1016/j.eaef.2019.07.001. [19] Guiné RPF, Henrriques F, Barroca MJ. Mass transfer
coeffi-cients for the drying of pumpkin(Cucurbita moschata) and dried product quality. Food Bioprocess Technol.
2012;5:176–83. doi: 10.1007/s11947-009-0275-y.
[20] Guiné RPF, Barroca MJ, Silva V. Mass transfer properties of pears for different drying methods. Int J Food Prop. 2013;16:251–62. doi: 10.1080/10942912.2011.551864. [21] Guiné RPF, Cruz AC, Mendes M. Convective drying of apples:
kinetic study, evaluation of mass transfer properties and data analysis using artificial neural networks. IJFE.
2014;10:281–99. doi: 10.1515/ijfe-2012-0135.
[22] Guiné RPF, Brito MFS, Ribeiro JRP. Evaluation of mass transfer properties in convective drying of kiwi and eggplant. Int J Food Eng. 2017;13. doi: 10.1515/ijfe-2016-0257.
[23] Haghi AK, Amanifard N. Analysis of heat and mass transfer during microwave drying of food products. Braz J Chem Eng. 2008;25:491–501. doi: 10.1590/S0104-66322008000300007.
[24] Hou L, Zhou X, Wang S Numerical analysis of heat and mass transfer in kiwifruit slices during combined radio frequency and vacuum drying. Int J Heat Mass Transf. 2020;154:119704. doi: 10.1016/j.ijheatmasstransfer.2020.119704
[25] Khan MdIH, Welsh Z, Gu Y, Karim MA, Bhandari B. Modelling of simultaneous heat and mass transfer considering the spatial distribution of air velocity during intermittent microwave convective drying. Int J Heat Mass Transf. 2020;153:119668. doi: 10.1016/j.ijheatmasstransfer.2020.119668.
[26] Khubber S, Chaturvedi K, Taghi Gharibzahedi SM, Cruz RMS, Lorenzo JM, Gehlot R, et al. Non-conventional osmotic solutes (honey and glycerol) improve mass transfer and extend shelf life of hot-air dried red carrots: kinetics, quality, bioactivity, microstructure, and storage stability. LWT. 2020;131:109764. doi: 10.1016/j.lwt.2020.109764.
[27] Kouchakzadeh A. The effect of acoustic and solar energy on drying process of pistachios. Energy Convers Manag. 2013;67:351–6. doi: 10.1016/j.enconman.2012.12.003.
[28] Mohammadi I, Tabatabaekoloor R, Motevali A. Effect of air recirculation and heat pump on mass transfer and energy parameters in drying of kiwifruit slices. Energy.
2019;170:149–58. doi: 10.1016/j.energy.2018.12.099. [29] Mota CL, Luciano C, Dias A, Barroca MJ, Guiné RPF. Convective
drying of onion: Kinetics and nutritional evaluation. Food Bioprod Process. 2010;88:115–23. doi: 10.1016/ j.fbp.2009.09.004.
[30] Nicolin DJ, Rossoni DF, Jorge LMM. Study of uncertainty in the fitting of diffusivity of Fick’s second law of diffusion with the use of Bootstrap method. J Food Eng. 2016;184:63–68. doi: 10.1016/j.jfoodeng.2016.03.024.
[31] Onwude DI, Hashim N, Abdan K, Janius R, Chen G, Kumar C. Modelling of coupled heat and mass transfer for combined infrared and hot-air drying of sweet potato. J Food Eng. 2018;228:12–24. doi: 10.1016/j.jfoodeng.2018.02.006. [32] Qiu J, Kloosterboer K, Guo Y, Boom RM, Schutyser MAI.
Conductive thinfilm drying kinetics relevant to drum drying. J Food Eng. 2019;242:68–75. doi: 10.1016/
j.jfoodeng.2018.08.021.
[33] Reyes A, Mahn A, Vásquez F. Mushrooms dehydration in a hybrid-solar dryer, using a phase change material. Energy Convers Manag. 2014;83:241–8. doi: 10.1016/
j.enconman.2014.03.077.
[34] Romdhane NG, Djendoubi N, Bonazzi C, Kechaou N, Boudhrioua Mihoubi N. Effect of combined air-drying-osmotic dehydration on kinetics of techno-functional properties, color and total phenol contents of lemon(Citrus limon. v. lunari) peels. Int J Food Eng. 2016;12:515–25. doi: 10.1515/ijfe-2015-0252.
[35] Roseiro LB, Viala D, Besle JM, Carnat A, Fraisse D, Chezal JM, et al. Preliminary observations offlavonoid glycosides from the vegetable coagulant Cynara L. in protected designation of origin cheeses. Int Dairy J. 2005;15:579–84. doi: 10.1016/ j.idairyj.2004.07.027.
[36] Sahin AZ, Dincer I, Yilbas BS, Hussain MM. Determination of drying times for regular multi-dimensional objects. Int J Heat Mass Transf. 2002;45:1757–66. doi: 10.1016/S0017-9310(01) 00273-3.
[37] Sahni EK, Chaudhuri B. Contact drying: a review of experi-mental and mechanistic modeling approaches. Int J Pharmaceutics. 2012;434:334–48. doi: 10.1016/ j.ijpharm.2012.06.010.
[38] Sallam YI, Aly MH, Nassar AF, Mohamed EA. Solar drying of whole mint plant under natural and forced convection. J Adv Res. 2015;6:171–8. doi: 10.1016/j.jare.2013.12.001.
[39] Scaglione D, Acquadro A, Portis E, Taylor CA, Lanteri S, Knapp SJ. Ontology and diversity of transcript-associated microsatellites mined from a globe artichoke EST database. BMC Genom. 2009;10:454. doi: 10.1186/1471-2164-10-454. [40] Silva WP, Precker JW, e Silva CMDPS, Gomes JP. Determination
of effective diffusivity and convective mass transfer coefficient for cylindrical solids via analytical solution and inverse method: application to the drying of rough rice. J Food Eng. 2010;98:302–8. doi: 10.1016/j.jfoodeng.2009.12.029. [41] Silva V, Costa JJ, Figueiredo AR, Nunes J, Nunes C, Ribeiro TIB,
et al. Study of three-stage intermittent drying of pears considering shrinkage and variable diffusion coefficient. J Food Eng. 2016;180:77–86. doi: 10.1016/
[42] Srikiatden J, Roberts JS. Measuring moisture diffusivity of potato and carrot(core and cortex) during convective hot air and isothermal drying. J Food Eng. 2006;74:143–52. doi: 10.1016/j.jfoodeng.2005.02.026.
[43] Tao Y, Zhang J, Jiang S, Xu Y, Show P-L, Han Y, et al. Contacting ultrasound enhanced hot-air convective drying of garlic slices: mass transfer modeling and quality evaluation. J Food Eng. 2018;235:79–88. doi: 10.1016/j.jfoodeng.2018.04.028. [44] Tripathy PP, Kumar S A methodology for determination of
temperature dependent mass transfer coefficients from drying kinetics: application to solar drying. J Food Eng.
2009;90:212–8. doi: 10.1016/j.jfoodeng.2008.06.025. [45] Vega-Gálvez A, Miranda M, Díaz LP, Lopez L, Rodriguez K,
Di Scala K. Effective moisture diffusivity determination and mathematical modelling of the drying curves of the olive -waste cake. Bioresour Technol. 2010;101:7265–70. doi: 10.1016/j.biortech.2010.04.040.
[46] Vijayan S, Arjunan TV, Kumar A Mathematical modeling and performance analysis of thin layer drying of bitter gourd in sensible storage based indirect solar dryer. Innov Food Sci Emerg Technol. 2016;36:59–67. doi: 10.1016/
j.ifset.2016.05.014.
[47] Wang D, Dai J-W, Ju H-Y, Xie L, Xiao H-W, Liu Y-H, et al. Drying kinetics of American ginseng slices in thin-layer air impinge-ment dryer. Int J Food Eng. 2015;11:701–11. doi: 10.1515/ijfe-2015-0002.
[48] Wei S, Wang Z, Wang F, Xie W, Chen P, Yang D. Simulation and experimental studies of heat and mass transfer in corn kernel during hot air drying. Food Bioprod Process. 2019;117:360–72. doi: 10.1016/j.fbp.2019.08.006.
[49] Zarein M, Samadi SH, Ghobadian B. Investigation of micro-wave dryer effect on energy efficiency during drying of apple slices. J Saudi Soc Agric Sci. 2015;14:41–7. doi: 10.1016/ j.jssas.2013.06.002.