Gaining insight into the photophysical properties of a coumarin STP ester with potential for
bioconjugation
M.González-Pérez,a S. Y. Ooi,b S. Martins,a João P. Prates Ramalho,b A. Pereira,a,b A. T. Caldeira a,b*
The photophysical properties of coumarin 392 4-sulfotetrafluorophenyl ester, C392STP (sodium (E/Z)-4-(4-(2-(6,7-dimethoxycoumarin-3-yl)vinyl)-benzoyl)-2,3,5,6-tetrafluoro-benzenesulfonate) an amine reactive coumarine with potential for bioconjungation, have been studied in different solvents. Strong red shifts (31 to 56 nm on going from dioxane to DMSO and PBS, respectively) were observed in the emission spectra by increasing the solvent polarity while the absorption spectra remain slightly changed. It was found that in addition to non specific solute-solvent interactions, in protic solvents specific interactions such as hydrogen-bonding occur. The photophysical behaviour of coumarin also pointed out to an increase of the polarity of the molecule upon excitation. The molar absorption coefficient, ε385 = 1.03 ˑ 104 M-1cm-1 and brigtness, ε x Φ = 1.18 ˑ 103 M -1cm-1, of the coumarin ester were found to be moderate in PBS even if the fluorescence quantum yield (Φ = 0.115) was found to be relatively low. The large stokes shifts (Δλ = λem-λ abs were found to increase from 74 nm in dioxane to 136 nm in PBS), the photostability and pH insensitivity are characteristics that turn C392STP, into a promising fluorescent dye with potential applications in different fields.
Introduction
Coumarins have a long history as fluorescent dyes.1 These benzopyrones are widely distributed in nature and new ones are continuously being synthesized and commercialized due to their excellent light stability and the relative ease in tuning their photophysical properties by chemical substitution.2–4 Coumarins that favor reactions of interest with target biomolecules, metals or reactive groups have been extensively exploited as fluorescent labels3–8 (e.g. coumarins containing amine reactive moieties, sulfotetrafluorophenyl (STP) or N-hydroxysuccinimide (NHS) esters, are efficient dyes for biolabeling of molecules containing primary amine groups).2,9–11
Coumarin-based compounds have a wide range of applications in fields as varied as coloring of materials, cell biology, medical analysis, development of photophysical systems and conservation.1,7,12–15 They are used as dye lasers, daylight fluorescent pigments, labels for biomolecules, optical brighteners, sensors for viscosity, flow or density, fluorescent chemosensors, biosensor and as dyes in fluorescent adhesives for artifact reconstruction repair in art conservation.1,7,12–15 The applications of fluorescent dyes are highly dependent on their photophysical and photochemical properties - UV−vis absorption and fluorescence spectra, molar extinction coefficients, quantum efficiencies, Stokes shifts, pH- and thermal stabilities among others16,17- and on their variation with the surrounding medium.13,18,19 Studying the properties of new synthesized fluorophores is of utmost importance for determining their potential applications and for better exploiting their characteristics.
Thus, the determination of the photophysical properties of coumarin derivatives has been and continues to be the focus of numerous investigations.2,16,20 The fluorescent coumarins used as dyes and sensors have excellent spectroscopic properties as high quantum yields (up to 0.90), good extinction coefficients (10,000–40,000), and large Stokes shifts (up to 160 nm).4,21 New coumarin-based fluorophores with improved Stokes shifts, high fluorescent quantum yields and/or molar absorption coefficients are continuously being synthetized.3,6,13 In fact, various substituted coumarins (and hybrid dyes based on them) are among the most applied and important fluorophores exhibiting large Stokes shifts.6,12
In this work, the spectral characteristics of a recently synthesized coumarin 4-sulfotetrafluorophenyl ester (C392STP, Scheme 1) were studied.22 This compound has been previously shown to be an efficient building block for synthesizing RNA-FISH probes by labelling of amine-modified oligonucleotides.22
Systematic analysis of the solvent effects on its electronic absorption and emission spectra was carried out using several solvatochromic models (Lippert-Mataga, Bakhshiev, Ravi, Kawski-Chamma-Viallet, Kamlet–Taft and Catalan).23–25 Also, the photostability, E/Z thermoisomerization and the influence of pH on the stability of the compound in aqueous solution were investigated.
To the best of our knowledge, this is the first study focused on gaining insight into the photophysical properties of this dye and
Scheme1. Structure of C392STP, sodium (E/Z)-4-(4-(2-(6,7-dimethoxycoumarin-3-yl)vinyl)-benzoyl)-2,3,5,6-tetrafluoro-benzenesulfonate.
their comparison with that of other coumarins and commercially available fluorescent compounds. This could open the door for elucidating its potential as fluorescent dye in diverse fields.
Results and discussion
The Coumarin 392 STP ester resulting from the synthesis performed by us,22 with a high yield (98%), is formed by a mixture of E and Z isomers (Scheme 1). The E/Z ratio determined by H-NMR (84:16), suggested the existence of a small energy gap between the E and Z species and the higher stability of the E isomer.
Spectral characteristics of C392STP and solvent effects. C392STP is a yellow powder (Figure 1A) that has revealed to be
a promising fluorescent dye for its use in RNA-FISH technique.22 Its solutions in polar protic and aprotic solvents are yellow under daylight illumination (Figure 1B).
Despite the proven potential of C392STP as fluorescent marker, its photophysical properties have not already been investigated in depth. To deep the knowledge about the photophysical characteristics of this fluorophore and its interaction with the solvents is crucial not only for improving its performance as fluorescent label for biomolecules but also for discovering new potential uses for it. The influence of environmental effects on the photophysics of substituted coumarins has already been extensively studied with in silico calculations and steady state and time resolved spectroscopy.2,26–31 It has been found that the variation of the surrounding medium (in terms of polarity, dielectric constant, polarizability) affects the ground and the excited states differently.13,27,29,32 The absorption and emission spectra of these compounds can be influenced in such a manner by the solvent that the solvatochromism observed for some coumarins has previously been exploited for monitoring the polarity and microviscosity of the environment 3,15,32,33 and for determining the dipole moments of the ground and excited states as well as of the variation between them.13,27,30
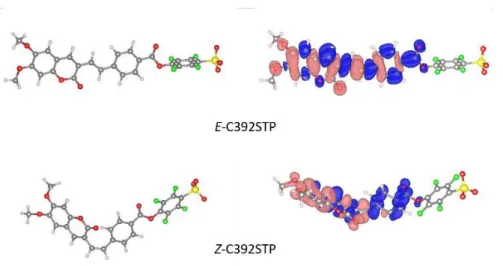
In Silico Calculations.It is known that Density Functional Theory (DFT) methods can predict with good accuracy the structure and spectroscopic properties of coumarins.21 Thus, DFT calculations were performed to gain more insight into the geometric and electronic properties of the E- and Z-C392TFP isomers and of the mixture E/Z 84/16 (synthesis product). Figure 2 shows the minimum-energy molecular geometry computed at the B3LYP/6-31+G(d) level for the E- and Z-C392TFP isomers in THF (the geometries in the other solvents were found to be very similar). The E isomer shows a nearly coplanar structure, suggesting an efficient pi conjugation through the molecule, while the Z isomer is twisted out of plane of the carbon-carbon double bond due to the steric hindrance. The oscillator strength (f) and the maximum absorption wavelengths of the key-transitions for both isomers in different solvents were calculated (ESI, Table S1). The energies found for the E isomer are around 7-8 kcal mol-1 lower than those of the Z isomer (ESI, Table S2), independently of the solvent used, as expected, since the bulky groups on the same side on the Z isomer cause repulsive interactions forcing the aromatic ring out-of-plane. These results show that the E isomer is the most stable form and are in accordance with the NMR spectroscopic results, that shows the E isomer as the most abundant species.
Figure 1. C392STP powder (A), C392STP solutions under daylight illumination (B) and under UV illumination (365 nm) in
different solvents: DMSO (1), DMF (2), acetone (3), THF (4), ethyl acetate (5), dioxane (6), PBS 22 Mm (7), water (8), ethanol/water 40/60 (v/v) (9), ethanol/water 20/80 (v/v) (10), methanol (11), ethanol (12), propanol (13), 1-butanol (14) (C). Absorption and emission spectra of C392STP obtained in solvents 1-14 (D).
Figure 2. Optimized molecular geometry for E- and Z-C392STP in THF at the B3LYP/6-31+G(d) level (left) where oxygen, carbon,
sulfur, fluoride and hydrogens atoms are marked in red, gray, yellow, green and white, respectively. Contour plots of the electron density difference (Δρ) of the lowest energy excitation for the E and Z conformers (right), where blue indicates a positive contribution (increase of electron density) while pink represents a depletion of electron density.
The solvatochromic behaviour of the C392STP isomers and of the E/Z mixture (84/16) were analyzed using Time Dependent Density Functional Theory (TDDFT) methods. The calculations were performed using the Polarizable
Continuum Model (PCM), for THF, methanol and water. The simulated absorption spectra, for both the isomers as well as for their mixture and its comparison with the experimental spectra can be found in the Supporting Information (ESI, FigureS1). The calculated lower energy transitions in terms of energy, oscillator strength, together with the experimental absorption maxima, are depicted in Table 1.
The presented values refer to the maxima of the convoluted bands. Experimental; b FWHM , Full Width at Half-Maximum values.
The lowest-energy S0->S1 transition can be ascribed to π→π* electron transitions and are mainly of HOMO→LUMO character, for the both conformers. An illustrative picture of the charge rearrangement that occurs upon the S0->S1 transitions in THF is given in Figure 2. The difference between the electronic densities of the states involved in the transitions is depicted, revealing more clearly the regions of the chromophore that loose or gain electrons. The calculated lowest energy transition, S0->S1, in different solvents (Table 1), show a very good agreement with the experimentally measured wavelengths of the coumarin derivative chromophore absorption in non-aqueous solvents (Table 2). However, it is not capable to reproduce the blue shift that occurs in water. This can be attributed to the use of continuum models in which specific interactions between the solute and the solvent need special considerations. Therefore, an explicit solvent cluster model was also used to model the absorption spectra of the isomers in aqueous solutions. In this model the solvation of both isomers of C392STP was performed with a total of 9 explicit water molecules. The coumarin-water complex was optimized and its absorption spectra was calculated by TDDFT, embedded in a PCM water medium (Table ESI, S1). When compared with the continuum model, the explicit water model excitation corresponding to S0→S1 transition shifts to higher energies than in non-aqueous solvents (Table 1), as observed experimentally (Table 2), although with a smaller blue shift than in experiment.
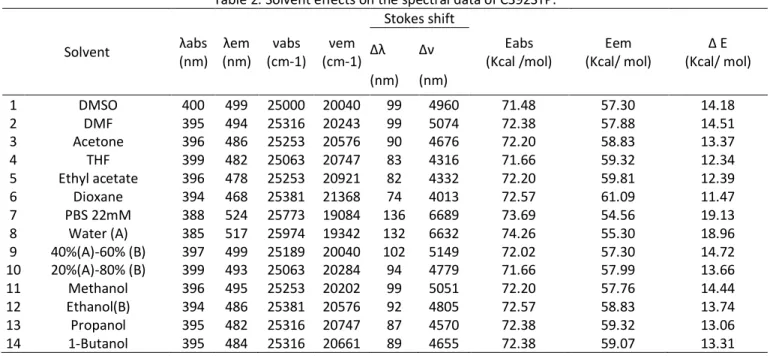
Table 2. Solvent effects on the spectral data of C392STP.
Solvent λabs (nm) λem (nm) νabs (cm-1) νem (cm-1) Stokes shift Eabs (Kcal /mol) Eem (Kcal/ mol) Δ E (Kcal/ mol) Δλ (nm) Δν (nm) 1 DMSO 400 499 25000 20040 99 4960 71.48 57.30 14.18 2 DMF 395 494 25316 20243 99 5074 72.38 57.88 14.51 3 Acetone 396 486 25253 20576 90 4676 72.20 58.83 13.37 4 THF 399 482 25063 20747 83 4316 71.66 59.32 12.34 5 Ethyl acetate 396 478 25253 20921 82 4332 72.20 59.81 12.39 6 Dioxane 394 468 25381 21368 74 4013 72.57 61.09 11.47 7 PBS 22mM 388 524 25773 19084 136 6689 73.69 54.56 19.13 8 Water (A) 385 517 25974 19342 132 6632 74.26 55.30 18.96 9 40%(A)-60% (B) 397 499 25189 20040 102 5149 72.02 57.30 14.72 10 20%(A)-80% (B) 399 493 25063 20284 94 4779 71.66 57.99 13.66 11 Methanol 396 495 25253 20202 99 5051 72.20 57.76 14.44 12 Ethanol(B) 394 486 25381 20576 92 4805 72.57 58.83 13.74 13 Propanol 395 482 25316 20747 87 4570 72.38 59.32 13.06 14 1-Butanol 395 484 25316 20661 89 4655 72.38 59.07 13.31
Table 1. Calculated absorption data of the lowest energy transition
for both isomers in different solvents.
Solvent E isomer Z isomer E/Z mixture Experimental λ (nm) f λ (nm) f λ(nm)a λ, FWHM (nm)b THF 409 1.773 384 0.870 408 399, 68 Methanol 410 1.753 388 0.847 409 396, 69 Water 411 1.753 389 0.824 410 385, 74 Explicit water 406 1.826 375 0.786 405
Experimental results.The absorption and steady-state fluorescence spectra of C392STP were recorded in solvents with different physical properties including different dipolarity/polarizability and hydrogen-bonding ability (Figure 1C). The maximum absorption and emission wavelengths (λabs and λem, respectively) are summarized in Table 2.
Absorption.The absorption spectra of C392STP showed a broad absorption band in the region 300-500 nm (Figure 1D) with maximum at 394-400 nm in non-aqueous solvents (Figure 1D and Table 2). The absence of solvent-polarity dependence of the absorption maximum in non-aqueous solvents might imply that the ground state energy distribution is not affected in a great extent by the polarity of the solvent. This is possibly dueto the low polar nature of the dye in the ground state. However, the change of solvent, from non-aqueous to aqueous, causes a slight blue shift of around 11-15 nm (λabs = 385 nm in water and λabs = 400 nm in DMSO). This shift can be attributed to specific solvent-solute interactions, and more specifically to hydrogen-bonding interactions in which the coumarin moieties act as hydrogen acceptor, since the proton-donating capability of water is higher than that of other protic solvents (see SA parameter Table 3).
Emission. Blue emission was observed in polar solvents for the E/Z isomers mixture. The bright blue fluorescence of
C392STP under irradiation with 365-366 nm ultraviolet light is detectable with the naked eye (Figure 1C). This could be of great interest for its application in a wide variety of fields. The emission spectra showed only one broad band in the 400-600 nm region and the maxima are strongly solvent dependent. An increase of the solvent polarity induced a red shift of the wavelength of maximum absorption in both aprotic and protic solvents (from 468 nm in dioxane to 499 nm in DMSO). This fact (Table) indicates an increase in polarity (dipole moment) upon excitation.
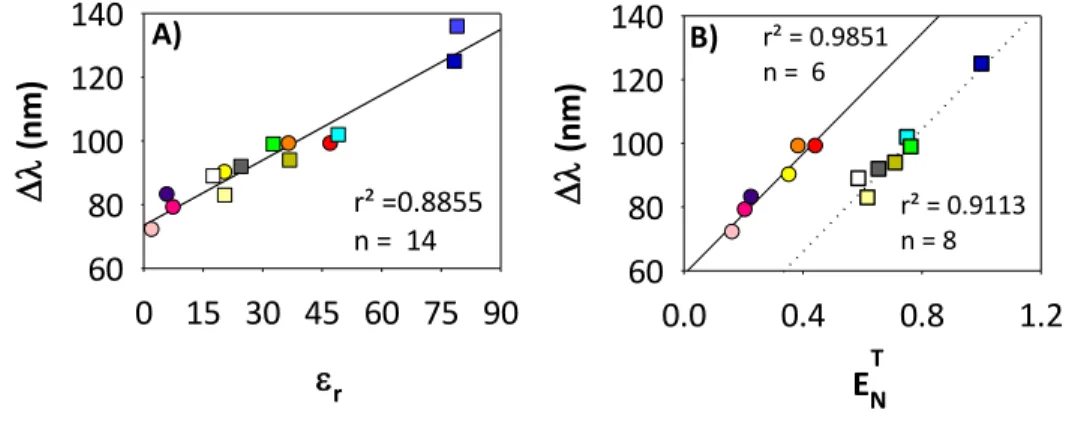
A direct linear correlation was found between λem or Δλ and Ɛr for most of the solvents used (Figure 3A). However, the deviations from linearity indicated that, whereas the relative permittivity is one of the main factors governing the solvent shift it is not the sole one. This was confirmed using the empirical solvent polarity index or normalized transition energy, ETN, for studying the solvent–solute interactions.34 The plot of the stokes shift of the dye in different solvents against the solvent empirical polarity scale gave linear correlations for two separated solvent classes, protic and aprotic (Fig. 3B). This behaviour has also been found by other authors investigating the solvatochromism of coumarins as well as other compounds.25 It can be explained considering that ET
N parameter represents only a dipolarity/polarizability and acidity contribution of the solvent but not basicity contribution of the solvent or specific solvent-solute interactions.25,34 This revealed that, upon excitation whereas in aprotic solvents only non-specific solvent solute interactions occur, in protic solvents the contribution of the specific solvent-solute interactions (hydrogen bonding) are considerable. Thus, when solubilized in protic solvents, the hydrogen bonds formation stabilizes the excited state of C392STP decreasing its energy. This is in accordance with the red shift of the emission spectrum found in aqueous solutions (see Table 2). Also, the strong batochromic shift observed in the emission
Table 3. Physical properties, empirical solvent polarity indexes, Kamlet–Taft and Catalan parameters of selected solvents.
Solvent εra ηb ETN d
Kamlet-Taft Parameters Catalan Parameters
α β π* SA SB SP SdP 1 DMSO 47.24 1.4793 0.444 0 0.76 1 0.072 0.647 0.83 1 2 DMF 36.71 1.4305 0.386 0 0.69 0.88 0.031 0.613 0.759 0.977 3 Acetone 20.56 1.3587 0.355 0.08 0.48 0.62 0 0.475 0.651 0.907 4 THF 7.58 1.4072 0.207 0 0.55 0.55 0 0.591 0.714 0.634 5 Ethyl acetate 6.02 1.3724 0.228 0 0.45 0.45 0 0.542 0.656 0.603 6 Dioxane 2.21 1.4224 0.164 0 0.37 0.49 0 0.444 0.737 0.312 7 PBS 22mM 79 1.3355 n.a. n.a. n.a. n.a. n.a. n.a. n.a. n.a. 8 Water (A) 78.36 1.333 1 1.17 0.47 1.09 1.062 0.025 0.681 0.997 9 40%(A)-60% (B) 49.06 1.3626 0.75 n.a. n.a. n.a. n.a. n.a. n.a. n.a. 10 20%(A)-80% (B) 36.81 1.3657 0.71 n.a. n.a. n.a. n.a. n.a. n.a. n.a. 11 Methanol 32.66 1.3284 0.762 0.98 0.66 0.6 0.605 0.545 0.608 0.904 12 Ethanol(B) 24.55 1.3614 0.654 0.86 0.75 0.54 0.4 0.658 0.633 0.783 13 Propanol 20.45 1.3856 0.617 0.84 0.9 0.52 0.367 0.727 0.658 0.748 14 1-Butanol 17.51 1.3993 0.586 0.84 0.84 0.47 0.341 0.809 0.674 0.655 n.a.: data not available in the literature or not found by us.
a Dielectric constant. b Refractive index. c Reichardt empirical polarity parameter. d Molecular-microscopic solvent polarity parameter. The values of these parameters were taken from Ref.34
spectra with solvent polarity while the absorption spectra remain unchanged indicate a π-π* transition (π*-π fluorescence is more sensitive to hydrogen bonding than π-π* absorption).1
Solvent effects on the Stokes shift and emission spectra of C392STP. As shown in Figure 1, in all the solvents investigated
the spectral overlap between the absorption and fluorescence of the novel coumarin dye was small. Large Stokes shifts (separation between the absorption and emission maxima measured in nm or cm-1, Δλ and Δν, respectively) were obtained for this compound (Table 2). They are lower for dioxane (Δλdioxane = 74
nm) than for PBS (ΔλPBS = 136 nm). The Stokes shift obtained for C392STP in PBS is higher than those of common fluorophores with different skeletons such as fluorescein, rhodamine, cyanine, nile red and BODIPY dyes (ΔλPBS≤ 70 nm).11,12 Notwithstanding, they are higher (Table 2) than that of several commercially available coumarin dyes (Table 4) including AlexaFluor™ 488 (λabs = 494 nm, λem 519 nm and ΔλPBS = 25 nm) a commonly used fluorescent dye also commercialized in the TFP ester form for labeling proteins and oligonucleotides.35 It is particularly relevant that the Stokes shifts found for C392STP ester are similar, in terms of magnitude, to those exhibited by some commercially-available coumarins with large Stokes shifts: ‘Mega Stokes’ dyes from Dyomics (λabs = 500–520 nm, λem = 590–670 nm and Δλ = 90- 150 nm in ethanol) or AlexaFluor™ 430 (λabs = 434 nm, λem 539 nm and ΔλPBS = 105 nm).6,12 A great Stokes shift, such as that showed by C392STP, is beneficial for practical application since: reduces self-quenching, boosts the signal-to-noise ratio in bioimaging applications and allows to perform multicolor experiments reducing the number of detection channels, avoiding spectral overlap artifacts (bleed-through or crosstalk) and simplifying the imaging scheme.2,6,11,12 Thus, as other fluorescent dyes with large Stokes shifts, C392STP could initially be successfully applied as sensor, molecular probe and light-emitting marker in chemistry, life sciences and optical microscopy.
Studying the influence of the polarity of the solvent on the Stokes shift (Figure 3A) it was found that C392STP is most susceptible to solvent polarity than other commercial coumarins (with a slope (m) of m = 0.6833 (r2 = 0.9322) AMCA:
m = 0.49, r2 = 0.73; Coumarin 1: m = 0.62, r2 = 0.71; Coumarin 6: m = 0.39, r2 = 0.2).32 The strong fluorescence solvatochromism displayed by C392STP, point out the possibility of using it as polarity sensor.
E
N0.0
0.4
0.8
1.2
(
n
m
)
60
80
100
120
140
A)
r0 15 30 45 60 75 90
(
n
m
)
60
80
100
120
140
r² =0.8855 n = 14 B) T r² = 0.9113 n = 8 r² = 0.9851 n = 6Figure 3. Stokes shift dependence on: (A) the permittivity of the medium (Ɛr) and (B) the normalized transition energy (ETN). The Stokes shift values of C392STP increased with solvent polarity for both protic and aprotic solvents (25 nm from dioxane to DMSO and 47 nm from 1-butanol to PBS). This fact also supports the increase in the dipole moment upon excitation.13,34,36 By comparing the Stokes shifts exhibited b C392STP in aprotic and protic solvents with similar dielectric constants (acetone and DMF with propanol and ethanol/water (80/20), respectively) only slightly differences were found (3-5 nm larger in aprotic solvents (Tables 2 and 3) being the regression lines (Δλ/ET
N) obtained for both type of solvents almost parallel, Figure 3B). The highest Stokes shifts were found in water and PBS. This could be due, again, to the higher proton-donating capability of water than of other protic solvents.18
Solvent effects on the Stokes shift of dye molecules (Δν) may arise from physical intermolecular solute-solvent interactions (dipolar interactions) or chemical processes (such as electron or proton transfer, complexation or isomerization).34,36 Thus, for gaining insight into the solvent effects on the spectral shifts of C392STP six different empirical solvatochromic models were used: The Lippert-Mataga’s (LM,), Bakhshiev’s (B), Kawski-Chamma-Viallet’s (KCV), Ravi (R), Taft-Kamlet’s (TK) and two Catalan’s models (C3P and C4P). All these models have already demonstrated their potential for understanding coumarins-solvents interactions and some of them have also been used for calculating the variation of the transition dipole moment upon excitation.2,24,26,27
The results of the statistical treatment of the data obtained for polar protic and aprotic solvents using the models based on the reaction field theories– LM, B and KCV- and the corresponding plots are summarized in the Electronic Supplementary Information (ESI, Table S3). No linear correlations were found between the Stokes shifts (Δν) and the solvent orientation polarity functions, fx (ε, n) considering all the solvents investigated. The protic and the aprotic solvents are clearly divided in two domains. This behavior has been previously reported in case of polarity probes like PRODAN and its analogues.37,38 This has been attributed to the fact that the models used (LM, B and KCV) do not Table 4. Photophysical properties of several coumarin dyes with proven application as fluorescent dyes in various
fields. Fluorescent dye λ abs / λem (nm) Δλ (nm) ε (104 M−1 cm−1) Φ Brightness (104 M−1cm−1) Solvent Ref Pacific Blue 400/447 150 3.0 0.55 1.62 H20 12
Pacific Orange 390/540 150 n.a. n.a. n.a. H20 12
BD Horizon™ V500 415/500 85 n.a. n.a. n.a. H20 12
Alexa430 434/539 105 Alexa488 495/519 24 7.1 0.92 6.53 PBS 35 Alexa 594 590/617 27 9.0 0.66 5.94 PBS 35 Atto 390 390/479 89 2.4 0.90 0.02 H20 35 Atto 488 501/523 22 9.0 0.80 7.20 PBS 35 Atto 532 532/551 21 11.5 0.90 10.35 PBS 35 Atto 655 663/684 21 12.5 0.30 3.75 PBS 35 Atto 700 700/719 19 12.0 0.25 3.00 PBS 35
DY-344IN 342/455 113 2.7 n.a. n.a. EtOH 12
DY-350XL 349/610 261 1.6 n.a. n.a. EtOH 12
DY-360XL 362/459 97 2.5 n.a. n.a. PBS 12
DY-370XL 368/473 105 1.3 n.a. n.a. PBS 12
DY-395XL 396/572 176 2.0 n.a. n.a. EtOH 12
DY-396XL 392/572 180 2.7 n.a. n.a. EtOH 12
DX-480 500/630 130 5.0 n.a. n.a. EtOH 12
CR1 594/646 52 2.7 0.01 0.03 H20 3 CR2 601/658 57 4.5 <0.01 n.a. H20 3 CR3 612/684 72 3.9 <0.01 n.a. H20 3 CR1E 596/652 56 7.2 0.01 0.07 H20 3 CR2E 602/666 64 7.6 <0.01 n.a. H20 3 CR3E 616/687 71 6.6 <0.01 n.a. H20 3
c1 367/451 84 n.a. n.a. n.a. EtOH 27
c102 382/473 90 n.a. n.a. n.a. EtOH 27
c120 350/433 83 n.a. n.a. n.a. EtOH 27
c151 376/490 114 n.a. n.a. n.a. EtOH 27
c152 390/519 128 n.a. n.a. n.a. EtOH 27
c153 422/532 110 n.a. n.a. n.a. EtOH 27
FR521 520/700 180 3.5 0.01 0.02 PBS 9
consider molecular aspects of solvation and chemical interactions and should indicate the existence of a specific solvent effect, most probably intermolecular H-bonding between the solute and the solvent molecules.34,36,37,39
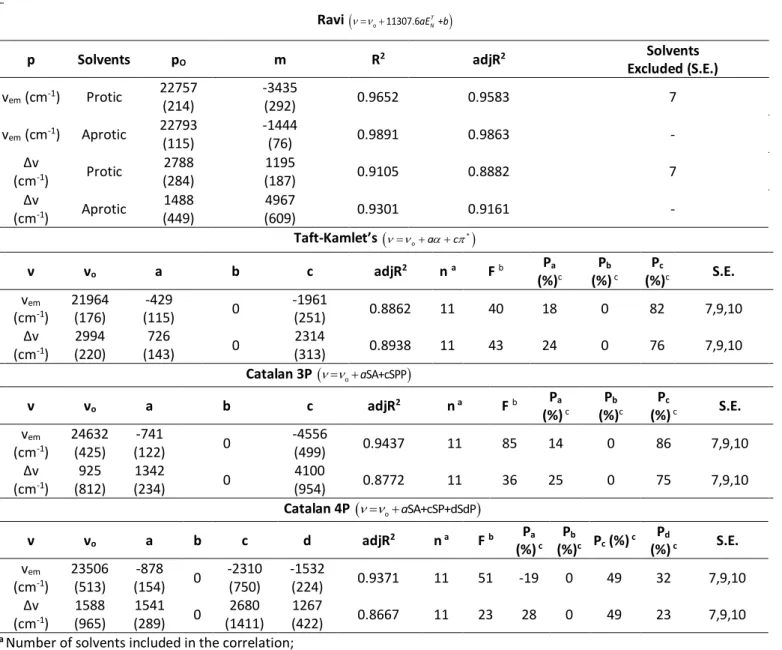
When specific interactions between solute and solvent molecules can contribute to the Stokes’ shifts, models such as Ravi’s model, which applies the empirical solvent polarity index, ENT (considering dipolarity/polarizability and acidity) are used to investigate the solvent-solute interaction effects on the Stokes shift. Good linear correlations were found for two separated solvent classes, polar protic (excluding PBS 22mM) and aprotic indicating that: i) this model allows accurately model the Stokes shifts variation of C392STP in both protic and aprotic solvents (Table 5); and ii) suggests the presence of an additional
Table 5. Results of the statistical treatment of the Ravi, Taft-Kamlet’s and Catalan’s correlations considering two parameters, p
(the emission frequencies and stokes shift) in the solvents selected: slopes (m), intercepts (p) and correlation coefficients (R2 and adjR2).
Ravi
o 11307.6 +
T NaE b
p Solvents pO m R2 adjR2 Excluded (S.E.) Solvents
vem (cm-1) Protic 22757 (214) -3435 (292) 0.9652 0.9583 7 vem (cm-1) Aprotic 22793 (115) -1444 (76) 0.9891 0.9863 - Δv (cm-1) Protic 2788 (284) 1195 (187) 0.9105 0.8882 7 Δv (cm-1) Aprotic 1488 (449) 4967 (609) 0.9301 0.9161 - Taft-Kamlet’s
*
o a c ν νo a b c adjR2 n a F b Pa (%)c Pb (%) c Pc (%)c S.E. vem (cm-1) 21964 (176) -429 (115) 0 -1961 (251) 0.8862 11 40 18 0 82 7,9,10 Δv (cm-1) 2994 (220) 726 (143) 0 2314 (313) 0.8938 11 43 24 0 76 7,9,10 Catalan 3P
o aSA+cSPP
ν νo a b c adjR2 n a F b Pa (%) c Pb (%)c Pc (%) c S.E. vem (cm-1) 24632 (425) -741 (122) 0 -4556 (499) 0.9437 11 85 14 0 86 7,9,10 Δv (cm-1) 925 (812) 1342 (234) 0 4100 (954) 0.8772 11 36 25 0 75 7,9,10 Catalan 4P
o aSA+cSP+dSdP
ν νo a b c d adjR2 n a F b Pa (%) c Pb (%)c Pc (%) c Pd (%) c S.E. vem (cm-1) 23506 (513) -878 (154) 0 -2310 (750) -1532 (224) 0.9371 11 51 -19 0 49 32 7,9,10 Δv (cm-1) 1588 (965) 1541 (289) 0 2680 (1411) 1267 (422) 0.8667 11 23 28 0 49 23 7,9,10a Number of solvents included in the correlation;
b Fisher’s tests;
c Percentage contribution of solvatochromic parameters.
interaction between C392STP and polar protic solvents which is ignored in the reaction field approaches.26 The results indicate that interaction with aprotic (polar but non-hydrogen bonding) solvents depends on dipole–dipole forces,
while with protic solvents, additional specific solvent-solute interactions exits. H- bonding, notably contributes to the change in the spectra observed for C392STP in these solvents.25
Multiparameter models that independently quantifies the influence of both specific and non-specific solvent-solute interactions (KT, C3P and C4P) generally work better for investigating the solvent effects on the absorption and emission spectra, as well as on the Stokes’ shifts of coumarin dyes than the reaction field model and Ravi’s method.2,27 Thus, they were used to investigate the effect of solvent dipolarity/polarizabilityand hydrogen bonding on the emission maxima (νem), and the Stokes shifts (Δν = νabs − νem), all in cm−1. The multiple linear regressions can be described by the following equations:
𝝂 = 𝝂𝟎+ 𝒂𝜶 + 𝒃𝜷 + 𝒄𝝅∗ (𝐊𝐓) (𝟏)
𝝂 = 𝝂𝟎+ 𝒂𝑺𝑨 + 𝒃𝑺𝑩 + 𝒄𝑺𝑷𝑷 (𝐂𝟑𝐏) (𝟐)
𝝂 = 𝝂𝟎+ 𝒂𝑺𝑨 + 𝒃𝑺𝑩 + 𝒄𝑺𝑷 + 𝒅𝑺𝒅𝑷 (𝐂𝟒𝐏) (𝟑)
where ν0 represent the physicochemical property of interest in the absence of solvent (i.e., in the gas phase). Kamlet– Taft model parameters α, β and π* denote the hydrogen bond donor (HBD) ability, hydrogen bond acceptor (HBA) ability and polarity (dipolarity and polarizability jointly) of the solvents, respectively. The Catalan model parameters SA, SB characterize specific interaction effects, solvent acidity and basicity, respectively, and the polarity SPP, unspecific solvent effects, that can be separated into two parameters: solvent polarizability (SP) and dipolarity (SdP).
a–d are the regression coefficients and their magnitude and sign describe the sensitivity of the property ν to the
different types of the solvent–solute interactions. For obtaining reliable results for solutes as C392STP, capable of accepting hydrogen bonds from a protic solvent but not capable of donating hydrogen bonds, physically invalid terms in the best-fit equations derived from KT,C3P and C4P models were avoided forcing the values of b to null.2 The equations used, the solvatochromic parameters thus obtained and their percentage contribution as well as the solvents excluded are summarized in Table 5. Only the physically valid best-fit, using the F and adjR2 values as criterion for its determination, are shown.
The three models gave satisfactory results and the regression coefficient sets obtained (a, c and d) and their percentage contributions (Pa, Pb and Pc) are in good agreement between them. Thus, the Kamlet-Taft and Catalan approaches demonstrated excellent statistical performance in describing the solvatochromism of C392STP spectra due to specific and non-specific interactions with the solvents. Furthermore, the best-fit coefficients of these models allow to gain a deeper insight into the nature of the solvent-coumarin interactions. The values of a, c and d are relatively large indicating that the hydrogen bond aceptor (HBA) ability and the polarity of the solvents are major effects on the solvatochromic change.2,25,38 The negative sign of these coefficients for ν
em and positive signs for Δν regressions indicates that an increment of the solvent hydrogen-bond acidity, the solvent polarizability or the solvent dipolarity produce a bathochromic shift in the emission spectra and greater stabilization of the excited state compared to the ground state revealing larger increase in dipole moment of excited state than of ground state.18,40 Considering the percentage contribution of the solvatochromic parameters obtained with KT and C3P models it can be concluded that the polarity of the solvent is the dominant effect (with 75 and 86% contribution for the changes in
νem and Δν, respectively). However, H-bonding also plays a key role to the red shifting of C392STP emission spectra (25% contribution). The Catalán4P model (C4P) offers insights on the roles of solvent polarizability on C392STP spectral shifts. The results obtained indicated that solvent polarizability is the most critical factor (representing a contribution of 49%). Also, the transition energy of C392STP in vacuo can be predicted from the fits for the three multiparameter models since the values obtained are in reasonable agreement between them (Table 5).
Molar Absorption Coefficient (ε), Quantum Yield (Φ) and brightness (ε x Φ). High molar extinction coefficients and
quantum yields are preferred in general for fluorescent dyes, as their product corresponds to the fluorescence brightness.2 The molar extinction coefficients of C392STP in PBS, water, acetone and DMSO were determined at the wavelengths of maximum absorption. Their values were found to be moderate in all these solvents (ε385 = 1.03 ˑ 104 M-1cm-1, ε
388 = 1.85 ˑ 104 M-1cm-1, ε396 = 2.0 ˑ 104 M-1cm-1, ε400 = 1.98 ˑ ˑ 104 M-1cm-1, respectively) when compared with the values obtained for other compounds and coumarins (Table 4).
The quantum yield was calculated exclusively in PBS. Two quantum yield standards were used as reference: Quinine Sulfate (QS) in 0.5 M H2SO4 (ΦR = 0.546) and 9,10-diphenylanthracene (DPA) in ciclohexane (ΦR = 0.955). The
quantum yield of C392STP in PBS was determined to be 0.115 (mean of the values obtained using both references, 0.11 with QS and 0.12 with DPA, respectively). This value is relatively low, lower than those obtained for commercially available coumarins but much higher than those of various synthetized coumarins described previously (Table 4).
The values of the molar extinction coefficient and quantum yield, in agreement with the results obtained in silico and with the lack of shift of the absorption spectrum and the red shift of the emission spectrum with increasing solvent polarity, revealed a π-π* S0-S1 transition.
Low brightness has been referred as one of the main drawbacks of many fluorescent dyes with large Stokes shifts.12 However, this is not the case, as the brightness of C392STP has found to be moderate (ε x Φ = 1.18 ˑ 103 M-1cm-1), similar to those obtained for other synthetized coumarins with very large Stokes shifts - >100 nm suitable for bioconjugation and STED microscopy.6 The brightness of this novel coumarin is higher than those of other synthetized coumarins successfully used as chemosensors or for biolabeling and even higher of that of a commercially available dye, Atto 390, with application in labeling of biomolecules (Table 4).
Behaviour of C392STP in aqueous solution
Influence of pH. Rhodamine and fluorescein dyes as well as some coumarins, commercially available (including Alexa
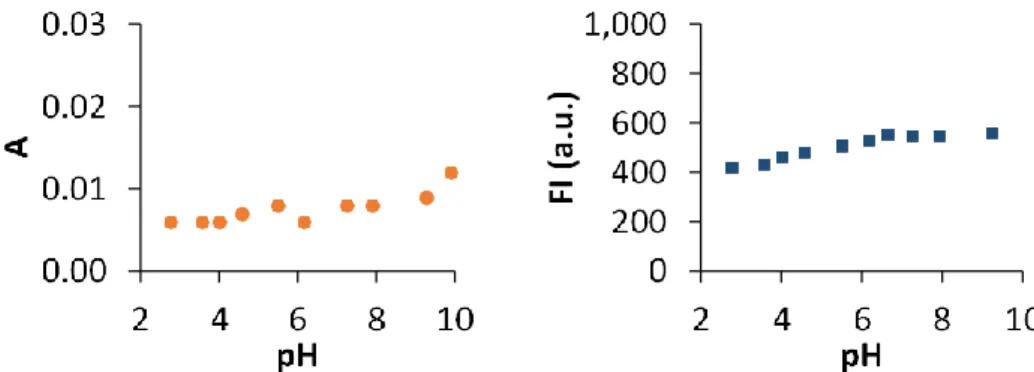
dyes) have maintained their popularity because of their greater resistance to photodegradation and pH insensitivity.41 Variation of the pH can modify the absorption and emission properties of the fluorescent dyes and determine their applicability. Thus, the influence of pH in the properties of the dyes must be carefully examined before their use. pH dependence of the absorbance and fluorescence intensity of C392STP was investigated in the interval 2-9.2 (Figure 4). This fluorophore showed to be pH-insensitive within the broad range of pH studied (its absorption and emission spectra remain constant over the range studied, Figure 4). This indicates that C392STP, mixture of isomers E and Z, is a suitable fluorescence imaging reagent under the physiological conditions. Furthermore, this characteristic also points out the suitability of C392STP for biolabeling as most of the labelling reactions are carried out in the pH range 7-9.
Figure 4. Absorption and emission intensities recorded at 400 nm and 500 nm, respectively, versus the pH of the
solution
Photostability. It is well-known that the suitability of some fluorophores as fluorescent dyes in different fields and
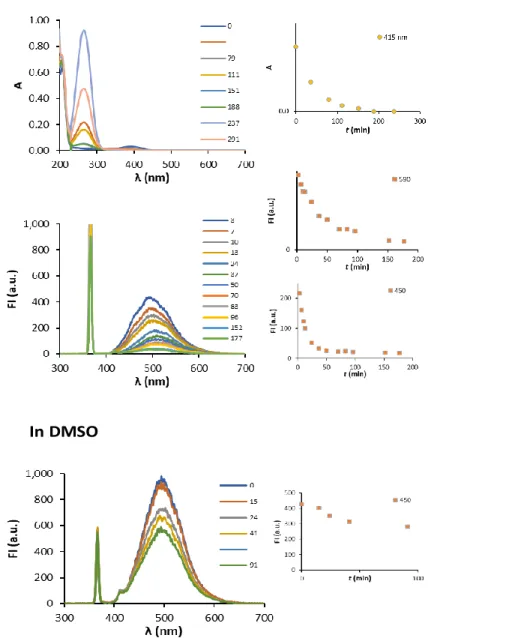
techniques is strongly dependent on their photostability. Thus, the photostability of C392STP was investigated. It was done by monitoring the absorption and emission spectra of an aqueous solution of the dye directly irradiated with a mercury lamp (365 nm). Aliquots of the solution were analyzed at different time intervals. Figure 5 shows the changes in the absorption and fluorescence intensity observed as a function of irradiating time with 365 nm light (power: 50 W). The exposure to UV light produced a decay of optical density and of the fluorescence intensity 300-450 nm and at 450-600 nm, respectively.
The variations in the spectra observed along time revealed that: i) both isomers undergo photobleaching under UV illumination and; ii) the maximum of emission of both isomers are different and allow their separated detection. None detectable shift of the wavelength of maximum absorption was observed over time. After 35 min of continuous irradiation the absorbance is reduced to 42% and completely disappeared after 3 h (188 min). However, a batochromic shift on the maximum of emission, indicated that E- and Z-C392STP isomers undergo photobleaching at different rates. The profiles of the decay of fluorescence intensity along time also support this finding (Figure 5). The isomer that emits at higher wavelengths is more unstable than that emitting at lower wavelengths. After 35 min the
fluorescence intensity decayed to 7.9% at 450 nm and nm to 38% at 590. The isomers were completely photobleached after 1 and 3 h, respectively.
This is interesting from the point of view of the detection, because for techniques that required short illumination times, detection at shorter wavelengths around 450 nm is preferred (the fluorescence intensities are initially four-times higher than at 590 nm). However, for analysis that required longer periods of exposure to UV light, detection of the fluorescence intensity at longer wavelengths is recommended.
The behavior observed in DMSO was completely different. In DMSO the wavelength of maximum emission of both isomers are similar. Whereas one of the isomers suffered photobleaching, the other remain stable after 40 min (Figure 5). This could be interesting for applications that do not required aqueous media.
Figure 5. Investigation of the photostability of C392STP by continuous illumination with an UV lamp (365 nm) in water
and in DMSO
Experimental
Materials and methods. The solvents used were of spectroscopic grade (Sigma and Merck). Phosphate Buffer Saline
solution (PBS) 22 mM was prepared in milliQ water (Na2HPO4 1.18 mM, KH2PO4 0.22 mM, NaCl 20.20 mM, KCl 0.40 mM, pH 7.2). The standard quantum yields selected, quinine sulfate and 9,10-diphenylanthracene were purchased
In water
from Sigma. The range of solvents was limited by the low solubility of the polar coumarin in low and non-polar liquids. The physical properties and polarity parameters of all solvents used in the
study were listed in Table 1: relative permittivity, εr, refractive index, η, the ENT 34 and corresponding Kamlet–Taft42 and Catalan43 solvent parameters. They were ordered according to their decreasing permittivity among two different sets: protic and aprotic.
Equipment. Absorption and emission spectra were recorded using a Hitachi model U-3010 spectrophotometer and a
Hitachi F-2000 spectrofluorometer, respectively. For recording the emission spectra all the samples were excited at 366 nm. All spectra were recorded using 1 cm pathlength synthetic quartz cuvettes at room temperature keeping the dye concentration very low for avoiding self-absorption. A pH/mV/°C meter, handheld, pH 1000 H, pHenomenal® was used for pH measurements.
Determination of the Molar Absorption Coefficient (ε), Quantum Yield (Φ) and brightness (ε x Φ). The molar absorption
coefficients were determined from eight separately weighted solutions with concentrations in the range 0.5-5 μM. The concentrations were chosen in such a way that the absorbances of the sample solutions did not exceed 0.2 (a.u.). The relative quantum yield of the coumarin in PBS, ΦC, was determined using the relative method of Williams et al. 44 and was calculated through the following equations:
C C R R 2 FI A C C R 2 FI A R (4) 2 C C C R 2 R R m m (5)
where Δ is the integrated area under the corrected fluorescence spectrum, is the optical density at the excitation wavelength (λex = 366 nm), m is the slope of the linear regression ΔFI /ΔA, η is the refractive index of the solution. The subscripts C and R refer to the coumarin and reference solutions, respectively. Quinine sulfate in 0.5 M H2SO4 (ΦR = 0.546) and 9,10-diphenylanthracene in ciclohexane (ΦR = 0.955) were used as quantum yield reference standards. For calculating the relative quantum yield, the emission spectra of eight separately weighted solutions with absorbances of less than 0.1 at the first absorption maximum were recorded.
The main text of the article should appear here with headings as appropriate.
Computational details. Density functional theory and time dependent density functional calculations were performed
with the Gaussian 16 software package.45 Geometry optimizations were performed with the B3LYP functional 46,47 in the different solvents. The standard 6-31+G(d) basis sets was employed as it represents a good compromise between accuracy and computational efficiency. Frequency calculations on the optimized geometries presented no imaginary frequencies. For the TD-DFT calculations the hybrid PBE0 functional48 together with the much larger 6-311+g(2d,p) basis set were employed. Solvent effects were modelled by means of the implicit polarized continuum (PCM) model.49,50
Previous studies show that this scheme (B3LYP for geometry optimization, followed by TD-DFT with the PBE0 functional and PCM model to take the solvent into account) gives reliable results for many organic dyes51–55 including coumarins.56–58 Investigation of the solvent effects and calculation of the excited state dipole moment. Various equations were used for
investigating the solvent effects on the photophysical properties of C392STP. Three based on quantum mechanical calculations: Lippert-Mataga, Bakhsiev equation and Kawski-Chamma-Viallet
Also, a relationship based on the empirical polarity scale of Reichardt, ENT, was used and three Linear Solvation Energy Relationships (LSER) were used for evaluating the influence of the solvent dipolarity/polarizability and hydrogen bonding on the absorption spectra: Kamlet– Taft (Eq.1), Catalan 3P (Eq.2) and Catalan 4P (Eq.3)
Conclusions
In this work interesting physicochemical characteristics of Coumarin392STP ester were discovered. Also, the behavior of this dye in different solvents, particularly in aqueous solutions, was investigated in deep. The properties observed, similar to those of commercial dyes or even better (i.e. the high stokes shift) point out to the possibility of C392STP, a novel low-cost dye with capacity to react with primary amine groups, to become a fluorescent dye with a wide range of applications in bioimaging and biolabeling. Some of the advantages of this fluorescent dye are facile preparation with high yield, large Stokes shift, pH-independence of absorbance and emission and excellent photo-stability, which benefits the biological fluorescence imaging.
Conflicts of interest
Acknowledgements
This work was co-financed by FCT – Fundação para a Ciência e a Tecnologia through the project "MICROTECH-ART- Microorganisms Thriving on and Endamaging Cultural Heritage -an Analytical Rapid Tool-" (PTDC/BBB-IMG/0046/2014) and by European Union, European Regional Development Fund ALENTEJO 2020 through the project “MEDUSA-Microrganisms Monitoring and Mitigation–Developing and Unlocking novel Sustainable Approaches-“(ALT20-03-0145-FEDER-000015). Marina González-Pérez and Sérgio Martins acknowledge FCT for the economic support through the post-doctoral and doctoral grants SFRH/BPD/100754/2014 and SFRH/BD/128807/2017, respectively. The authors also acknowledge Professor H. Heinz and referees of the manuscript for their valuable comments and suggestions.
References
1 A. E. Lanterna, M. González-Béjar, M. Frenette and J. C. Scaiano, Photochem. Photobiol. Sci., 2017, 16, 1284–1289. 2 X. Liu, J. M. Cole and K. S. Low, J. Phys. Chem. C, 2013, 117, 14731–14741.
3 H. Li, L. Cai and Z. Chen, Adv. Chem. Sensors, 2012, 121–150.
4 A. Gandioso, R. Bresolí-Obach, A. Nin-Hill, M. Bosch, M. Palau, A. Galindo, S. Contreras, A. Rovira, C. Rovira, S. Nonell and V. Marchán, J. Org. Chem., 2018, 83, 1185–1195.
5 G. Wenska, M. Insińska and B. Skalski, Pol. J. Chem., 2000, 74, 659–671.
6 H. Schill, S. Nizamov, F. Bottanelli, J. Bierwagen, V. N. Belov and S. W. Hell, Chem. - A Eur. J., 2013, 19, 16556–16565. 7 J. Chen, W. Liu, B. Zhou, G. Niu, H. Zhang, J. Wu, Y. Wang, W. Ju and P. Wang, J. Org. Chem., 2013, 78, 6121–6130. 8 R. P. Bhusal, P. Yun Cho, S. A. Kim, H. Park and H. S. Kim, Bull. Korean Chem. Soc., 2011, 32, 1461–1462.
9 B. Wetzl, M. Gruber, B. Oswald, A. Dürkop, B. Weidgans, M. Probst and O. S. Wolfbeis, J. Chromatogr. B, 2003, 793, 83–92.
10 I. Bora, S. A. Bogh, M. Santella, M. Rosenberg, T. J. Sørensen and B. W. Laursen, European J. Org. Chem., 2015, 2015, 6351–6358.
11 Z. Gao, Y. Hao, M. Zheng and Y. Chen, RSC Adv., 2017, 7, 7604–7609.
12 M. V. Sednev, V. N. Belov and S. W. Hell, Methods Appl. Fluoresc., 2015, 3, 042004.
13 J. R. Mannekutla, B. G. Mulimani and S. R. Inamdar, Spectrochim. Acta Part A Mol. Biomol. Spectrosc., 2008, 69, 419– 426.
14 P. D. McFadden, K. Frederick, L. A. Argüello, Y. Zhang, P. Vandiver, N. Odegaard and D. A. Loy, ACS Appl. Mater.
Interfaces, 2017, 9, 10061–10068.
15 M. A. Haidekker and E. A. Theodorakis, Org. Biomol. Chem., 2007, 5, 1669–1678. 16 X. Liu, Z. Xu and J. M. Cole, J. Phys. Chem. C, 2013, 117, 16584–16595.
17 D. Kovacs, X. Lu, L. S. Mészáros, M. Ott, J. Andres and K. E. Borbas, J. Am. Chem. Soc., 2017, 139, 5756–5767. 18 A. Tan, E. Bozkurt and Y. Kara, J. Fluoresc., 2017, 27, 981–992.
19 A. Vyšniauskas, I. López-Duarte, N. Duchemin, T.-T. Vu, Y. Wu, E. M. Budynina, Y. A. Volkova, E. Peña Cabrera, D. E. Ramírez-Ornelas and M. K. Kuimova, Phys. Chem. Chem. Phys., 2017, 19, 25252–25259.
20 Ł. Kielesiński, O. Morawski, Ł. Dobrzycki, A. L. Sobolewski and D. T. Gryko, Chem. - A Eur. J., 2017, 23, 9174–9184. 21 G. Signore, R. Nifosì, L. Albertazzi and R. Bizzarri, J. Biomed. Nanotechnol., 2009, 5, 722–729.
22 M. González Pérez, M. Sérgio, A. Manhita, A. T. Caldeira and A. Pereira, Unpubl. manuscript.
23 D. Nagaraja, H. S. Geethanjali, N. R. Patil, F. M. Sanningannavar, R. A. Kusanur and R. M. Melavanki, Mapana J Sci, 2013, 12, 49–68.
24 J. J. Aaron, M. Buna, C. Parkanyi, M. S. Antonious, A. Tine and L. Cisse, J. Fluoresc., 1995, 5, 337–347. 25 A. Alimmari, B. Bozic, D. Mijin, A. Marinkovic, N. Valentic and G. Uscumlic, Arab. J. Chem., 2015, 8, 269–278. 26 R. S. Moog, W. W. Davis, S. G. Ostrowski and G. L. Wilson, Chem. Phys. Lett., 1999, 299, 265–271.
27 R. S. Moog, D. D. Kim, J. J. Oberle and S. G. Ostrowski, J. Phys. Chem. A, 2004, 108, 9294–9301. 28 U. S. Raikar, V. B. Tangod, C. G. Renuka and B. M. Mastiholi, 2010, 4, 51–57.
29 T. Molotsky and D. Huppert, J. Phys. Chem. A, 2003, 107, 2769–2780.
30 U. S. Raikar, C. G. Renuka, Y. F. Nadaf, B. G. Mulimani, A. M. Karguppikar and M. K. Soudagar, Spectrochim. Acta - Part
A Mol. Biomol. Spectrosc., 2006, 65, 673–677.
31 F. Riedel, A. Oehlke and S. Spange, Zeitschrift fur Anorg. und Allg. Chemie, 2009, 635, 1335–1340. 32 M. A. Haidekker, T. P. Brady, D. Lichlyter and E. A. Theodorakis, Bioorg. Chem., 2005, 33, 415–425. 33 P. Hrdlovic, J. Donovalova, H. Stankovicova and A. Gaplovsky, Molecules, 2010, 15, 8915–8932.
34 C. Reichardt, Solvents and solvent effects in organic chemistry, WILEY-VCH Verlag GmbH & Co. KGaA, Weinheim Printed, Third., 2003.
36 C. Reichardt, Chem. Rev., 1994, 94, 2319–2358.
37 S. Yordanova, I. Petkov and S. Stoyanov, J. Chem. Technol. Metall., 2014, 49, 601–609.
38 L. Giordano, V. V. Shvadchak, J. A. Fauerbach, E. A. Jares-Erijman and T. M. Jovin, J. Phys. Chem. Lett., 2012, 3, 1011– 1016.
39 M. Tanioka, S. Kamino, A. Muranaka, Y. Shirasaki, Y. Ooyama, M. Ueda, M. Uchiyama, S. Enomoto and D. Sawada,
Phys. Chem. Chem. Phys., 2017, 19, 1209–1216.
40 Z. Liu, Y. Wang, X. Pan, Q. Ge, Q. Ma, Q. Li, T. Fu, C. Hu, X. Zhu and J. Pan, Front. Microbiol., 2017, 8, 1–9.
41 N. Panchuk-voloshina, R. P. Haugland, J. Bishop-stewart, M. K. Bhalgat, P. J. Millard, F. Mao, W. Leung, R. P. Haugland, N. P. Voloshina and J. B. Stewart, J. Histochem. Cytochem., 1999, 47, 1179–1188.
42 M. J. Kamlet, J. L. M. Abboud, M. H. Abraham and R. W. Taft, J. Org. Chem., 1983, 48, 2877–2887. 43 J. Catalán, J. Phys. Chem. B, 2009, 113, 5951–5960.
44 A. T. R. Williams, S. A. Winfield and J. N. Miller, Analyst, 1983, 108, 1067–1071.
45 Gaussian 16 Revision B.01., M. J. Frisch, G. W. Trucks, H. B. Schlegel, G. E. Scuseria, M. A. Robb, J. R. Cheeseman, G. Scalmani, V. Barone, G. A. Petersson, H. Nakatsuji, X. Li, M. Caricato, A. V. Marenich, J. Bloino, B. G. Janesko, R. Gomperts, B. Mennucci, J. V. Hratchian, A. F. Ortiz, J. L. Izmaylov, D. Sonnenberg, F. Williams-Young, F. Ding, F. Lipparini, J. Egidi, B. Goings, A. Peng, T. Petrone, Henderson, D. Ranasinghe, V. G. Zakrzewski, J. Gao, N. Rega, G. W. Zheng, M. Liang, M. Hada, K. J. Ehara, T. D., R. Fukuda, J. Hasegawa, M. Ishida, T. Nakajima, Y. Honda, O. Kitao, H. Nakai, T. Vreven, K. Throssell, J. Montgomery, J. A., J. E. Peralta, F. Ogliaro, M. J. Bearpark, J. J. Heyd, E. N. Brothers, K. N. Kudin, V. N. Staroverov, T. A. Keith, R. Kobayashi, J. Normand, K. Raghavachari, A. P. Rendell, J. C. Burant, S. S. Iyengar, J. Tomasi, M. Cossi, J. M. Millam, M. Klene, C. Adamo, R. Cammi, J. W. Ochterski, R. L. Martin, K. Morokuma, O. Farkas, J. B. Foresman and D. J. Fox, Gaussian, Inc., Wallingford CT, 2016.
46 A. D. Becke, J. Chem. Phys., 1993, 98, 5648–5652.
47 C. Lee, W. Yang and R. G. Parr, Phys. Rev. B, 1988, 37, 785–789. 48 C. Adamo and V. Barone, J. Chem. Phys., 1999, 110, 6158–6170.
49 C. Amovilli, V. Barone, R. Cammi, E. Cancès, M. Cossi, B. Mennucci, C. S. Pomelli and J. Tomasi, ed. P.-O. B. T.-A. in Q. C. Löwdin, Academic Press, 1998, vol. 32, pp. 227–261.
50 M. Cossi, N. Rega, G. Scalmani and V. Barone, J. Chem. Phys., 2001, 114, 5691–5701.
51 P.-F. Loos, J. Preat, A. D. Laurent, C. Michaux, D. Jacquemin, E. A. Perpète and X. Assfeld, J. Chem. Theory Comput., 2008, 4, 637–645.
52 J. Preat, D. Jacquemin, V. Wathelet, J.-M. André and E. A. Perpète, Chem. Phys., 2007, 335, 177–186.
53 L. Briquet, D. P. Vercauteren, J.-M. André, E. A. Perpète and D. Jacquemin, Chem. Phys. Lett., 2007, 435, 257–262. 54 D. Jacquemin, E. A. Perpète, I. Ciofini and C. Adamo, Acc. Chem. Res., 2009, 42, 326–334.
55 M. Amaro, H. A. L. Filipe, J. P. Prates Ramalho, M. Hof and L. M. S. Loura, Phys. Chem. Chem. Phys., 2016, 18, 7042– 7054.
56 J. Preat, P.-F. Loos, X. Assfeld, D. Jacquemin and E. A. Perpète, J. Mol. Struct. THEOCHEM, 2007, 808, 85–91. 57 J. Preat, D. Jacquemin, V. Wathelet, J.-M. André and E. A. Perpète, J. Phys. Chem. A, 2006, 110, 8144–8150. 58 M. O. B. Sousa, M. D. Vargas and F. S. Miranda, J. Mol. Struct., 2018, 1164, 260–270.