Andreia Filipa Cabral de Melo
Forensic Genetics
Biology 2012
Supervisor
Cíntia Alves, Head of the Genetic Identification and Parentage Testing Unit,
Institute of Molecular Pathology and Immunology of the University of Porto
Co-supervisor
António Amorim, Senior Professor, Faculty of Sciences, University of Porto
European Standard
Set of forensic
genetic markers in
routine casework:
population studies
and next generation
kit internal
O Presidente do Júri,
Dissertação de candidatura ao grau de Mestre em Genética Forense apresentada à Faculdade de Ciências da Universidade do Porto
O presente trabalho foi desenvolvido sob a orientação científica da Drª. Cíntia Alves e do Professor Doutor António Amorim e realizado no IPATIMUP
Thesis presented for the degree of Master in Forensic Genetics, at the Faculty of Sciences, University of Porto
The present work was developed under the scientific supervision of Dr. Cíntia Alves and Professor António Amorim at IPATIMUP
AGRADECIMENTOS
À Cíntia, que ao longo de todo este caminho me guiou, orientou, me deu bases e conhecimentos para que eu pudesse realizar o meu trabalho, que esteve sempre lá, a qualquer hora, em qualquer dia… um grande obrigada por toda a confiança, compreensão e dedicação neste período! Obrigada pelo apoio, pela palavra amiga e entusiasmo no momento certo.
Ao Professor Amorim, que não só me permitiu estar presente neste Mestrado, como também me proporcionou a possibilidade de poder dedicar-me à área forense, no decorrer deste projeto. Um muito obrigada pela disponibilidade e pela opinião e palavra certa que me permitiu muitas vezes reajustar o meu pensamento crítico em relação a alguns assuntos.
Ao IPATIMUP, onde realizei todo o meu trabalho e onde me foi permitido conhecer e experimentar técnicas, procedimentos e análises forenses sem as quais o meu trabalho não faria qualquer sentido.
Agradeço ao grupo de Genética Populacional, nomeadamente às minhas “amigas de Mestrado” sem as quais este percurso não teria tido a mesma beleza. À Sofia, à Marisa, à Catarina X., à Ana, à Lídia e às duas meninas de Aveiro, Inês e Catarina S. um muito obrigada com muita amizade, pois tornaram este caminho inesquecível.
Aos meus pais, em especial à minha querida mãe, minha melhor amiga, que sempre me apoiou em qualquer passo ou caminho do meu percurso, sem nunca duvidar do meu talento. Espero orgulhar-te para sempre. À minha pequenina, minha maninha, obrigada pelo teu sorriso quando o dia não tinha corrido pelo melhor. Obrigada à minha linda família que mesmo longe me apoia e acarinha.
À Rosa e ao Joaquim, que fazem parte da minha família e que sempre me acarinharam.
Por fim, ao meu amigo, companheiro de sempre e para sempre, à minha metade, agradeço-te toda a compreensão, carinho e apoio incondicional. Sem ti não poderia ter chegado até aqui, pois seja qual for o desafio, iremos sempre ultrapassá-lo…juntos!
SUMMARY
National DNA profile databases are becoming the most powerful tool in forensic investigation and genetic identification. Overtime, European countries have been debating on standardization concerning the number and type of STR markers to be included, so that information exchange can be achieved in a more fruitful manner. The ESS (European Standard Set) core of loci was created consisting of five STR markers and this new set also accomplished the necessity to implement new markers which would be amplified in smaller amplicons, in order to solve increasingly common casework involving degraded DNA samples. This European request coincided with IPATIMUP’s laboratory of genetic identification and kinship analysis necessity for more genetic information in order to obtain sounder conclusions in deficient paternities or in more complex kinship cases. Until now, the markers used on a routine basis in IPATIMUP´s laboratory are analysed through two multiplex systems, Identifiler Plus (Applied Biosystems) and Powerplex 16 HS (Promega), which amplify a total of 17 STRs and share 13 loci between them. However, when more genetic information was required, the laboratory accessed to an “in-house” multiplex, composed of 4 loci (CD4, F13A01, FES and MBPB), in order to obtain further autosomal information. These markers not only lack high polymorphism content but are in disuse by the scientific community. Consequently, participation in proficiency testing with these markers will not yield consensus, and so external quality control will not be accomplished. Therefore, the need for a new set of STRs became demanding, which also would preferably be more informative than the aforementioned “in-house” loci.
The ESSplex Plus kit is a next generation kit developed by Qiagen Company that contains the five new loci specified in the recently expanded European Standard Set (ESS) together with the remaining markers usually used in routine casework. In this work an internal validation study of ESSplex Plus kit was performed with evaluation of critical parameters such as system sensitivity, precision, contamination and mixture analyses, and degradation studies. A population genetic study was initially performed in order to first validate this new set of markers in the Portuguese population. Each new marker (D1S1656, D2S441, D10S1248, D12S391 and D22S1045) was characterized in terms of allele frequency estimation, Hardy-Weinberg equilibrium test and parameters of forensic interest; as well as a segregation analysis. Moreover, another next generation system, NGM kit (Applied Biosystems), was also used for a
concordance study (ESSplex Plus and NGM share the same loci) and for performance comparison purposes.
This internal validation study is crucial for understanding the performance, limitations and potentials of this system in the Portuguese population, applied in a particular laboratory with specific routine casework and procedures. In our investigation, 370 individuals were sampled, comprising 120 true trios (125 fathers, 125 mothers and 120 sons/daughters) for population and segregation studies. Moreover, for the kit performance studies, nine technical and administrative personnel from IPATIMUP Diagnostics were also sampled for different biological material in distinct sampling devices. The methodology adopted and used was adapted from the available literature on internal validation cases and also from SWGDAM guidelines.
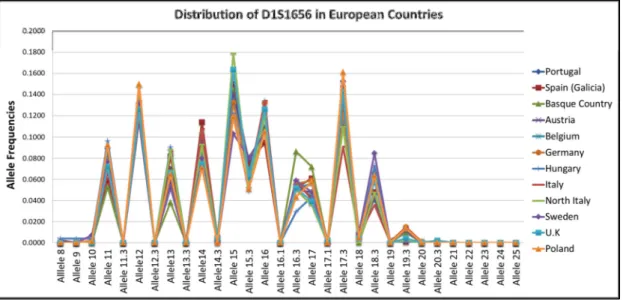
No deviations from Hardy-Weinberg equilibrium were detected for the five new loci in the Portuguese population. Comparison of our sample with other available European samples generally revealed no significant allele frequency differences.
No genotyping inconsistencies were observed between ESSplex Plus and NGM kits in the concordance study, as well as between all four multiplex systems concerning the shared markers.
Comparing with the other systems evaluated (NGM, Identifiler Plus and Powerplex 16 HS), ESSplex Plus kit revealed higher sensitivity and a better detection of degraded DNA information.
Our results confirm the multiplex robustness regarding PCR chemistry and the improved performance requested by the European forensic community for typing degraded samples so as to ensure data quality and sensitivity. The five new ESS markers are suitable for application in our laboratory’s routine casework as well as the ESSplex Plus kit as an option to be introduced in future routine casework.
Key-words:
ESSplex Plus, Internal Validation, European Standard Set, STRs, Next generation kit, Population studies, Forensic genetics.
RESUMO
As bases de dados nacionais de perfis genéticos estão a tornar-se uma poderosa ferramenta, ao nível da investigação forense e de identificação genética. Os países Europeus têm debatido a uniformização no que respeita ao número e tipo de marcadores STR a serem adotados, para que a informação partilhada entre eles possa ser obtida mais facilmente. Foi criado o ESS (European Standard Set), constituído por cinco marcadores STR. Este novo conjunto trouxe também a possibilidade de implementar novos marcadores com amplicões de menor tamanho, de forma a resolver casos que envolvam amostras de DNA degradadas, cada vez mais comuns na rotina laboratorial. Esta solicitação Europeia coincidiu com a necessidade de mais informação genética por parte do laboratório de identificação genética e análise de parentescos do IPATIMUP, para que conclusões mais sólidas fossem obtidas em casos de investigação de paternidade deficientes ou em parentescos mais complexos. Até agora, os marcadores utilizados na rotina do laboratório do IPATIMUP eram analisados através de dois sistemas em multiplex, Identifiler Plus (Applied Biosystems) e Powerplex 16 HS (Promega), que amplificam um total de 17 STRs e partilham entre si 13 loci. No entanto, quando era necessária mais informação genética, o laboratório acedia a um multiplex “in-house”, composto por 4 loci (CD4, F13A01, FES e MBPB), de forma a obter mais informação de cariz autossómico. Estes marcadores não só carecem de um elevado conteúdo polimórfico mas estão também em desuso pela comunidade científica. Consequentemente, a participação em testes de proficiência com estes mesmos STRs não iria gerar consenso, sendo que deste modo o controlo externo da qualidade não seria conseguido. Deste modo, a necessidade de um novo conjunto de STRs tornou-se essencial, sendo que este seria ainda mais informativo do que os mencionados loci “in-house”.
O ESSplex Plus é um kit de nova geração desenvolvido pela companhia Qiagen, que contém os cinco novos loci especificados no recentemente expandido European
Standard Set (ESS), juntamente com os restantes marcadores usualmente utilizados
na casuística de rotina. Neste trabalho, foi realizado um estudo de validação interna do kit ESSplex Plus, com a avaliação de parâmetros críticos como a análise da sensibilidade, precisão, contaminação e mistura, bem como estudo de degradação. Foi inicialmente realizado um estudo de genética populacional de forma a validar
primeiramente este novo set de marcadores na população Portuguesa. Cada um dos novos marcadores (D1S1656, D2S441, D10S1248, D12S391 e D22S1045) foi caraterizado no que diz respeito à estimativa de frequências alélicas, equilíbrio de Hardy-Weinberg, parâmetros de interesse forense, bem como análise de segregação. Além disso, foi utilizado outro sistema de nova geração, o kit NGM (Applied Biosystems), para o estudo de concordância (ESSplex Plus e NGM partilham os mesmos loci) e para comparação de performances.
Este estudo de validação interna é crucial para o entendimento da performance, limitações e potencial deste kit na população Portuguesa, aplicado a um laboratório particular com uma casuística de rotina e procedimentos específicos. Na nossa investigação, 370 indivíduos foram amostrados, compreendendo 120 trios verdadeiros (125 pais, 125 mães e 120 filhos/filhas) para estudos populacionais e de segregação. Além disso, para o estudo da avaliação de performance do kit, nove indivíduos, pertencentes ao pessoal técnico e administrativo do departamento de Diagnóstico do IPATIMUP, foram também amostrados, testando-se diferentes materiais biológicos em distintos suportes de amostragem. A metodologia adotada e utilizada foi adaptada da literatura disponível acerca de casos de validação interna, bem como das diretrizes de SWGDAM (Scientific Working Group for DNA Analysis Methods).
Não foram detetados quaisquer desvios ao equilíbrio de Hardy-Weinberg para os cinco novos loci, na população Portuguesa. Na comparação da nossa amostra populacional com outras amostras Europeias disponíveis, não foram detetadas diferenças significativas ao nível das frequências alélicas.
Nenhuma inconsistência genotípica foi observada entre os kits ESSplex Plus e NGM no estudo de concordância, tal como entre os quatro sistemas multiplex analisados no que diz respeito aos marcadores partilhados.
Comparativamente aos outros sistemas avaliados (NGM, Identifiler Plus e Powerplex 16 HS) o kit ESSplex Plus revelou uma maior sensibilidade bem como uma melhor capacidade de deteção de material genético degradado.
Os nossos resultados confirmam a robustez do multiplex no que respeita à química da reação de PCR, bem como um melhor desempenho, requerido pela comunidade forense Europeia para a tipagem de amostras degradadas de modo a assegurar a qualidade e sensibilidade dos dados. Os cinco novos marcadores ESS estão
adequados para aplicação na nossa casuística de rotina, tal como o kit ESSplex Plus como uma opção a ser introduzida na rotina laboratorial.
Palavras-chave:
ESSplex Plus, Validação Interna, European Standard Set, STRs, Kit de Nova Geração, Estudos populacionais, Genética Forense.
CONTENTS
AGRADECIMENTOS ... i SUMMARY ... ii RESUMO ...iv LIST OF TABLES ... ix LIST OF FIGURES ... xi ABBREVIATIONS ... xvii 1. INTRODUCTION ... 11.1. Short Tandem Repeat Markers and Commercial Multiplex Kits ... 1
1.1.1. Short Tandem Repeat Markers ... 1
1.1.2. Commercial Multiplex Kits ... 8
1.2. The new Standard Set of European Genetic Markers (ESS) in the forensic field and the Next Generation Kits ... 11
1.2.1. The new Standard Set of European Genetic Markers (ESS) ... 11
1.2.2. The Next Generation Kits ... 13
1.3. The Internal Validation Process: history, validation guidelines and studies ... 16
1.3.1. Ensuring Quality: Guidelines and Accreditation ... 16
1.3.2. Validation ... 18
1.3.2.1. Developmental Validation Studies ... 20
1.3.2.2. Internal Validation Studies ... 22
2. BACKGROUND AND SPECIFIC AIMS ... 26
3. MATERIAL & METHODS ... 28
3.1. Sampling strategy ... 28
3.2. Technical procedures ... 29
3.2.1. DNA extraction ... 29
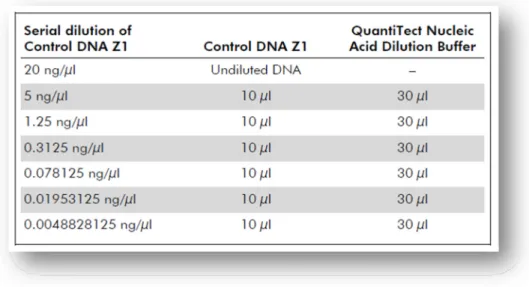
3.2.2. DNA quantification ... 30
3.2.3. DNA amplification ... 32
3.2.4. Fragment detection and analysis ... 39
3.3. Validation studies ... 41
3.3.1. Population Study ... 41
3.3.2. Concordance Study ... 41
3.3.3. Sensitivity Study, Stochastic Effects and Artifacts ... 43
3.3.3.2. PHR evaluation ... 44 3.3.3.3. Stutter evaluation ... 44 3.3.4. Mixture study ... 45 3.3.5. Precision study ... 47 3.3.6. Degradation study ... 47 3.3.7. Contamination study ... 49
4. RESULTS AND DISCUSSION ... 50
4.1. Population Study ... 50
4.2. Concordance Study ... 58
4.3. Contamination Study ... 59
4.4. Sensitivity Study, Stochastic Effects and Artefacts ... 62
4.4.1. Sensitivity ... 65
4.4.2. PHR evaluation ... 67
4.4.3. Stutter evaluation... 69
4.4.4. Sensitivity comparison between multiplex kits ... 78
4.5. Mixture Study ... 85
4.6. Precision Study ... 90
4.7. Degradation Study ... 97
5. CONCLUSIONS ... 102
LIST OF TABLES
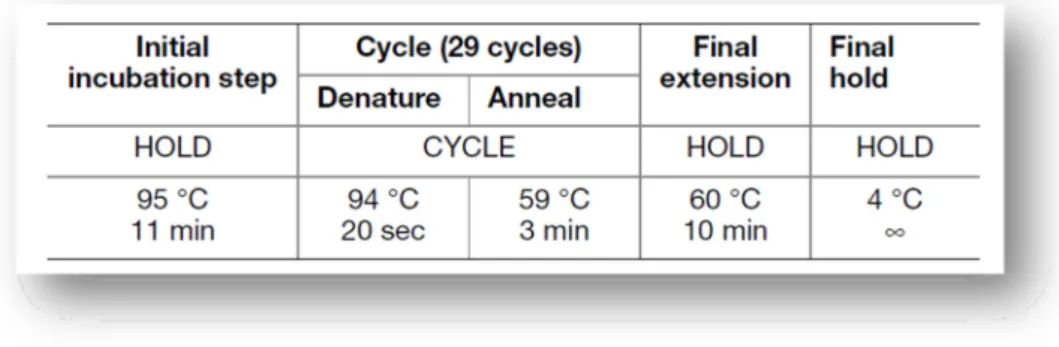
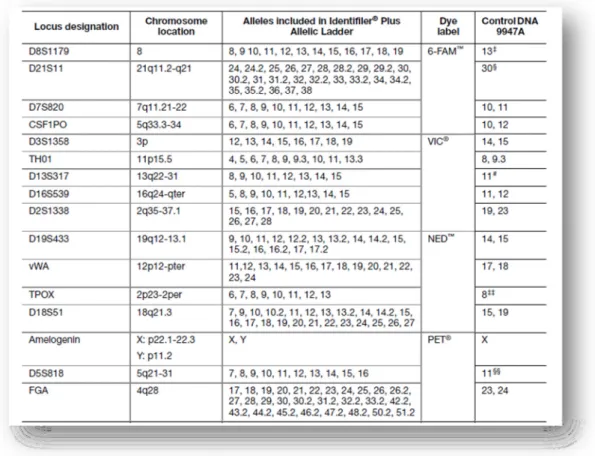
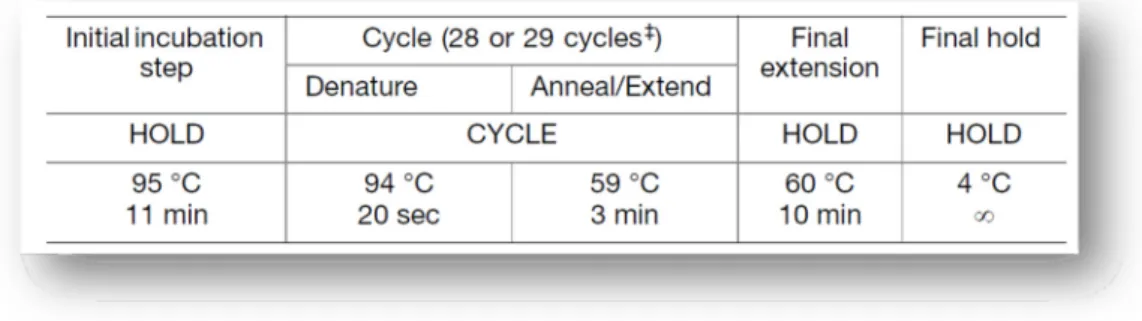
Table 1 - Composition of the first European Standard Set of Forensic Genetic Markers (ESS): D3S1358, VWA, D8S1179, D21S11, D18S51, TH01 and FGA. ... 11 Table 2 - Composition of the current European Standard Set of Forensic Genetic Markers (ESS): left column represent the first European Genetic Markers (2001) and in the right column is the new set of forensic genetic markers: D1S1656, D2S441, D10S1248, D12S391 and the D22S1045. ... 12 Table 3 - Locus – specific information of the new set of forensic genetic markers: D2S441, D10S1248, D22S1045, D1S1656 and D12S391 (Butler and Hill, 2012, Lareu et al., 1998, Lareu et al., 1996)... 13 Table 4 - Serial dilutions of the Control DNA Z1 for quantitation purposes (Qiagen, 2011a). ... 30 Table 5 - Graphic representation of a possible plate setup for Real Time-PCR reaction using Quantiplex Kit (Qiagen, 2010, Qiagen, 2011a). ... 31 Table 6 - Specific information about each locus of Investigator ESSplex Plus Kit (Qiagen, 2010). ... 33 Table 7 - Components and respective volumes of the PCR reaction (Qiagen, 2010). ... 34 Table 8 - Standard cycling program recommended for ESSplex Plus Kit (Qiagen, 2010)... 34 Table 9 - Components and respective volumes of the PCR reaction (final volume of 25µl) (Applied Biosystems, 2011). ... 35 Table 10 - Standard conditions of thermal cycling program, for NGM Kit (Applied Biosystems, 2011). ... 35 Table 11 - AmpFlSTR® Identifiler® Plus Kit loci, alleles, chromosome location and 9947A positive control (Applied Biosystems, 2012). ... 36 Table 12 - Components and respective volumes of the PCR reaction (final volume of 25µl) (Applied Biosystems, 2012). ... 37 Table 13 - Standard conditions of thermal cycling program for Identifiler® Plus Kit; 28 cycles was used for all the tests performed (Applied Biosystems, 2012). ... 37 Table 14 - The PowerPlex® 16 HS System Locus-Specific Information (Promega Corporation, 2009 - 2012). ... 38
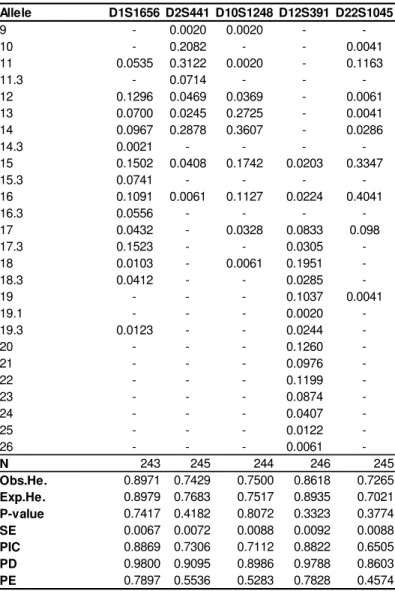
Table 15 - PCR Amplification Mix for the PowerPlex® 16 HS System (Promega Corporation, 2009 - 2012). ... 38 Table 16 - Structure of the four multiplexes tested regarding size standard, electrophoresis conditions, amount of input DNA and allelic ladder. The * symbol means an adaptation in injection time from 5 seconds to 10. ... 40 Table 17 - Run Module 3kV_10s_500bp for ABI 3130/3130xl and our respective internal parameters (Qiagen, 2010). ... 40 Table 18 - Loci sharing between the multiplex kits analysed... 42 Table 19 - Example of the procedure designed to obtain a serial dilution of a DNA sample. The letter A represents the original samples and are indicated their respective values of initial concentration, which were used in this study. ... 43 Table 20 - Total allelic range for each genetic marker of ESSplex Plus Kit. In red are represented the alleles that were present in our selected samples, in the Portuguese population. ... 45 Table 21 - Mixture test 1 design: constant male sample mixed with increased female sample quantities. ... 45 Table 22 - Mixture test 2 design: constant female sample mixed with increased male sample quantities. ... 45 Table 23 - Reference profiles for Mixture study: Z codes are related with the internal code that is used in our laboratory. ... 46 Table 24 - Allele frequencies and forensic parameters of interest for the five STRs D1S1656, D2S441, D10S1248, D12S391 and D22S1045, in our Portuguese sample. ... 51 Table 25 – Reference stutter values estimated for the ESSplex Plus loci, using the formula x + 3SD. ... 77 Table 26 - Mixture study results concerning two different analysis: female DNA constant with an increase of male DNA and male DNA constant with an increase of female DNA. Y (Yes) means a positive detection of mixture and N (No) an absence of mixture event. The red letters represent specific and isolated events. ... 89 Table 27 - Mixture ratios obtained using the five available heterozygous loci. The average of these mixture ratios is also represented as well as the peak height ratio concerning Amelogenin locus. ... 90
LIST OF FIGURES
Figure 1 - Structure of a short tandem repeat marker. The core repeat varies between 1 and 6 bp (mononucleotide to hexanucleotide) being represented a simple tetranucleotide repeat. The alleles are named according to the number of repeats that they contain (Bär W. et al., 1997). ... 2 Figure 2 - Structure of different types of short tandem repeat markers. In the simple repeat with a non -consensus allele (microvariant), in the example, the 9.3 allele is missing an A from the seventh repeat. The compound repeat is composed by several elements. Finally the complex repeat sequence is also represented with non-consensus alleles that differ in both size and sequence (Butler, 2005). ... 2 Figure 3 - The picture above shows the slippage process between the template and the nascent DNA strands. The copied strand represents the most common case and contains one repeat less than the template strand (n-1). The stutter peaks are indicated by the arrow and their size relative to the main peak is shown (based on peak area): (a) Dinucleotide repeat, which is prone to high levels of slippage. (b) Tetranucleotide repeat, which displays lower levels of stutter (Goodwin et al., 2011). ... 4 Figure 4 - Split peaks are seen in profiles when the non-template addition does not occur with all of the PCR products. The three examples show decreasing amounts of non-template addition with panel (a) showing an example where the vast majority of PCR product has the non-template addition through to panel (c), where only about 50% of the PCR product has the non-template addition (Goodwin et al., 2011). ... 5 Figure 5 - (a) The variation occurs within the repeat region and should have no impact on the primer binding and the subsequent PCR amplification. (b) The sequence variation occurs just outside the repeat in the flanking region but interior to the primer annealing sites. Again, PCR should not be affected although the size of the PCR product may vary slightly. (c) The PCR can fail due to a disruption in the annealing of a primer because the primer no longer perfectly matches the DNA template sequence (Butler, 2005). ... 6 Figure 6 - With 1ng of template DNA, the peaks are well balanced and easy to interpret. When the PCR does not have enough template to amplify (0.25 ng), then allelic drop-out can occur (Goodwin et al., 2011). ... 6 Figure 7 - Commercially available kits for the 13 CODIS core loci: Powerplex®16 and Identifiler (Butler, 2005). The genetic markers surrounded by black lines correspond to additional loci. . 10 Figure 8 - Graphic representation of the European Standard Set core of genetic markers plus additional markers which frequently also composed the Next Generation Kits, shaded in grey (Butler, 2010b). The new set of genetic markers is surrounded with red lines. ... 15
Figure 9 - Two different types of blood sample: a) stain sample (FTA card) and b) total blood
(liquid). ... 28
Figure 10 - Different models of swabs used in our study: a) Omni-Swab; b) Brush swab and c) Cotton swab. ... 28
Figure 11 - Standard conditions of thermal cycling program for PowerPlex® 16 HS System Kit (Promega Corporation, 2009 - 2012). ... 39
Figure 12 - Schematic representation of the concordance procedure. ... 42
Figure 13 - Formula used to obtain the PHR values for each loci of the ESSplex Plus Kit. ... 44
Figure 14 - Formula used for the calculation of the Stutter Ratio. ... 44
Figure 15 - Formula used in the calculation of Mixture Ratio. ... 47
Figure 16 - Graphic representation of the allele frequency distribution for the D1S1656 marker, in European samples. ... 52
Figure 17 - Statistical deviations detected for the D1S1656 genetic marker between European samples. ... 53
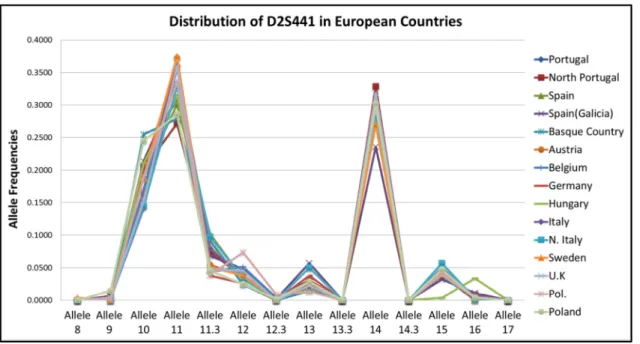
Figure 18 - Graphic representation of the allele frequency distribution for the D2S441 marker, in European samples. ... 53
Figure 19 - Statistical deviations detected for the D2S441 genetic marker between European samples. ... 54
Figure 20 - Graphic representation of the allele frequency distribution for the D10S1248 marker, in European samples. ... 55
Figure 21 - Statistical deviations detected for the D10S1248 genetic marker between European samples. ... 56
Figure 22 - Graphic representation of the allele frequency distribution for the D12S391 marker, in European samples. ... 56
Figure 23 - Graphic representation of the allele frequency distribution for the D22S1045 marker, in European samples. ... 57
Figure 24 - Statistical deviations detected for the D22S1045 genetic marker between European samples. ... 58
Figure 25 - Typical result of a blank control amplified with the ESSplex Plus system. ... 60
Figure 27 - Typical result of a blank control amplified with the Identifiler Plus system. ... 61 Figure 28 -Typical result of a blank control amplified with the Powerplex 16 HS system. ... 62 Figure 29 - Example of a graphic representation of the quantification results, concerning Standard Curve, Amplification Plot, Multicomponent plot and Raw Data Plot. ... 63 Figure 30 - Example of an electropherogram of a random sample analysed with ESSplex Plus kit. In this picture, the range of values experimented in the sensitivity test (from 0.5 ng/µl DNA to 0.005 ng/µl) is represented. Note that the y- axis scale was magnified for the smaller input amounts of DNA. ... 66 Figure 31 - Peak height ratio (PHR) resulting from (average – SD), in percentage, for each ESSplex Plus locus. ... 68 Figure 32 - Distribution of stutter values across the allelic range of the TH01 marker, in ESSplex Plus kit. Estimation of a reference stutter value. ... 69 Figure 33 - Distribution of stutter values across the allelic range of the D3S1358 marker, in ESSplex Plus kit. Estimation of a reference stutter value... 70 Figure 34 - Distribution of stutter values across the allelic range of the vWA marker, in ESSplex Plus kit. Estimation of a reference stutter value. ... 70 Figure 35 - Distribution of stutter values across the allelic range of the D21S11 marker, in ESSplex Plus kit. Estimation of a reference stutter value... 71 Figure 36 - Distribution of stutter values across the allelic range of the D16S539 marker, in ESSplex Plus kit. Estimation of a reference stutter value... 71 Figure 37 - Distribution of stutter values across the allelic range of the D1S1656 marker, in ESSplex Plus kit. Estimation of a reference stutter value... 72 Figure 38 - Distribution of stutter values across the allelic range of the D19S433 marker, in ESSplex Plus kit. Estimation of a reference stutter value... 72 Figure 39 - Distribution of stutter values across the allelic range of the D8S1179 marker, in ESSplex Plus kit. Estimation of a reference stutter value... 73 Figure 40 - Distribution of stutter values across the allelic range of the D2S1338 marker, in ESSplex Plus kit. Estimation of a reference stutter value... 73 Figure 41 - Distribution of stutter values across the allelic range of the D10S1248 marker, in ESSplex Plus kit. Estimation of a reference stutter value... 74 Figure 42 - Distribution of stutter values across the allelic range of the D22S1045 marker, in ESSplex Plus kit. Estimation of a reference stutter value... 74
Figure 43 - Distribution of stutter values across the allelic range of the D12S391 marker, in ESSplex Plus kit. Estimation of a reference stutter value... 75 Figure 44 - Distribution of stutter values across the allelic range of the FGA marker, in ESSplex Plus kit. Estimation of a reference stutter value. ... 75 Figure 45 - Distribution of stutter values across the allelic range of the D2S441 marker, in ESSplex Plus kit. Estimation of a reference stutter value... 76 Figure 46 - Distribution of stutter values across the allelic range of the D18S51 marker, in ESSplex Plus kit. Estimation of a reference stutter value... 76 Figure 47 - Comparison between developmental mean stutter ratios and internal mean stutter ratios obtained in this study, for each locus of the ESSplex Plus kit. ... 78 Figure 48 - Sensitivity results of the ESSplex Plus Kit, concerning visual approach. Parameters such as complete profile, drop-out and pull-up were evaluated... 79 Figure 49 - Sensitivity results of the ESSplex Plus Kit, concerning threshold approach. Parameters such as complete profile, drop-out and pull-up were evaluated. ... 80 Figure 50 - Sensitivity results of the NGM Kit, concerning visual approach. Parameters such as complete profile, drop-out and pull-up were evaluated. ... 81 Figure 51 - Sensitivity results of the NGM Kit, concerning threshold approach. Parameters such as complete profile, drop-out and pull-up were evaluated. ... 81 Figure 52 - Sensitivity results of the Identifiler Kit, concerning visual approach. Parameters such as complete profile, drop-out and pull-up were evaluated. ... 82 Figure 53 - Sensitivity results of the Identifiler Kit, concerning threshold approach. Parameters such as complete profile, drop-out and pull-up were evaluated... 83 Figure 54 - Sensitivity results of the Powerplex HS 16 Kit, concerning visual approach. Parameters such as complete profile, drop-out and pull-up were evaluated. ... 83 Figure 55 - Sensitivity results of the Powerplex HS 16 Kit, concerning threshold approach. Parameters such as complete profile, drop-out and pull-up were evaluated. ... 84 Figure 56 - Electropherogram of the experiment where increasing amounts of male DNA were mixed with constant female DNA in the following ratios: F:0, F:1, F:2; F:5, F:10, F:15 and F:20. ... 86 Figure 57 - Electropherogram of the experiment where increasing amounts of female DNA were mixed with constant male DNA in the following ratios: M:0, M:1, M:2; M:5, M:10, M:15 and M:20. ... 87
Figure 58 - Electropherogram of the mixtures from 1:5 to 1:10 are shown for the blue fluorochrome to illustrate the loss of the minor contributor full profile. The red arrow shows the allele not called by the Analysis Software. ... 88 Figure 59 - Electropherogram of the mixtures from 1:2 to 1:5 are shown for the yellow fluorochrome to illustrate the loss of the minor contributor full profile. The red arrow shows the allele not called by the Analysis Software. ... 88 Figure 60 - Precision results for the study in controlled conditions, where all loci of the ESSplex Plus kit were analyzed together, with respect to their allele sizes and SD. ... 91 Figure 61 - Precision results for the study in uncontrolled conditions, where all loci of the ESSplex Plus kit were analyzed together, with respect to their allele sizes and SD. ... 92 Figure 62 - Precision results for the study with uncontrolled and controlled conditions, where all loci of the ESSplex Plus kit were analyzed together, respecting their sizes and SD. ... 93 Figure 63 - Precision results for TH01, D16S539, D10S1248 and D2S441 markers. These distributions resulted from the study where values of the controlled and uncontrolled experiments were considered... 93 Figure 64 - Precision results for D3S1358, D1S1656, D22S1045 and D18S51markers. These distributions resulted from the study where values of the controlled and uncontrolled experiments were considered... 94 Figure 65 - Precision results for VWA, D19S433 and D12S391 markers. These distributions resulted from the study where values of the controlled and uncontrolled experiments were considered. ... 95 Figure 66 - Electropherogram of the DNA Size Standard 550 (BTO), fragments with lengths in bp (Qiagen, 2011b). The 240 – 260 bp range is delimited as an example of 10 bp intervals in the 550 BTO size standard. ... 95 Figure 67 - Precision results for D21S11, D8S1179 and FGA markers. These distributions resulted from the study where values of the controlled and uncontrolled experiments were considered. ... 96 Figure 68 - Precision results for D2S1338 marker. This distribution resulted from the study where values of the controlled and uncontrolled experiments were considered. ... 96 Figure 69 - Degradation study results concerning the visual approach. The percentage of heterozygous loci detected across the time range of degradation exposure was calculated for the four multiplexes in study. ... 99
Figure 70 - Degradation study results concerning the threshold approach. The percentage of heterozygous loci detected across the time range of degradation exposure was calculated for the four multiplexes in study. ... 99 Figure 71 - Example of an electropherogram of a random sample submitted to different times of UV-light exposure analysed with ESSplex Plus kit. In this picture, the values of time exposure, experimented in the degradation test (from 0 seconds to 20 minutes), are represented. Note that the y- axis scale was magnified for the smaller input amounts of DNA. ... 101
ABBREVIATIONS
AT Analytical Threshold
bp base pair
CAP College of American Pathologists
CODIS Combined DNA Index System
CT Threshold Cycle
DNA Deoxyribonucleic Acid
DNase Deoxyribonuclease
EDNAP European DNA Profiling Group
EDTA Ethylenediamine tetraacetic acid
ENFSI European Network of Forensic Science Institutes
EPG Electropherogram
ESS European Standard Set
FBI Federal Bureau of Investigation
FST Fixation Index
FTA Fast Technology for Analysis of Nucleic Acids
GHEP-ISFG Spanish and Portuguese-Speaking Working Group of the
ISFG
Indel Insertion/Deletion
IPATIMUP Institute of Molecular Pathology and Immunology of the
University of Porto
ISFG International Society for Forensic Genetics
LINES Long Interspersed Elements
LTRS Long Terminal Repeats
NTC No Template Control
OL Off-Ladder
PARF Parentage/Relationship Proficiency Testing Exercises of
paternity and forensic challenges by CAP
PCR Polymerase Chain Reaction
PHR Peak Height Ratio
PTC Paternity Testing Commission
QA Quality Assurance
QC Quality Control
RFLP Restriction Fragment Length Polymorphism
RFU Relative Fluorescence Unit
RT-PCR Real-Time Polymerase Chain Reaction
SD Standard Deviation
SINES Short Interspersed Elements
SGM Second Generation Multiplex
SNP Single Nucleotide Polymorphism
SOP Standard Operating Procedure
ST Stochastic Threshold
STR Short Tandem Repeat
SWGDAM Scientific Working Group for DNA Analysis Methods
TWGDAM Technical Working Group on DNA Analysis Methods
1. INTRODUCTION
1.1. Short Tandem Repeat Markers and Commercial Multiplex
Kits
1.1.1. Short Tandem Repeat Markers
The largest portion of the genome is composed of repetitive DNA. Part of this DNA is interspersed, with the repeat elements scattered throughout the genome. There are different types of repetitive elements, being the most common the short interspersed elements (SINEs), long interspersed elements (LINEs), long terminal repeats (LTRs) and DNA transposons. The other class of repetitive elements is tandemly repeated DNA. This can be separated into three different types: satellite DNA, minisatellites, and microsatellites (Goodwin et al., 2011).
The short tandem repeat (STR) DNA markers are microsatellites and belong to the class of length polymorphisms, being these repeat sequences usually located between genes, sometimes intronic and rarely exonic, varying in size from person to person (Butler, 2005).
These kind of markers differ in respect to the repeat structure, since they can be simple (Figure 1), compound, complex or even simple with non-consensus alleles (Figure 2). The simple repeats contain units that are identical in sequence and length, the compound ones contain two or more adjacent simple repeats varying in sequence and the complex repeats may present many repeat blocks of variable unit length or variable sequences. Furthermore the repeat motifs also differ by the length of the repeat unit: dinucleotide repeats are composed of two nucleotides tandemly repeated, trinucleotides by three, tetranucleotides by four and so on up to hexanucleotides which have six nucleotides in the core motif (Butler, 2005).
STR markers, introduced into casework in the mid-1990s, are the most commonly analysed genetic polymorphisms in forensic genetics (Goodwin et al., 2011), in terms of genetic identification and kinship analysis (Butler, 2005). The following properties justify this special categorization as forensic markers:
- High polymorphism and discrimination power;
- Easy detection;
- Simultaneous analysis of several STRs, in a single test (multiplex), in automatic platforms with fluorescence detection;
- Multiplex commercial kits available;
Figure 2 - Structure of different types of short tandem repeat markers. In the simple repeat with a non -consensus allele (microvariant), in the example, the 9.3 allele is missing an A from the seventh repeat. The compound repeat is composed by several elements. Finally the complex repeat sequence is also represented with non-consensus alleles that differ in both size and sequence (Butler, 2005).
Figure 1 - Structure of a short tandem repeat marker. The core repeat varies between 1 and 6 bp (mononucleotide to hexanucleotide) being represented a simple tetranucleotide repeat. The alleles are named according to the number of repeats that they contain (Bär W. et al., 1997).
There are also STR alleles which may contain some form of sequence variation, compared to more commonly observed alleles. They are often called microvariants because they have only a slightly different structure from full repeat alleles. Associated with this term, usually comes another one, off-ladder (OL) alleles, that refers to alleles that often do not size the same as consensus alleles present in the allelic ladder used as reference for genotyping samples (Butler, 2005).
Nowadays, the polymerase chain reaction (PCR) has been employed with unique flanking sequence primers to amplify DNA fragments containing STR loci (Sprecher et
al., 1996). After the amplification process, the length of the products must be measured
precisely. There was a limitation concerning the number of loci incorporated into the multiplexes, due to the allelic size ranges of the different loci, where overlap was not allowed. To overcome this fact, fluorescence labelling of PCR products followed by multicolour detection has been adopted by the forensic community (Lins et al., 1996, Sprecher et al., 1996). Thus, a series of fluorescent dyes has been developed and can be covalently attached to the 5’ end of one of the PCR primers in each primer pair. Therefore, up to five different dyes can be used in a single analysis which allows for considerable overlap of loci (Buel et al., 1998, Ziegle et al., 1992). After analysing the raw data with the software, the end result is an electropherogram with a series of peaks that represent different alleles: the size, peak height and peak area are also measured.
During polymerase chain reaction (PCR) amplification of STR alleles, there are particular artefacts that can arise and interfere in the correct interpretation and genotyping of the alleles present in the DNA template. These stochastic effects may give rise to additional peaks besides the true alleles (Butler, 2005).
In the forensic genetics field, short tandem repeat markers with four or five base-pair core-repeat motifs are widely used and the most adopted by the forensic community (Bakker et al., 2005). This results from the fact that each STR locus has a tendency to generate a stutter product. Stutter is a phenomenon which derives from DNA polymerase slippage during PCR (Figure 3) and is dependent on the structure of the core repeats: shorter di- and trinucleotide repeats are more prone to stutter than are tetra and pentanucleotide repeats (Figure 3) (Bakker et al., 2005).
The stutter effect always occurs and reflects the presence of smaller or larger peaks than each STR allele, and corresponds to a size difference related to the repeat motif. Even if stutters like n-2 and n+1 repeats (among others) may be observed, the most common stutter products are one repeat less (n-1) than the corresponding main allele. Measuring the percentage of stutter for each locus, may serve as a guideline for the detection of mixture samples. In a broad manner, if stutter ratios are introduced in the analysis software, this will act as a threshold for calling or not a stutter peak as a true allele for a certain locus. Nevertheless there are some parameters that can influence the stutter effect, such as the length and sequence inherent to the repeat motif (Applied Biosystems, 2011, Qiagen, 2010).
Another PCR derived artefact is the addition of an extra nucleotide to the 3′-end of a PCR product by the DNA polymerases, namely an adenine. This addition is a normal event during the copying process of the template strand. When this non-template addition occurs it results in a PCR product that is one base pair longer than the actual target sequence. If the process is incomplete, then a PCR product with fragment sizes
Figure 3 - The picture above shows the slippage process between the template and the nascent DNA strands. The copied strand represents the most common case and contains one repeat less than the template strand (n-1). The stutter peaks are indicated by the arrow and their size relative to the main peak is shown (based on peak area): (a) Dinucleotide repeat, which is prone to high levels of slippage. (b) Tetranucleotide repeat, which displays lower levels of stutter (Goodwin et al., 2011).
differing by one bp will co-exist, named split peaks (+/−A) (Figure 4). This process is referred to as ‘adenylation’ or the ‘+A’ form of the amplicon (Clark, 1988).
Stochastic events may also be observed when analysing STR markers. Allele drop-out is a process consisting in a failure to amplify, and therefore failure to detect an allele that exists in the template DNA. It is known that sequence polymorphisms can occur within or around STR repeat regions and that these variations can occur in three locations (relative to the primer binding sites): within the repeat region, in the flanking region, or in the primer-binding region (Figure 5) (Butler, 2005). Even if flanking sequences, around STR repeats, are fairly stable and consistent between samples, a polymorphism in these regions can result in silent alleles as consequence of primer hybridization problems (Kline et al., 2011).
Figure 4 - Split peaks are seen in profiles when the non-template addition does not occur with all of the PCR products. The three examples show decreasing amounts of non-template addition with panel (a) showing an example where the vast majority of PCR product has the non-template addition through to panel (c), where only about 50% of the PCR product has the non-template addition (Goodwin et al., 2011).
The drop-out event is also associated to low template DNA analysis, particularly of the larger STR loci (Figure 6), and degraded DNA, chemically modified (Goodwin et al., 2011).
Figure 5 - (a) The variation occurs within the repeat region and should have no impact on the primer binding and the subsequent PCR amplification. (b) The sequence variation occurs just outside the repeat in the flanking region but interior to the primer annealing sites. Again, PCR should not be affected although the size of the PCR product may vary slightly. (c) The PCR can fail due to a disruption in the annealing of a primer because the primer no longer perfectly matches the DNA template sequence (Butler, 2005).
Figure 6 - With 1ng of template DNA, the peaks are well balanced and easy to interpret. When the PCR does not have enough template to amplify (0.25 ng), then allelic drop-out can occur (Goodwin et al., 2011).
Allelic drop-in phenomena may also occur. It is mainly observed in low template DNA analysis because of contamination from environmental DNA. The main problem concerning this effect is related with a difficult interpretation of correct true alleles in a degraded or low copy number sample, since the appearance of extra peaks is inherent of this phenomenon (Schneider, 2007).
Another fact concerning STR loci analysis is related to equilibrium of alleles in heterozygous state. Two peaks in a STR profile are expected to be balanced in terms of peak height and area. However, peak height imbalance is very usual and variations in peak height can be due to chance events, where one allele is more efficiently amplified than another, for example due to a polymorphism in the annealing zone or to the presence of mixtures (real mixtures or contamination cases). Normally, an evaluation of the magnitude of heterozygous peaks is made, in order to achieve a threshold (peak height ratio), usually around 70% (Gilder et al., 2011), which may serve as a guideline for the detection of mixtures or drop-out.
There is also another phenomenon called pull-up that can emerge from the STR loci analysis. Since the dyes used to label amplified DNA fragments are at different wavelengths, there is some overlap in the emission spectra of these dyes. If an overamplified sample is analysed, this can saturate the matrix and results in a pull-up peak of another colour under the main peak. These pull-up peaks need to be differentiated from true alleles in order to obtain a correct interpretation, since that other colour may also be interpreted as an allele of another locus within the same multiplex (Clayton et al., 1998).
In order to be correctly applied in forensic genetic analysis, STR markers should be selected and studied taking into account specific properties, such as artefacts and stochastic effects, mutation rates, robustness in PCR, among others. It is also necessary to perform a population genetic study, in order to evaluate the behaviour of these markers in a particular population sample and their informativeness for forensic genetic applications.
1.1.2. Commercial Multiplex Kits
For the evolution and standardization of forensic genetics and for effectiveness of STR markers across a wide number of jurisdictions, a pressure was created to select a common set of standardized markers. The STR loci that are mostly used nowadays, were initially developed in the Dr. Thomas Caskey laboratory’s, at the Baylor College of Medicine. Afterwards, Promega Corporation began the commercialization of these “Caskey markers” and Applied Biosystems also developed some new STR markers.
The selection of genetic markers should respect some particular features, namely (Goodwin et al., 2011):
- Be discrete and have distinguishable alleles;
- The locus amplification should be robust;
- Should have a high power of discrimination;
- Should have absence of genetic linkage with other loci being analysed;
- Enable low levels of artefact formation during the amplification process;
- Have the ability of being amplified as part of a multiplex PCR.
A commercially available multiplex kit for the forensic field is composed by a set of reagents (primers and buffers containing a DNA polymerase amongst other components), previously tested by the manufacturer, in what concerns composition, quantity and performance, allowing for assurance of reliable results. The first multiplex commercial kit was developed in 1994, by Promega Corporation, known as Triplex CTT STR Multiplex System and was able to amplify 3 STR markers: CSF1PO, TPOX, and TH01 (Budowle et al., 1997).
After that, a “quadruplex” kit was developed in the UK (United Kingdom) by the Forensic Science Service (and commercialized by Applied Biosystems), considered the “first-generation multiplex” for forensic analysis. In this multiplex kit 4 STRs were amplified in the same reaction: TH01, FES/FPS, VWA and F13A1 (Kimpton et al., 1994).
Later, a commercial multiplex kit, known as “second-generation multiplex” (SGM), was developed again by the Forensic Science Service (also commercialized by Applied Biosystems) and replaced the “quadruplex” system. This multiplex allowed the amplification of six polymorphic STRs: TH01, VWA, FGA, D8S1179, D18S51, and D21S11 (Goodwin et al., 2011). After this period, with the introduction of fluorescent detection platforms, the development of STR kits that allows robust multiplex amplification of eight or more loci has revolutionized the forensic DNA field. STR profiles are now obtained in just a few hours which is an enormous breakthrough when compared with previous methods (for example, RFLP: restriction fragment length polymorphism) (Butler, 2005). The AmpF/STR ® SGM Plus ®, developed by Applied Biosystems, rapidly replaced the SGM kit and was adopted by many other countries around the world as one of their standard multiplex kits (Cotton et al., 2000).
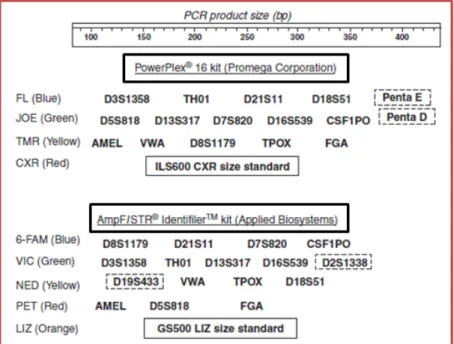
At this time, in addition to the STR loci, the sex-determining Amelogenin locus, located in the X and Y chromosomes, was also incorporated into the most commonly used commercial multiplex kits (Thangaraj et al., 2002). After this, the USA selected 13 STR markers to incorporate its database management system named CODIS (Combined DNA Index System) and at this time several multiplexes were developed to cover these selected markers: CSF1PO, FGA, TH01, TPOX, VWA, D3S1358, D5S818, D7S820, D8S1179, D13S317, D16S539, D18S51, and D21S11. Thereby, two major companies developed different commercial kits, for example, the AmpFlSTR ® Identifiler (Applied Biosystems) and the PowerPlex ® 16 (Promega Corporation), which allow the co-amplification of these 13 STRs in a single reaction, along with the amelogenin sex-typing marker and two additional STR loci (Figure 7) (Collins et al., 2004, Krenke et al., 2002).
Since that time, both Applied Biosystems and Promega Corporation have developed several commercial kits that address the needs of the DNA typing community and cover a common set of STR loci with matching probabilities that exceed one in a billion, in a single amplification reaction with 1ng or less of DNA sample (Butler, 2005).
However, there are also laboratories that develop their own internal multiplexes. This kind of approach is time consuming and many resources are spent, which in many cases will not compensate the effort. Thus, the convenience of implementing these commercial kits is given by the fact that, on one hand, they are conveniently optimized and suffer criterious developmental validation and, on the other hand, allow opportunities for sharing data between laboratories since available kits determine which STRs will be used by the vast majority of forensic laboratories. This standardization allows the development of national DNA databases increasingly powerful in the forensic genetics field (Butler, 2005, Goodwin et al., 2011). Only very recently has a third multinational company started contributing in this field, Qiagen, who has proposed a new range of opportunities concerning multiplex forensic kits, trying to answer the need for more sensitive, robust, fast and accurate genotyping kits.
Figure 7 - Commercially available kits for the 13 CODIS core loci: Powerplex®16 and Identifiler (Butler, 2005). The genetic markers surrounded by black lines correspond to additional loci.
1.2. The new Standard Set of European Genetic Markers (ESS)
in the forensic field and the Next Generation Kits
1.2.1. The new Standard Set of European Genetic Markers (ESS)
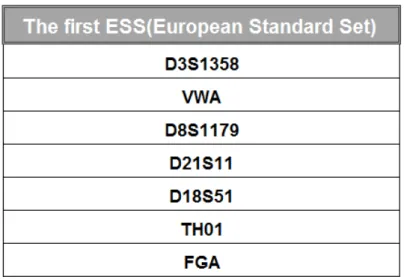
On the 25th of June of 2001, the Council of the European Union proposed the first list of genetic markers to be used in Europe by the Member States, for judicial purposes, respecting the main objectives of the European Union Treaty (February of 1992) and the resolution of this Council concerning the exchange of DNA results (June of 1997). Taking into account the growing importance of DNA in criminal investigation and the use of its effective exchange to oppose criminality, a list of 7 genetic markers was proposed (Table 1), composing the ESS (European Standard Set). The Member-States would have to adopt them and obtain DNA analysis results by using techniques previously validated, with these new loci. These kind of markers, for forensic purposes, must be devoid of any information about hereditary specific traits so to be authorized their use in the exchange of DNA information between member-states that adopt this new set (Union, 2001).
Later, in July 2005, concerning terrorism related subjects, cross-border crime and illegal migration, some European countries such as Belgium, Germany, Spain, France, Luxembourg, Netherlands and Austria decided to take part in cross-border cooperation, in the well-known Convention of Prüm (Germany). In this way, the establishment of
Table 1 - Composition of the first European Standard Set of Forensic Genetic Markers (ESS): D3S1358, VWA, D8S1179, D21S11, D18S51, TH01 and FGA.
Table 2 - Composition of the current European Standard Set of Forensic Genetic Markers (ESS): left column represent the first European Genetic Markers (2001) and in the right column is the new set of forensic genetic markers: D1S1656, D2S441, D10S1248, D12S391 and the D22S1045.
national DNA analysis files had to be created by these members, for the investigation of criminal offences and the viable exchange of DNA information. This Convention determined the necessary procedures to generate automated searching and comparison of DNA profiles as well as issues concerning national contact points and technical information of the data (Union, 2005).
The Council of the European Union decided, in 2008, to implement a new decision concerning border cooperation, particularly in combating terrorism and cross-border crime. The main aim of this decision refers to administrative and technical provisions, in particular the automated exchange of DNA data, dactyloscopic data and vehicle registration data. Regarding exchange of DNA-data, this decision comes to clarify several issues about this matter such as the recommendations for DNA database management, including criteria for addition or deletion of DNA profiles, matching rules and handling of partial profiles (Union, 2008).
Most recently, in 2009, on the exchange of DNA analysis results Council and regarding all work of the DNA Working Group of the European Network of Forensic Science Institutes (ENFSI), for the harmonization of the DNA markers and DNA technology across the years, it was proposed a new additional set of forensic genetic markers. Taking into account that an effective information exchange is facilitated by increasing the number of markers, and that the exchange of DNA data between Member States is rapidly progressing, it was necessary to expand the existing European Standard Set of loci (ESS) adopted in 2001 and provide more genetic information concerning loci that are capable of analysing degraded DNA samples. The European Standard Set (ESS) comprises nowadays the following DNA markers (Union, 2009):
Once information was available relative to this new set of markers, members of the European Union were invited to use, at least, the DNA markers represented in Table 2, in order to facilitate an exchange of DNA analysis results. Thus, European members were invited to build up ESS analysis results in accordance with scientifically tested and approved DNA technology following the studies and frameworks developed by ENFSI.
It should be also remembered that these additional loci are not known to contain information about specific hereditary characteristics. If anything concerning this matter were to be discovered about a particular locus, member states were advised to no longer use that marker in DNA exchanges and also to delete any DNA results received (Union, 2009). The new set of five forensic genetic markers was initially characterized, concerning technical and specific parameters.
In Table 3 are represented the markers that make part of the extended ESS (European Standard Set) and are contained in the main new Next Generation Kits directed for European countries: NGMTM and NGM SElectTM kits (Applied Biosystems),
Powerplex®ESI and ESX Systems (Promega), and ESSplex SE and ESSplex Plus kits
(Qiagen) (Butler and Hill, 2012).
1.2.2. The Next Generation Kits
Since national DNA databases are becoming the most powerful tool in forensic investigation and genetic identification, and at the same time each country was selecting the STR markers that allowed an inclusion in their own database, the ESS (European Standard Set) core of loci was created, trying to achieve the standardization of forensic genetics across Europe. However, the creation of this new set does not
Table 3 - Locus – specific information of the new set of forensic genetic markers: D2S441, D10S1248, D22S1045, D1S1656 and D12S391 (Butler and Hill, 2012, Lareu et al., 1998, Lareu et al., 1996).
mean that European countries should leave the loci that have been using in the construction of their national databases in favour of the new ones, but instead they would have to adopt and use these new markers in future analysis (Schneider, 2009).
Regarding this issue, ENFSI and the European DNA Profiling Group (EDNAP) have been working together to achieve standardization of DNA profiling throughout Europe, with the main purpose of facilitating the comparison of DNA profiles between laboratories (Gill et al., 2006a). The intention of these groups was the creation and design of multiplexes that could achieve the benefit of criminal justice systems, simultaneously increasing detection rates and reducing potential adventitious matches. This purpose is thought to be achieved by the adoption of this new set of genetic markers, increasing the chance of success in highly degraded samples and the discrimination power of all samples tested, since the decrease of amplicon sizes and the increase of the number of loci detected will be guaranteed (Gill et al., 2006b). In this way, the main goals for the new multiplexes were:
- Improve the discrimination power with the addition of more loci;
- Improve sensitivity of testing in order that smaller amounts of DNA may be detected;
- Improve robustness and quality through the more effective amplification of degraded DNA (Gill et al., 2006a).
Thus, from the results of collaborative experiments of the ENFSI/EDNAP groups, came a need to alter existing multiplexes to improve success rates when degraded DNA is analysed (Gill et al., 2006a). In fact, the EDNAP group demonstrated that low molecular weight STR loci show benefits in detecting degraded samples since they increase the chance of successful amplification by targeting smaller loci (Dixon et al., 2006). Damage to the DNA molecule can occur through exposure to environmental conditions, such as ultraviolet light, heat and humidity. Forensic samples are particularly prone to such damage due to their prolonged exposure after deposition (Diegoli et al., 2011). Unfortunately, amplicon size and the ability to amplify extremely degraded DNA molecules were not considered when the first STR loci were selected. Thus, several of them have a large number of repeats or wide allele ranges which are not appropriate for generating small amplicons. In this way, leaders of the European forensic DNA community recommended the addition of new mini-STR loci (capable of
small fragment amplification) to the 13 CODIS markers (Butler, 2006b). As a consequence of this study, a convergence of two initial strategies was proposed to produce a final product containing 15 loci: in strategy I, mini-STRs (D2S441, D22S1045 and D10S1248) were added to multiplexes that were already developed, providing a multiplex with 13 loci for countries using SGM plus kit. In a second strategy, a second group of loci (D12S391 and D1S1656) was preferred by some European countries, to be included in the new multiplexes, since these midi-STRs provide a higher discrimination power and their size was already reduced. Thus, the convergence of these two strategies intended to combine the advantages of strategy 1 and 2, resulting in new multiplexes composed, generally, by 15 loci plus Amelogenin. The choice for these particular 5 new genetic markers was due to the fact that they are located on separate chromosomes or are genetically unlinked from the widely used 13 CODIS markers (Gill et al., 2006b).
Regarding this new multiplex strategy, there was a need to develop commercially available kits with these ESS core markers. Concerning this need, the major commercial companies in the forensic field started several studies and developmental procedures in order to bring to the market the Next Generation Kits and a number of STR multiplexes fulfilling the ENFSI and EDNAP objectives. These autosomal kits have in common the fact that they share the same core of forensic markers (Figure 8). These 12 European core loci are typically accompanied by D16S539, D2S1338, D19S433 and SE33 markers (Schneider, 2009).
Figure 8 - Graphic representation of the European Standard Set core of genetic markers plus additional markers which frequently also composed the Next Generation Kits, shaded in grey (Butler, 2010b). The new set of genetic markers is surrounded with red lines.
Nowadays, the validated Next Generation Kits belonging to the three major companies are commercially available. However, if laboratories wish to adopt them they must first suffer vigorous internal validation, before their introduction in routine casework.
1.3. The Internal Validation Process: history, validation
guidelines and studies
It was in the USA, in a few unaccredited laboratories, that some cases emerged where DNA analysis was compromised due to several problems, concerning building construction, techniques and laboratory personnel inadequately trained. The kind of complications encountered resulted later in wrongful decisions of the judicial system, illustrating the need for consistent internal quality assurance and external control to ensure accuracy within a laboratory (Butler, 2005). Thus, it was decided that any scientific procedure, test or product related with DNA typing which results in genetic information that may lead to the loss of liberty of any individual involved or not in a judicial process, needs to be implemented very carefully. Thereby, in order that this sort of process can be conducted properly and since DNA testing is always regarded as a powerful investigative tool for the law enforcement community, two main concepts were created concerning good laboratory practices and accurate scientific results:
Quality assurance (QA) and Quality control (QC). QA is related to planned and
systematic actions that are needed to ensure confidence in a product or service. On the other hand, QC is related to the routine operational techniques and the procedures used to fulfil requirements of quality.
Therefore, since these concepts are crucial in the development of forensic DNA technology, numerous organizations were established across the forensic community in order to recommend and inspect quality assurance guidelines and quality control measures (Butler, 2005).
1.3.1. Ensuring Quality: Guidelines and Accreditation
Validation guidelines for quality assurance programs, in DNA analysis, were first published in the USA, more exactly in 1989, when the Technical Working Group on DNA Analysis Methods (TWGDAM) was created, under FBI Laboratory sponsorship. These validation guidelines were later republished and updated in 1991 and 1995, and
in 1998 this organization changed its name to Scientific Working Group on DNA Analysis Methods (SWGDAM). Over the years, several subcommittees have elaborated numerous recommendations before the SWGDAM, concerning issues related to good practices in forensic genetics. In July 2004, SWGDAM published revised validation guidelines, being currently the most recent guidelines, and it operates nowadays as the responsible group for the recommendations concerning quality issues, to the forensic community within the USA (Butler, 2005, Butler et al., 2004).
In Europe, the International Society for Forensic Genetics (ISFG), formerly International Society for Forensic Haemogenetics, ISFH), is an international organization responsible for the promotion of scientific knowledge in the genetic markers field, analysed for forensic purposes, and includes several members from 50 countries, with a strong impact in Europe. The ISFG has established a Paternity Testing Commission (PTC) which is concerned in establishing general standards for testing laboratories based on ISO 17025 standards (Morling et al., 2002). However, it was in 1995 that the first European organization was created with the responsibility of commanding the set of standards for exchange of data, between European member states, namely ENFSI (Butler, 2005).
The European forensic DNA community has another organization, EDNAP, and is constituted by a dozen European nations. This organization is, in fact, a working group of the ISFG and has been conducting a series of inter-laboratory studies on STR markers, investigating the reproducibility of results from multiple laboratories, showing that with quality control measures excellent reproducibility can be obtained by these groups (Butler, 2005).
Nowadays, any forensic laboratory which performs DNA tests and analysis for other institutions, such as courts or private companies, among others, should undergo an accreditation process by an official organization. This process results from a successful audit by an accrediting body and requires that the laboratory demonstrates good lab practices regarding chain-of-custody and evidence handling procedures. A laboratory audit evaluates its entire operation and is conducted by its own laboratory staff (internal audit) or by an independent organization (external audit), taking into account pre-established guidelines. The results and records of each audit must be saved as a way to define what can be improved (Butler, 2005).
Proficiency tests are also mandatory and should be performed periodically. A proficiency test has the purpose of evaluating a laboratory´s performance in conducting DNA analysis procedures, by integrating the laboratory’s normal routine work. Thus, these kind of tests also evaluate the ability to obtain a concordant result using the standard operating protocols (SOPs) approved for a certain laboratory. Regarding this issue, proficiency tests could be internal proficiency tests that are administered by a laboratory´s member or external proficiency tests that are administered by an external organization. If this sort of test is performed such that the laboratory staff does not know that a test is being made, then it is called a blind external proficiency test. This blind test is considered the most effective at monitoring a laboratory´s performance.
Although it can be rather expensive and time-consuming, the participation in proficiency – testing programs is a crucial part of a successful laboratory´s quality assurance. The main purposes of these tests are the standardization of methods and procedures, the standardization of nomenclature, the evaluation of the competence of a laboratory to obtain the correct result and the elimination of errors in typing (FBI, 2008).
In the accreditation process, one of the main issues is validation of methods. This is probably the most difficult and time-consuming task, but it must be undertaken before the introduction of any method in routine casework (Butler, 2005).
1.3.2. Validation
The validation process is an essential part of a quality assurance program in a laboratory, when new techniques and technologies are being introduced. This concept involves performing specific laboratory studies to verify if a new instrument, software program or product is working properly. In other words, a validation study is a process where a particular laboratory procedure is considered robust, reliable and reproducible. A robust method ensures successful results in a high percentage of the time while a reliable method refers to one where the obtained results are correct and reflect the samples being tested. Concerning a reproducible method, it represents the ability to obtain the same or similar results, each time a sample is tested. It is through the validation process that the scientific community acquires the necessary information about the conditions, limitations and specificities of a particular procedure (Butler, 2006a, Butler, 2007).