www.hydrol-earth-syst-sci.net/20/3843/2016/ doi:10.5194/hess-20-3843-2016
© Author(s) 2016. CC Attribution 3.0 License.
Local impact analysis of climate change on precipitation extremes:
are high-resolution climate models needed for realistic simulations?
Hossein Tabari1, Rozemien De Troch2,5, Olivier Giot2,6, Rafiq Hamdi2,5, Piet Termonia2,5, Sajjad Saeed3, Erwan Brisson3, Nicole Van Lipzig3, and Patrick Willems1,4
1Hydraulics Division, Department of Civil Engineering, KU Leuven, Kasteelpark Arenberg 40, 3001 Leuven, Belgium 2Royal Meteorological Institute of Belgium, Brussels, Belgium
3Department of Earth and Environmental Sciences, KU Leuven, Leuven, Belgium
4Department of Hydrology and Hydraulic Engineering, Vrije Universiteit Brussel, Brussels, Belgium 5Department of Physics and Astronomy, Ghent University, Ghent, Belgium
6Plant and Vegetation Ecology, University of Antwerp, Antwerp, Belgium
Correspondence to:Hossein Tabari ([email protected], [email protected]) Received: 3 March 2016 – Published in Hydrol. Earth Syst. Sci. Discuss.: 7 March 2016 Revised: 17 August 2016 – Accepted: 1 September 2016 – Published: 14 September 2016
Abstract.This study explores whether climate models with higher spatial resolutions provide higher accuracy for pre-cipitation simulations and/or different climate change sig-nals. The outputs from two convection-permitting climate models (ALARO and CCLM) with a spatial resolution of 3–4 km are compared with those from the coarse-scale driv-ing models or reanalysis data for simulatdriv-ing/projectdriv-ing daily and sub-daily precipitation quantiles. Validation of histor-ical design precipitation statistics derived from intensity– duration–frequency (IDF) curves shows a better match of the convection-permitting model results with the observations-based IDF statistics compared to the driving GCMs and re-analysis data. This is the case for simulation of local sub-daily precipitation extremes during the summer season, while the convection-permitting models do not appear to bring added value to simulation of daily precipitation extremes. Results moreover indicate that one has to be careful in as-suming spatial-scale independency of climate change sig-nals for the delta change downscaling method, as high-resolution models may show larger changes in extreme pre-cipitation. These larger changes appear to be dependent on the timescale, since such intensification is not observed for daily timescales for both the ALARO and CCLM models.
1 Introduction
et al., 2004; Christensen and Christensen, 2007; Mayer et al., 2015). Whatever climate models are used, verification of their results under the current climate is needed, be-cause some high-resolution RCMs fail to adequately describe local-scale surface processes (especially in inhomogeneous regions with complex topography) due to the convective pa-rameterization scheme or the characteristics of the GCM they are nested in (Hohenegger et al., 2008, and Willems et al., 2012).
High-resolution (convection-permitting resolutions) cli-mate models are of great added value to simulate large con-vective storms and mesoscale organization (Kendon et al., 2014; Prein et al., 2015). At these resolutions, deep convec-tion is partly resolved and does not need to rely entirely on parameterizations. The representation of the daily cycle in precipitation, extreme events and spatial variability strongly improves for convection-permitting models (Kendon et al., 2012; Prein et al., 2013a, b, 2015; Brisson et al., 2016a; Ban et al., 2014, 2015, Fosser et al., 2015, 2016). However, their long-term simulation is restricted due to high compu-tational costs. They are consequently mainly applied for nu-merical weather prediction (Done et al., 2004; Baldauf et al., 2011; Tang et al., 2013). The first simulations for decadal time periods using convection-permitting models point to a stronger increase in extremes compared to coarser-resolution integration, but the number of climate change impact studies with these models is limited so far (Hohenegger et al., 2008; Kendon et al., 2012, 2014; Prein et al., 2015).
The use of regional climate models for local impact stud-ies of climate change on precipitation (totals or extremes) has been increased in recent years (e.g., Willems and Vrac, 2011; Olsson et al., 2012, 2015; Mearns et al., 2013; Rajczak et al., 2013). Nevertheless, in some studies, climate scenarios have been based on a broad set of coarse-resolution GCM re-sults (Deng et al., 2013; Rana et al., 2014; Sun et al., 2015). Now, the question is whether high-resolution climate mod-els truly improve extreme precipitation simulations, and, if so, to what extent. This study intends to answer this research question by comparing high-resolution models (RCMs with resolutions between 40 and 3 km) with their driving GCM or reanalysis data for simulating sub-daily and daily precipita-tion quantiles. Further comparisons are performed for
simu-based statistical downscaling method (e.g., Ntegeka et al., 2014; Sunyer et al., 2015). In this study, the validity of this hypothesis is investigated by comparing the climate change signals between the high and coarse scale resolution models. Central Belgium is considered as the study location.
2 Climate models 2.1 ALARO model
The ALARO-0 model is a high-resolution regional cli-mate model developed by the Royal Meteorological Insti-tute (RMI) of Belgium based on the numerical weather prediction model called Aire Limitee Adaptation Dy-namique Developpement International (ALADIN). Here-after, ALARO is used as shorthand name for the ALARO-0 model described in De Troch et al. (2ALARO-013). The ALADIN model is the limited area model (LAM) version of the Ac-tion de Recherche Petite Echelle Grande Echelle Integrated Forecast System (ARPEGE-IFS). The physics parameteriza-tion package of the ALARO model was designed specifically for running at resolutions between 3 and 8 km. The specific characteristics of the Modular Multiscale Microphysics and Transport (3MT) convection scheme used in the ALARO model lead to a good multiscale performance, particularly in convection-permitting resolutions (De Troch et al., 2013). The ALARO simulations for the present climate conditions over Belgium were performed for the periods 1961–1990 and 1981–2010 at resolutions ranging from 40 km down to 4 km, both using a set of simulations forced with 40 or ERA-Interim reanalysis as well as with the CNRM-CM3 GCM for the historical control run (Table 1). For the future climate projections (2071–2100), the CNRM-CM3 GCM under the A1B scenario was used to force the ALARO model (Hamdi et al., 2014).
2.2 CCLM model
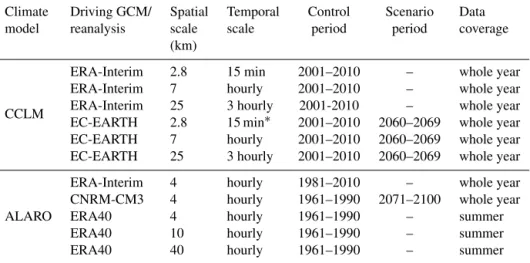
Table 1.The convection-permitting model runs used in this study.
Climate Driving GCM/ Spatial Temporal Control Scenario Data
model reanalysis scale scale period period coverage
(km)
CCLM
ERA-Interim 2.8 15 min 2001–2010 – whole year
ERA-Interim 7 hourly 2001–2010 – whole year
ERA-Interim 25 3 hourly 2001-2010 – whole year
EC-EARTH 2.8 15 min∗ 2001–2010 2060–2069 whole year
EC-EARTH 7 hourly 2001–2010 2060–2069 whole year
EC-EARTH 25 3 hourly 2001–2010 2060–2069 whole year
ALARO
ERA-Interim 4 hourly 1981–2010 – whole year
CNRM-CM3 4 hourly 1961–1990 2071–2100 whole year
ERA40 4 hourly 1961–1990 – summer
ERA40 10 hourly 1961–1990 – summer
ERA40 40 hourly 1961–1990 – summer
∗CCLM
EC-EARTHdata for the scenario period are available for the hourly timescale.
2003), designed by the Deutsche Wetterdienst (DWD) for operational weather prediction. In order to perform climate simulations with the COSMO model, the CLM community provided extensions such as dynamic surface boundaries, a more complex soil model and the possibility of using various CO2concentration values (Böhm et al., 2006; Rockel et al.,
2008).
The model settings are based on a previous study by Bris-son et al. (2016a), which provide recommendations for per-forming climate simulations at a convection-permitting scale. The one-moment microphysical parameterization includes a representation of graupel hydrometeors. In addition, the domain size of this simulation (192×175 grid points) is large enough to ensure that the analysis is not affected by the spatial spin-up described in Brisson et al. (2016a). The integration scale of global models largely differs from the convection-permitting scale. A multiple nesting strategy was therefore selected to carry out such simulations (Brisson et al., 2016a, b). A three-step nesting strategy was applied with the driving data, either from ERA-Interim reanalysis data or the EC-EARTH GCM, forcing a CCLM at 25 km grid mesh size, which in turn forces a CCLM at 7 km grid mesh size, and next at the final 2.8 km grid mesh size. Model simula-tions were performed for the period 2001–2010, and a thor-ough evaluation of the statistics of precipitation, temperature and cloud characteristics was recently performed (Brisson et al., 2016b). The CCLM driven by EC-EARTH was per-formed for the period 2000–2010 and 2060–2069 using the RCP4.5 emission scenario (Table 1). Hereafter, the driving GCM or reanalysis dataset is shown as a subscript to the name of the RCM. As the control run of the EC-EARTH GCM ends in 2009, its data for the period 2000–2009 were used for comparing with the driven CCLM simulations.
3 Methodology
Figure 1.Hourly precipitation extremes in a matrix of 3×3 ALAROERA-Interim4 km model grid points surrounding the closest model grid point to Uccle (Gridcell 5), for the summer (left panel) and winter (right panel) seasons (historical climate: 1961–1990).
after calibrating an extreme value distribution to these POT precipitation extremes. Also, for the calculation of the pre-cipitation change factors for given return periods, these two different approaches were followed and compared: empirical data based and extreme value distribution based change fac-tors. For the distribution based change factors, first a distri-bution is fitted separately to the extreme values of the control and scenario runs of the climate models. Afterwards, change factors are computed as a ratio between the fitted distribution values of the scenario and control runs.
In addition to the quantile analysis, the historical simula-tions of the climate models are validated based on precipita-tion intensity–duraprecipita-tion–frequency (IDF) curves that are typ-ically used for design storm calculations and related designs, e.g., urban drainage systems and hydraulic structures. The IDF curves for 1-month, 1-year and 10-year return periods and for durations from 10–15 min up to 1 month are devel-oped for the control runs of the climate models as well as the observations. The IDF curves are derived based on POT extreme value statistics after calibration of two-component exponential distributions, following Willems (2000). In this paper, the precipitation intensities of given return periods are referred to as design precipitation quantiles.
For the climate models, precipitation data are extracted from a matrix of 3×3 model grid points (nine cells) sur-rounding the closest model grid point to Uccle station in central Belgium. This station is selected because it has high-quality 10 min observations recorded with the same instru-ment since 1898 (Demarée, 2003). In addition to the 10 min station observations, daily E-OBS gridded data (v12.0, Hay-lock et al., 2008) for 27.8 and 55.7 km are used. These grid-ded data are aggregated to larger pixels of 167 and 334 km to be consistent with the grid mesh size of the driving GCMs and reanalysis data. The aggregation is also performed to up-scale the outputs of the convection-permitting climate els to check the accuracy of the spatial structure in the mod-els.
4 Validation of precipitation simulations
The capability of the climate models to simulate the present-day precipitation is evaluated before investigating future pre-cipitation changes. Prior to this performance evaluation, the precipitation extremes from the model grid cell covering Uc-cle station are compared with those from neighboring cells for possible outlier or unrealistic values. The analysis shows spatial consistency in the frequency of daily and sub-daily precipitation extremes for both the ALARO and CCLM mod-els. As an example, Fig. 1 illustrates hourly precipitation ex-tremes in a matrix of 3×3 ALAROERA-Interim 4 km model
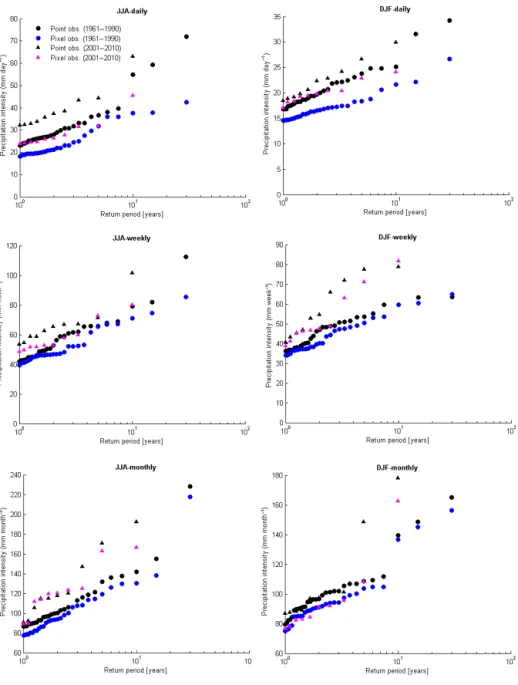
Figure 2.Comparison between point and pixel interpolated (spatial resolution of 27.8 km) Uccle precipitation of different timescales for summer (left-column panels) and winter (right-column panels).
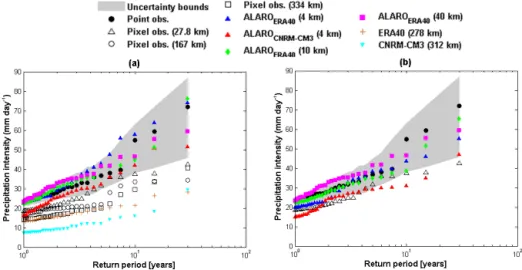
coarser 40 km grid. The results on the native model grids are presented to evaluate whether the available climate model runs are of direct use for climate change impact analysis in urban hydrology. The native daily precipitation extremes re-veal the largest extreme values for the ALAROERA40 4 km
model (Fig. 3a). However, this might be due to the precip-itation decrease after the spatial averaging. The overestima-tion of the ALARO runs nested in the ERA40 reanalysis data is also evident on the native model grids, while the extreme simulations of the ALAROCNRM-CM3model with 4 km
res-olution are in between the point observations and the grid-ded ones, with a grid size of 27.8 km, which shows the good accuracy of these simulations. When comparing the model
results at the same grid size (Fig. 3b), the ALAROERA40
40 km outputs are larger than those from the ALAROERA40
sim-Figure 3.Validation of the native(a)and aggregated(b)daily precipitation quantiles (1961–1990) for the ALARO model and its driving GCM or reanalysis data based on Uccle observations, for the summer season (shaded areas show at-site confidence intervals for the point observations using the bootstrap-based 95 % confidence intervals).
Figure 4.Validation of the native(a)and aggregated(b)daily precipitation quantiles (2001–2010) for the CCLM model and its driving GCM or reanalysis data based on Uccle observations, for the summer season (shaded areas show at-site confidence intervals for the point observations using the bootstrap-based 95 % confidence intervals).
ulation of summer precipitation extremes appears to be be-cause of a better representation of the small-scale character-istics and spatial variability relevant for convection (Fig. 3b). The CNRM-CM3 GCM and ERA40 reanalysis data used as the boundary conditions of the ALARO model show a sys-tematic underestimation, especially for the higher return pe-riods (Fig. 3a). The convection parameterization has been found to be responsible for this underestimation (Kendon et al., 2014).
As for the CCLM model, the native daily precipitation quantiles from the 2.8 km runs are larger for most of the cases (Fig. 4a). After upscaling of the finer-resolution models (2.8 and 7 km) to the larger scale (25 km), the results of the models become similar (Fig. 4b). The driving EC-EARTH
resolu-Figure 5.Validation of the extreme precipitation (averaged over the extreme events withT >1 year) simulations for ALARO, CCLM and the driving GCMs or reanalysis data based on point and pixel interpolated Uccle observations for the summer (left panels) and winter (right panels) seasons, vs. the models’ spatial scale.
tions does not show a clear difference, either in precipitation intensity or in simulation skill (Fig. 4b).
The extreme precipitation (averaged over the extreme events with T >1 year) simulations of the climate models vs. spatial scales for both the summer and winter seasons are shown in Fig. 5. Taking the spatial scale difference into account and averaging the extreme values with T >1 year, the ALAROERA40simulations are closer to the observations
compared with the ALAROCNRM-CM3 model. A decease in
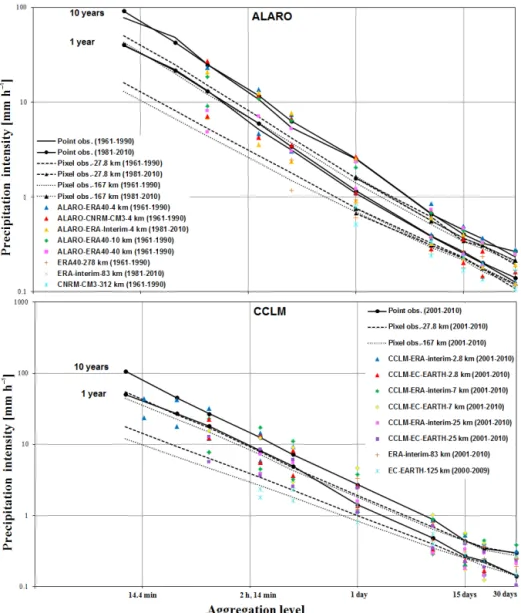
Figure 6.Comparison of historical IDF relationships based on point and pixel interpolated Uccle observations, with CCLM, ALARO and the driving GCM or reanalysis results for the summer season (IDF curves for the E-OBS pixel data were extrapolated for the sub-daily timescales based on extreme value distribution).
the climate models (not shown) decreases as the timescales get larger (i.e., weekly and monthly).
The validation of the climate model simulations for the summer season in terms of IDF statistics is shown in Fig. 6 for timescales in the range between 10–15 min and 30 days. The IDF curves are plotted with reference to de-sign precipitation intensities from the station and E-OBS pixel data over the Uccle location (central Belgium). Com-paring the hourly simulations of the ALAROERA40 model
with different resolutions shows the greater intensities for finer resolutions. In terms of accuracy, all of the ALARO runs except the ALAROCNRM-CM3 for the 10-year return
period and the ALAROERA40 40 km for both return
pe-riods underestimate the station observations and overesti-mate the gridded observations (extrapolated for sub-daily
precipitation based on extreme value distribution). Regard-ing 3- and 6-hourly timescales, the ALARO model simu-lates more intense precipitation of the 10-year return pe-riod in comparison to both the station and gridded obser-vations. The model underestimates (overestimates) extreme precipitation of the 1-year return period and 3- and 6-hourly durations when compared with the station (gridded) ob-servations. Daily precipitation intensity of the 10-year re-turn period derived from the point observations is underes-timated by the ALAROERA40 and ALAROERA-Interim runs
and overestimated by the ALAROCNRM-CM3 run, while all
the runs overestimate the pixel observation-based statistics. All the ALARO runs except the ALAROERA-Interim
nested in reanalysis data for larger timescales between 5 and 30 days shows overestimation of the ALAROERA40 and
underestimation of the ALAROERA-Interim with respect to
the station data, whereas both of them overestimate the pixel observation-based statistics. The other ALARO 4 km run (ALAROCNRM-CM3) underestimates both the point and
pixel observation-based statistics for these larger aggregation levels (5, 10, 15 and 30 days).
The CCLM model simulates less intense 15 min precipi-tation of a 10-year return period (Fig. 6). However, this un-derestimation changes to overestimation for larger sub-daily aggregation levels. For the sub-daily design storms of the 1-year return period, the CCLM model generally underes-timates the station observations, while both overestimations and underestimations are seen in comparison with the grid-ded observations. However, the EC-EARTH GCM extremely underestimates both the gridded and rain-gauge observations for the 10-year return period. This supports the recent find-ings for underestimation of heavy hourly precipitation dur-ing summer by large-scale climate models and more accu-rate simulations of convection-permitting models (Chan et al., 2013, 2014; Ban et al., 2014; Fosser et al., 2015). In the case of daily duration, which are less important for ur-ban drainage applications, the CCLM runs underestimate (overestimate) the precipitation intensity of the 1-year re-turn period in comparison with the point (gridded) observa-tions (Fig. 6). The underestimation of higher intensities by the CCLM 2.8 km run for summer has also been reported in the literature (Fosser, 2014). For the daily precipitation extremes of 10-year return period, the 2.8 km runs and the CCLMEC-EARTH25 km underestimate (overestimate)
precip-itation intensity from the point (gridded) observations, while the rest of the CCLM runs show the opposite behavior. For the larger aggregation levels between 5 and 30 days, the pre-cipitation intensities of the 1-year return period derived from both the point and pixel observations are underestimated by all the CCLM runs. For the 5-day duration and 10-year re-turn period, underestimation of the station observation-based statistics and overestimation of the pixel observation-based statistics are seen for all the CCLM runs except for the 7 km runs. The CCLMERA-Interim2.8 and 7 km runs simulate larger
precipitation extremes for the 10-, 15- and 30-day durations of the 10-year return period, whereas the CCLMERA-Interim
25 km run simulates smaller extremes. The similarity be-tween the CCLM 2.8 and 7 km runs is expected to be ex-plained by the similarity in lateral boundary conditions since the CCLM 2.8 km model is nested in the CCLM 7 km model. However, the difference between these runs becomes obvi-ous when the convection is dominant in sub-daily summer precipitation, as they treat deep convection in different ways. The CCLMEC-EARTH 25 km run shows the same pattern as
the CCLMERA-Interim run: underestimation of extreme
pre-cipitation intensity for the 10-, 15- and 30-day durations of the 10-year return period. Both overestimations and underes-timations are seen for the CCLMEC-EARTH2.8 and 7 km runs
for the 10-, 15- and 30-day durations of the 10-year return period (Fig. 6).
For the winter season (December–January–February: DJF), the results show overestimations of the ALARO and CCLM models (Fig. 5). As winter precipitation over Bel-gium is mainly controlled by large-scale circulation, an im-provement in the simulations of convection-permitting mod-els in comparison to the parent large-scale modmod-els is less expected for the winter season. Although improved simu-lations of winter precipitation by the convection-permitting model have been reported for regions with complex topogra-phy (Ikeda et al., 2010; Rasmussen et al., 2011) due to better resolved orography (Prein et al., 2015), this effect is less rel-evant for Belgium, which is more flat. Whereas winter daily precipitation extremes are systematically overestimated by the ALARO model, the driving CNRM-CM3 GCM slightly underestimates the winter extremes (Fig. 5). Deficiency of very high-resolution climate models in simulation of win-ter precipitation extremes is because the fronts and synoptic depressions that cause the dynamical processes driving win-ter precipitation events have scales of 102–103km. This defi-ciency has been demonstrated by Hong and Leetmaa (1999) and Chan et al. (2013). For the CCLM model, when the CCLMEC-EARTH2.8 and 7 km simulations are compared with
those of the CCLMERA-Interim 2.8 and 7 km for the daily
winter extremes, the overestimations of the earlier runs are higher than the later ones, while for larger timescales (weekly and monthly) the opposite pattern is observed.
5 Future precipitation changes
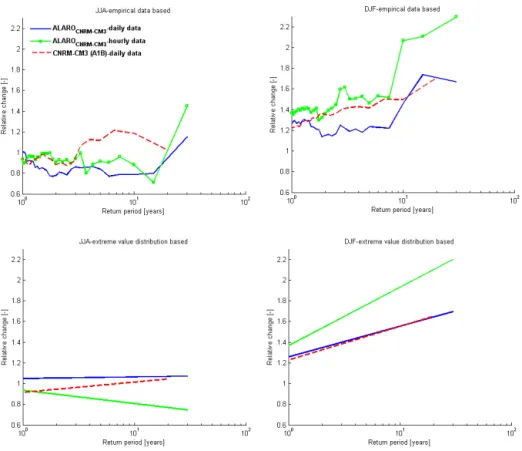
moves the randomness involved in the high return peri-ods of the empirical data for summer, leading to a slight difference in the range of changes. However, for the win-ter season the change factors from the two methods have similar ranges. The change factors obtained from the ex-treme value distribution fitting are further discussed here. The ALAROCNRM-CM3 projects an increasing signal in the
range of 26 to 69 % for daily winter extremes. The projected increase is even higher for hourly winter extremes, ranging between 37 and 120 %. When the change factors computed by the ALAROCNRM-CM3are compared with those obtained
from the driving CNRM-CM3 GCM, more or less the same conclusion can be made: an increasing signal for daily win-ter extremes between 23 and 67 %. For the summer season, the change factors from the ALAROCNRM-CM3model and the
parent CNRM-CM3 GCM are around 1, meaning no change in daily summer extremes. However, smaller hourly sum-mer extremes are expected based on the ALAROCNRM-CM3
model projections, with a decreasing signal down to−26 %. Generally, it can be inferred from the results that, at the syn-optic (daily) scale, the projections by the ALARO model are consistent with those from the driving GCMs. De Troch et al. (2013) pointed out that an increase in spatial resolution in the ALARO model is not as important as the parameteriza-tion scheme used for extreme precipitaparameteriza-tion modeling at the daily scale.
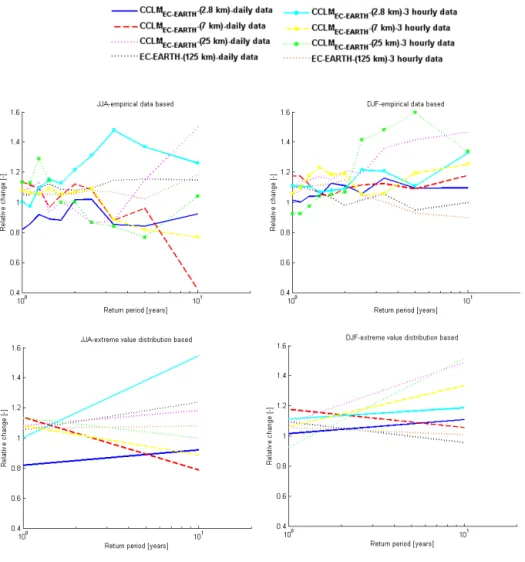
Figure 8 shows the change factors for daily and 3-hourly precipitation computed using the CCLMEC-EARTH model
with different spatial resolutions and the driving EC-EARTH GCM for the winter and summer seasons. The change factors for all extreme events withT >1 year are shown in this fig-ure. For the winter season, the change factors for both daily and 3-hourly precipitation decrease as the model’s resolu-tion increases. Nevertheless, the change factors for all the CCLM runs are higher than those for the driving EC-EARTH GCM. A larger change is projected for 3-hourly precipitation compared with daily precipitation. For summer, the greatest change is obtained for 3-hourly precipitation extremes from the CCLMEC-EARTH 2.8 km run. This increasing signal goes
as high as 55 %. When the change factors in 3-hourly precipi-tation extremes from the CCLMEC-EARTHruns are compared
with those from the driving EC-EARTH GCM, the results show an amplification of the future climate change signals
6 Concluding remarks
A comparative study between the convection-permitting cli-mate models with a spatial resolution from 2.8 up to 40 km and driving GCMs or reanalysis data was performed to check whether the models with higher resolution provide more ac-curate precipitation simulations. Another analysis was per-formed to validate the spatial-scale independency assump-tion of climate change signals for the delta change down-scaling method. The results show that, whereas winter daily precipitation extremes are generally overestimated by the ALARO and CCLM models, improved results for summer precipitation extremes are observed, especially for sub-daily timescales. This suggests the added value of convection-permitting climate models to simulate summer sub-daily ex-tremes because of either better representation of deep con-vection or more detail of the land surface. The results more-over indicate that the difference between the convection-permitting models and the parent GCMs or reanalysis data decreases as the timescales get larger (i.e., weekly and monthly). Based on the precipitation statistics derived from IDF curves, the ALARO and CCLM models mostly under-estimate local sub-daily precipitation, but still better simu-late it compared with parent GCM or reanalysis data when available. Higher precipitation intensities by finer-resolution models are a result of better representation of small-scale convective precipitation by these models.
Figure 7.Change factors for daily and hourly precipitation quantiles computed using the ALAROCNRM-CM34 km and the driving CNRM-CM3 (A1B) for the summer (left-column panels) and winter (right-column panels) seasons, obtained from the empirical data (top panels) and after use of the extreme value distributions (bottom panels).
the extreme value distribution are compared with those from the empirical data, it is seen that for both the ALARO and CCLM models the climate change signals derived from ex-treme value distribution fitting are slightly different from the ones obtained from the empirical data for summer due to the removed randomness in the empirical data by the distribution fitting. However, for the winter season the change factors ob-tained from the two approaches cover more or less the same range.
In summary, because the results of this study indicate that the local sub-daily summer precipitation simulations of the high-resolution climate models are closer to the observations, their future projections are expected to be more accurate than those of the driving GCMs. These climate change signals ob-tained from the high-resolution models may differ from the ones based on the coarse-resolution models, as a result of im-proved representation of complex landscape and land surface processes in high-resolution models. However, the result-ing precipitation change from these high-resolution climate models should not be interpreted as an exact number, because of their limited number. More runs with high-resolution mod-els are required to check the consistency among modmod-els. In the same way as an ensemble approach on climate models provides uncertainty estimates on the climate change signals, an ensemble of the high-resolution models provides
uncer-tainty estimates on the difference between the climate change signals of fine vs. coarse scale. Also, the statistical signifi-cance of the difference in climate change signals at fine vs. coarse scale can be tested in such an approach. From the comparison in this study, the results of the CCLMEC-EARTH
Figure 8.Change factors for daily and 3-hourly precipitation quantiles computed using CCLMEC-EARTH2.8, 7, and 25 km for the summer (left-column panels) and winter (right-column panels) seasons, obtained from the empirical data (top panels) and after use of the extreme value distributions (bottom panels).
validity of the temporal-scale independency assumption of climate change signals.
7 Data availability
The E-OBS data are freely available at the website of the European Climate Assessment and Data (http://www.ecad. eu/download/ensembles/download.php). The reanalysis data are publicly available from the European Centre for Medium-Range Weather Forecasts (ECMWF) (http://www.ecmwf. int/en/research/climate-reanalysis). The historical precipita-tion time series were provided by the Royal Meteorologi-cal Institute (RMI) of Belgium (http://www.meteo.be/meteo/ view/en/65239-Home.html). The high-resolution ALARO and CCLM data are not publicly available.
Author contributions. The simulations of the ALARO climate model were performed in the Royal Meteorological Institute of Bel-gium (RMI) by Rozemien De Troch, Olivier Giot, Rafiq Hamdi and
Piet Termonia. The CCLM climate model was implemented by Saj-jad Saeed, Erwan Brisson and Nicole Van Lipzig in the Earth and Environmental Sciences Department of KU Leuven. H. Tabari and P. Willems developed the methodology and performed the analy-ses. The paper was prepared by Hossein Tabari and Patrick Willems with substantial contributions from all co-authors.
Acknowledgements. This study was partly supported by research projects for the Flemish Environment Agency (Division Oper-ational Water Management and Environmental Reporting), and partly by the Belgian Science Policy Office (CORDEX.be project, BRAIN-be program) and the European Union’s Horizon 2020 research and innovation program (project BRIGAID, grant agree-ment no. 700699).
Edited by: M.-C. ten Veldhuis
References
Baldauf, M., Seifert, A., Förstner, J., Majewski, D., Raschendor-fer, M., and Reinhardt, T.: Operational convective-scale nu-merical weather prediction with the COSMO model: Descrip-tion and sensitivities, Mon. Weather Rev., 139, 3887–3905, doi:10.1175/MWR-D-10-05013.1, 2011.
Ban, N., Schmidli, J., and Schar, C.: Evaluation of the convection-resolving regional climate modeling approach in decade-long simulations, J. Geophys. Res.-Atmos., 119, 7889–7907, doi:10.1002/2014JD021478, 2014.
Ban, N., Schmidli, J., and Schär, C.: Heavy precipitation in a changing climate: Does short-term summer precipita-tion increase faster?, Geophys. Res. Lett., 42, 1165–1172, doi:10.1002/2014GL062588, 2015.
Böhm, U., Kücken, M., Ahrens, W., Block, A., Hauffe, D., Keuler, K., Rockel, B., and Will, A.: CLM – The Climate Version of LM : Brief Description and Long-Term Applications, COSMO Newsletters, 6, 225–235, 2006.
Brisson, E., Demuzere, M., and van Lipzig, N. P. M.: Modelling strategies for performing convection-permitting climate simula-tions, Meteorol. Z., 25, 149–163, 2016a.
Brisson, E., Van Weverberg, K., Demuzere, M., Devis, A., Saeed, S., Stengel, M., and van Lipzig, N. P. M.: How well can a convection-permitting climate model reproduce decadal statistics of precipitation, temperature and cloud characteristics?, Clim. Dynam., doi:10.1007/s00382-016-3012-z, in press, 2016b. Chan, S. C., Kendon, E. J., Fowler, H. J., Blenkinsop, S., Ferro, C.
A. T., and Stephenson, D. B.: Does increasing the spatial resolu-tion of a regional climate model improve the simulated daily pre-cipitation?, Clim. Dynam., 41, 1475–1495, doi:10.1007/s00382-012-1568-9, 2013.
Chan, S. C., Kendon, E. J., Fowler, H. J., Blenkinsop, S., Roberts, N. M., and Ferro, C. A.: The value of high-resolution met office regional climate models in the simulation of multi-hourly precip-itation extremes, J. Climate, 27, 6155–6174, doi:10.1175/JCLI-D-13-00723.1, 2014.
Christensen, J. H. and Christensen, O. B.: A summary of the PRUDENCE model projections of changes in European cli-mate by the end of this century, Climatic Change 81, 7–30, doi:10.1007/s10584-006-9210-7, 2007.
Demarée, G. R.: Le pluviographe centenaire du plateau d’Uccle: son histoire, ses données et ses applications, La Houille Blanche, 4, 95–102, doi:10.1051/lhb/2003082, 2003.
Deng, H., Luo, Y., Yao, Y., and Liu, C.: Spring and summer precipi-tation changes from 1880 to 2011 and the future projections from CMIP5 models in the Yangtze River Basin, China, Quatern. Int., 304, 95–106, doi:10.1016/j.quaint.2013.03.036, 2013.
De Troch, R., Hamdi, R., Van De Vyver, H., Geleyn, J.-F., and Termonia, P.: Multiscale performance of the ALARO-0 model for simulating extreme summer precipitation climatology in Belgium, J. Climate, 26, 8895–8915, doi:10.1175/JCLI-D-12-00844.1, 2013.
Done, J., Davis, C. A., and Weisman, M.: The next generation of NWP: Explicit forecasts of convection using the Weather Re-search And Forecasting (WRF) model, Atmos. Sci. Lett., 5, 110– 117, doi:10.1002/asl.72, 2004.
ECMWF: Climate reanalysis, http://www.ecmwf.int/en/research/ climate-reanalysis, last access: September 2016.
European Climate Assessment & Dataset: E-OBS gridded dataset, http://www.ecad.eu/download/ensembles/download.php, last ac-cess: September 2016.
Fosser, G.: Precipitation statistics from regional climate model at resolutions relevant for soil erosion, KIT Scientific Publishing, Karlsruhe, 2014.
Fosser, G., Khodayar, S., and Berg, P.: Benefit of convec-tion permitting climate model simulaconvec-tions in the representa-tion of convective precipitarepresenta-tion, Clim. Dynam., 44, 45–60, doi:10.1007/s00382-014-2242-1, 2015.
Fosser, G., Khodayar, S., and Berg, P.: Climate change in the next 30 years: What can a convection-permitting model tell us that we did not already know?, Clim. Dynam., doi:10.1007/s00382-016-3186-4, in press, 2016.
Gudmundsson, L., Bremnes, J. B., Haugen, J. E., and Engen-Skaugen, T.: Downscaling RCM precipitation to the station scale using statistical transformations – a comparison of methods, Hy-drol. Earth Syst. Sci., 16, 3383–3390, doi:10.5194/hess-16-3383-2012, 2012.
Hamdi, R., Van de Vyver, H., De Troch, R., and Termonia, P.: As-sessment of three dynamical urban climate downscaling meth-ods: Brussels’s future urban heat island under an A1B emission scenario, Int. J. Climatol., 34, 978–999, doi:10.1002/joc.3734, 2014.
Haylock, M. R., Hofstra, N., Klein Tank, A. M. G., Klok, E. J., Jones, P. D., and New, M.: A European daily high-resolution gridded dataset of surface temperature and precipitation, J. Geophys. Re.-Atmos., 113, D20119, doi:10.1029/2008JD10201, 2008.
Hofstra, N., Haylock, M., New, M., and Jones, P. D.: Testing EOBS European high-resolution gridded data set of daily precipita-tion and surface temperature, J. Geophys. Res., 144, D21101, doi:10.1029/2009JD011799, 2009.
Hohenegger, C., Brockhaus, P., and Schar, C.: Towards climate simulations at cloud-resolving scales, Meteor. Z., 17, 383–394, doi:10.1127/0941-2948/2008/0303, 2008.
Hong, S. Y. and Leetmaa, A.: An evaluation of the NCEP RSM for regional climate modeling, J. Climate, 12, 592–609, doi:10.1175/1520-0442(1999)012<0592:AEOTNR>2.0.CO;2, 1999.
Ikeda, K., Rasmussen, R., Liu, C., Gochis, D., Yates, D., Chen, F., Tewari, M., Barlage, M., Dudhia, J., Miller, K., Arsenault, K., Grubiši´c, V., Thompson, G., and Guttman, E.: Simulation of seasonal snowfall over Colorado, Atmos. Res., 97, 462–477, doi:10.1016/j.atmosres.2010.04.010, 2010.
IPCC: The Scientific Basis, in: Contribution of Working Group I to the Third Assessment Report of the Intergovernmental Panel on Climate Change, edited by: Houghton, J. T., Ding, Y., Griggs, D. J., Noguer, M., van der Linden, P. J., Dai, X., Maskell, K., and Johnson, C. A., Cambridge University Press, Cambridge, UK and New York, NY, USA, p. 881, 2001.
IPCC: IPCC Fourth Assessment Report (AR4), Cambridge Univer-sity Press, Cambridge, 2007.
0499-2, 2014.
Johnson, F., Westra, S., Sharma, A., and Pitman, A. J.: An assess-ment of GCM skill in simulating persistence across multiple time scales, J. Climate, 24, 3609–3623, doi:10.1175/2011JCLI3732.1, 2011.
Kendon, E. J., Roberts, N. M., Senior, C. A., and Roberts, M. J.: Realism of rainfall in a very high-resolution regional cli-mate model, J. Clicli-mate, 25, 5791–5806, doi:10.1175/JCLI-D-11-00562.1, 2012.
Kendon, E. J., Roberts, N. M., Fowler, H. J., Roberts, M. J., Chan, S. C., and Senior, C. A.: Heavier summer downpours with climate change revealed by weather forecast resolution model, Nat. Clim. Change, 4, 570–576, doi:10.1038/nclimate2258, 2014.
Maraun, D.: Bias correction, quantile mapping, and downscal-ing: revisiting the inflation issue, J. Climate, 26, 2137–2143, doi:10.1175/JCLI-D-12-00821.1, 2013.
Maraun, D., Wetterhall, F., Ireson, A. M., Chandler, R. E., Kendon, E. J., Widmann, M., Brienen, S., Rust, H. W., Sauter, T., Themessl, M., Venema, V. K. C., Chun, K. P., Goodess, C. M., Jones, R. G., Onof, C., Vrac, M., and Thiele-Eich, I.:: Precipita-tion downscaling under climate change: Recent developments to bridge the gap between dynamical models and the end user, Rev. Geophys., 48, RG3003, doi:10.1029/2009RG000314, 2010. Masson, D. and Knutti, R.: Spatial-scale dependence of climate
model performance in the CMIP3 ensemble, J. Climate, 24, 2680–2692, doi:10.1175/2011JCLI3513.1, 2011.
Mayer, S., Maule, C., Sobolowski, S., Christensen, O., Sørup, H., Sunyer, M., Arnbjerg-Nielsen, K., and Barstad, I.: Identifying added value in high-resolution climate simulations over Scandi-navia, Tellus A, 67, 24941, doi:10.3402/tellusa.v67.24941, 2015. Mearns, L. O., Giorgi, F., Whetton, P., Pabon, D., Hulme, M., and Lal, M.: Guidelines for use of climate scenarios developed from regional climate model experiments, Data Distribution Centre of the Intergovernmental Panel on Climate Change, Norwich, UK, 2004.
Mearns, L. O., Sain, S., Leung, L. R., Bukovsky, M. S., McGin-nis, S., Biner, S., Caya, D., Arritt, R. W., Gutowski, W., Takle, E., Synder, M., Jones, R. G., Nunes, A. M. B., Tucker, S., Herz-mann, D., McDaniel, L., and Sloan, L: Climate change projec-tions of the North American Regional Climate Change Assess-ment Program (NARCCAP), Climatic Change, 120, 965–975, doi:10.1007/s10584-013-0831-3, 2013.
Ntegeka, C., Baguis, P., Roulin, E., and Willems, P.: De-veloping tailored climate change scenarios for hydro-logical impact assessments, J. Hydrol., 508, 307–321, doi:10.1016/j.jhydrol.2013.11.001, 2014.
K., Clark, M. P., and Liu, C. H.: Importance of Regional Cli-mate Model Grid Spacing for the Simulation of Heavy Precip-itation in the Colorado Headwaters, J. Climate, 26, 4848–4857, doi:10.1175/JCLI-D-12-00727.1, 2013b.
Prein, A. F., Langhans, W., Fosser, G., Ferrone, A., Ban, N., Go-ergen, K., Keller, M., Gutjahr, M. T. O., Feser, F., Brisson, E., Kollet, S., Schmidli, J., van Lipzig, N. P. M., and Leung, R. L.: A review on regional convection-permitting climate model-ing: demonstrations, prospects, and challenges, Rev. Geophys., 3, 323–361, doi:10.1002/2014RG000475, 2015.
Rajczak, J., Pall, P., and Schär, C.: Projections of extreme precip-itation events in regional climate simulations for Europe and the Alpine Region, J. Geophys. Res.-Atmos., 118, 3610–3626, doi:10.1002/jgrd.50297, 2013.
Rana, A., Fostera, K., Bosshard, T., Olsson, J., and Bengts-son, L.: Impact of climate change on rainfall over Mum-bai using Distribution-based Scaling of Global Climate Model projections, J. Hydrol. Reg. Stud., 1, 107–128, doi:10.1016/j.ejrh.2014.06.005, 2014.
Rasmussen, R., Liu, C., Ikeda, K., Gochis, D., Yates, D., Chen, F., Tewari, M., Barlage, M., Dudhia, J., Yu, W., Miller, K., Arse-nault, K., Grubiši´c, V., Thompson, G., and Gutmann, E.: High-resolution coupled climate runoff simulations of seasonal snow-fall over Colorado: A process study of current and warmer cli-mate, J. Clicli-mate, 24, 3015–3048, 2011.
Rauscher, S. A., Coppola, E., Piani, C., and Giorgi, F.: Reso-lution effects on regional climate model simulations of sea-sonal precipitation over Europe, Clim. Dynam., 35, 685–711, doi:10.1007/s00382-009-0607-7, 2010.
RMI: Weather Forecast, http://www.meteo.be/meteo/view/en/ 65239-Home.html, last access: September 2016.
Rockel, B., Will, A., and Hense, A.: The Regional Climate Model COSMO-CLM (CCLM), Meteorol. Z., 17, 347–348, doi:10.1127/0941-2948/2008/0309, 2008.
Steppeler, J., Doms, G., Schättler, U., Bitzer, H. W., Gassmann, A., Damrath, U., and Gregoric, G.: Meso-gamma scale forecasts us-ing the nonhydrostatic model LM, Meteorol. Atmos. Phys., 82, 75–96, doi:10.1007/s00703-001-0592-9, 2003.
Sun, Q., Miao, C., and Duan, Q.: Projected changes in temperature and precipitation in ten river basins over China in 21st century, Int. J. Climatol., 35, 1125–1141, doi:10.1002/joc.4043, 2015. Sunyer, M. A., Sørup, H. J. D., Christensen, O. B., Madsen, H.,
Hy-drol. Earth Syst. Sci., 17, 4323–4337, doi:10.5194/hess-17-4323-2013, 2013.
Sunyer, M. A., Hundecha, Y., Lawrence, D., Madsen, H., Willems, P., Martinkova, M., Vormoor, K., Bürger, G., Hanel, M., Kri-auˇci¯unien˙e, J., Loukas, A., Osuch, M., and Yücel, I.: Inter-comparison of statistical downscaling methods for projection of extreme precipitation in Europe, Hydrol. Earth Syst. Sci., 19, 1827–1847, doi:10.5194/hess-19-1827-2015, 2015.
Tabari, H. and Willems, P.: Daily precipitation extremes in Iran: decadal anomalies and possible drivers, J. Am. Water Resour. As., 52, 541–559, doi:10.1111/1752-1688.12403, 2016. Tabari, H., AghaKouchak, A., and Willems, P.: A perturbation
ap-proach for assessing trends in precipitation extremes across Iran, J. Hydrol., 519, 1420–1427, doi:10.1016/j.jhydrol.2014.09.019, 2014.
Tabari, H., Taye, M. T., and Willems, P.: Water availability change in central Belgium for the late 21st century, Global Planet. Change, 131, 115–123, doi:10.1016/j.gloplacha.2015.05.012, 2015.
Tang, Y., Lean, H. W., and Bornemann, J.: The benefits of the met office variable resolution NWP model for forecasting convection, Meteorol. Appl., 20, 417–426, doi:10.1002/met.1300, 2013. van Haren, R., van Oldenborgh, G. J., Lenderink, G., and Hazeleger,
W.: Evaluation of modeled changes in extreme precipitation in Europe and the Rhine basin, Environ. Res. Lett., 8, 014053, doi:10.1088/1748-9326/8/1/014053, 2013.
van Pelt, S. C., Beersma, J. J., Buishand, T. A., van den Hurk, B. J. J. M., and Kabat, P.: Future changes in extreme precipitation in the Rhine basin based on global and regional climate model simula-tions, Hydrol. Earth Syst. Sci., 16, 4517–4530, doi:10.5194/hess-16-4517-2012, 2012.
Willems, P.: Compound IDF-relationships of extreme precipitation for two seasons and two storm types, J. Hydrol., 233, 189–205, doi:10.1016/S0022-1694(00)00233-X, 2000.
Willems, P.: A time series tool to support the multi-criteria per-formance evaluation of rainfall-runoff models, Environ. Model. Softw., 24, 311–321, doi:10.1016/j.envsoft.2008.09.005, 2009. Willems, P.: Revision of urban drainage design rules
af-ter assessment of climate change impacts on precipita-tion extremes at Uccle, Belgium, J. Hydrol., 496, 166–177, doi:10.1016/j.jhydrol.2013.05.037, 2013.
Willems, P. and Vrac, M.: Statistical precipitation down-scaling for small-scale hydrological impact
investiga-tions of climate change, J. Hydrol., 402, 193–205,
doi:10.1016/j.jhydrol.2011.02.030, 2011.