Pak. J. Anal. Environ. Chem. Vol. 12, No. 1 & 2 (2011) 88-94
Physicochemical Properties, Contamination and Suitability
of Canal Water for Irrigation, Lahore Branch Pakistan
Tayyaba Aftab
1, Tahira Shafiq
2, Bushra Khan*
3and Muhammad Nawaz Chaudhry
41,2
Centre for Environmental Protection Studies,Pakistan Council of Scientific & Industrial Research, Lahore, Pakistan.
3,4
College of Earth and Environmental Sciences, University of the Punjab, Lahore, Pakistan.
Received 02 February 2011, Revised 09 March 2011, Accepted 02 November 2011
---
Abstract
The pollution status of Lahore branch canal was determined by physical, chemical and metal constituents because the water is used for irrigation of lands in and around the city. The average result of each physical, chemical and metal parameter at 12 different sites (1 to Location-12) of Lahore branch canal was compared with Food and Agricultural organization (FAO). All physical and chemical parameters were within standards limit while metals concentrations were found in variable quantities in canal water samples. cadmium, copper and chromium concentration was found much higher than the permissible FAO standards.
Keywords:Water; Contamination; Physico chemical parameters and Lahore branch canal.
---
Introduction
Pakistan’s economy is largely depended on
irrigation because of its arid and semi arid climate. The irrigation system is of the largest in world, consists of major reservoirs, barrages, main canals and water forces over about millions of hectors of land. The available water does not need the irrigation requirement, to augment in adequate supplies of good quality water; poor quality ground/drainage water is used [1]. Irrigation water is consumed by livestock and thus affects its health. There is possibility of uptake of contaminants for irrigation water by crops thus affecting human health. Many studies have been conducted on the quality of canal water used for irrigation. Extensive work has been done in Pakistan regarding the evaluation of irrigation water quality. In this regard, work by irrigation department Punjab, Water and Power Development Authority (WAPDA), Pakistan Council of Research on Water Resources (PCRWR) is notable. At the International level of FAO, United Nation Guidelines has been extensively used to
evaluate irrigation water guidelines [2]. In 1978, a study was conducted on the lined Bhambhanwala Ravi Badian Depalpur (BRBD) link canal. The causes of deterioration of water quality and remedial measures were discussed in detail [3]. The sediment increase in the canal due to heavy burden of population growth in turn increases the leaching effect to the ground water [4]. The impacts of pollution activities become widespread and they affect the public health, the economy and the environment [5]. The pollution load in Phulali canal, which passes through the Hyderabad city, was high [6]. Sewage and industrial effluents are continuously flowing into the canal water, which is used for agriculture purposes. The results of the canal water quality were compared with FAO, WAPDA and PCRWR and National Environmental Quality Standards NEQS.
The hazardous effect of metals on environment had seen in Faisalabad city, Pakistan. The chemical composition of soil and vegetation,
when irrigated with sewer mix canal water was loaded with potassium, phosphorous, iron, copper, zinc, manganese, nickel and lead [7]. The evaluation of irrigation water for heavy metals contamination was studied in Akbarpura District Noshera. Comparative study on irrigation canal and Bara river water on heavy metals contents revealed that irrigation canal was less polluted as compared to Bara river water [8]. The heavy metals contents were accumulated and distributed in agricultural soil when irrigated by canal water mix with sewer and industrial wastewater [9]. The present study was aimed at collection and physicochemical analysis of water samples from Lahore branch canal, so as to determine the extent of pollution, the impact of activities by residents of surrounding areas that is a continuous threat to canal water resources its ecosystem and suitability for required use.
Experimental
Study area
Lahore branch canal is a beautiful waterway passing through the second larger city of Pakistan, Lahore. The Lahore branch Niaz Baig distributory serves the districts of Lahore and Kasur with 4,00,000 acres of fertile agriculture land with population of about 2.0 million inhabitants. All the area is being irrigated by gravity flow. The ground water of the area is partly sweet and saline with water table at 55 feet. The water in the canal is used publicly for swimming, washing, boating, fishing, drinking, recreational activities and irrigation. With the passage of time, regular, un- checked and discriminate disposal of domestic, municipal sewage, industrial and agriculture wastes accumulated organic and inorganic pollutants, heat (weather conditions) solid and semi solid refuses (human, animal excretes, fruit and vegetable wastes, plastic material, wood and glass) into the canal has become very common. Many small and medium size workshops and industries located in the areas of Jallo village, Mughalpura, Harbanspura, Baghbanpura, Dharampura, Fateh Garh, Taj pura, Lalpul, Muslim Town, Mehdi Pur are continuously throwing domestic wastewater from human settlement, sewer/ laundry effluent, agricultural waste and wastewater from unauthorized factories into the canal without any check and balance. A
total of 45 inlets were counted in 50-km stretch during survey and collection of the samples. Untreated wastewater reduces the suitability of canal water for irrigation, livestock consumption and aesthetics use.
The Lahore branch canal receives domestic, industrial wastewater through overflowing gutters and wastewater drain. Large variation in physicochemical characteristics was observed at different sampling site from L-1 to L-12.
Sampling technique
At all sampling sites, the water depth was between 3-4 meters. Three samples were collected each month at each site for one year according to standard procedures. Flow proportionate samples were collected and pooled to obtain one composite sample at that site. (Table 1) shows the detail of all twelve sampling sites. Large non-homogenous matter as leaves, rags, twigs and other floating material in the sample was avoided. A plastic cup with long handle was use to collect the samples in labeled polyethylene 1 liter screw cap container which were cleaned sequentially with detergent, tap water and many distilled water rinses [10]. Each container was filled to the brim with the sample water to avoid any space. Each collected sample was recorded and identified with a unique sample number, date, collection hours, exact location and description of surroundings. It was brought to the laboratory within two hours of collection and processed accordingly for the analysis of different parameters [11]. All the chemicals used were of analytical grade and double distill water was used in the study.
Physical parameters
settleable solids and dissolved oxygen DO were determined by standard methods [12].
Chemical / Inorganic parameters
Inorganic constituents of chloride, sulphate, hardness, chemical oxygen demand
(COD) biochemical oxygen demand (BOD), nitrate, nitrite and metal contents, i-e., zinc, chromium, cadmium, copper, manganese, nickel and iron were determined by atomic absorption spectrophotometer (Varian) according to standard methods [12].
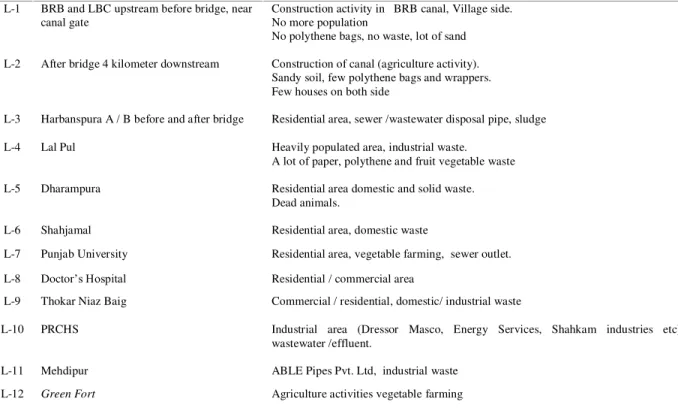
Table 1. Sampling Station Sampling Site Associated Activities.
L-1 BRB and LBC upstream before bridge, near canal gate
Construction activity in BRB canal, Village side. No more population
No polythene bags, no waste, lot of sand
L-2 After bridge 4 kilometer downstream Construction of canal (agriculture activity). Sandy soil, few polythene bags and wrappers. Few houses on both side
L-3 Harbanspura A / B before and after bridge Residential area, sewer /wastewater disposal pipe, sludge
L-4 Lal Pul Heavily populated area, industrial waste. A lot of paper, polythene and fruit vegetable waste
L-5 Dharampura Residential area domestic and solid waste. Dead animals.
L-6 Shahjamal Residential area, domestic waste
L-7 Punjab University Residential area, vegetable farming, sewer outlet.
L-8 Doctor’s Hospital Residential / commercial area
L-9 Thokar Niaz Baig Commercial / residential, domestic/ industrial waste
L-10 PRCHS Industrial area (Dressor Masco, Energy Services, Shahkam industries etc) wastewater /effluent.
L-11 Mehdipur ABLE Pipes Pvt. Ltd, industrial waste
L-12 Green Fort Agriculture activities vegetable farming
Results and Discussion
Physical parameters
All water samples were turbid (Table 2) with earthy smell because surface water is open, always exposed to air, wind, soil and many other surrounding environmental conditions. The maximum turbidity was 582 FTU in sample, L-2. Some construction activity was going on at the site. The lower value of turbidity was 375 FTU in sample, L-7. High value of turbidity and suspended solids leads to the development of sludge deposits at the bottom. Favorable anaerobic conditions exist when industrial or domestic wastewater is discharged into an aquatic environment. Temperature fluctuates in the range of 20.1-33.5
°C. An increase by 13.4
°C was observed over the time period of one year. Electric conductivity is the concentration of soluble solids in water. The valuedependent and the expected values at temperature 26.0, 27.0 and 28.0 °C are 7.99, 7.86 and 7.75 mg/L oxygen respectively [14]. In all samples, the dissolved oxygen level was quite satisfactory, minimum value was 6.0 mg/L in sample, L- 11 and maximum 7.1 mg/L in sample, L-1, L-5 and L-7. The low level of DO indicates the widespread sewage pollution (Fig. 1).
Figure-1. Shows the trend of DO of canal water sample.
The amount of TDS and TSS at various sampling sites are given in (Table 2). Upper and lower value of TDS was 150 mg/L and 278 mg/L. The concentration of TDS is considerably low while suspended solids were high 584 mg/L in sample L- 12 and lower 380 mg/L in sample- 7. The value increases gradually as the canal passes through the city indicated that the effluent from residential / small, local, industrial areas contain insoluble form rather in dissolved form. Approximately 75% of the municipal suspended solids are organic in nature and nearly half are settleable solids [15]. The Environment protection criterion (EPA) states that solids should not reduce the depth of compensation point (penetration of sunlight) for photosynthetic activity by more than 10 % from the seasonally established norm for aquatic life [16].
Table-2. Pollution profile in Lahore Branch canal- ThePhysical parameters
Parameters Lahore Branch
Canal Sampling Sites
Turbidity (FTU)
TSS mg/L
TDS mg/L
Settable solids mg/L
Dissolved Oxygen mg/L
PH
NEQS (mg/ L) - 150 3500 - - 6.5-8.5
L-1 3871.83 388 1.51 165.01.28 54.0 1.22 7.1 1.46 7.761.08 L-2 5821.39 541 2.30 180.01.26 61 1.48 7.0 1.2 7.741.07 L-3 4181.0 423 1.5 278.02.75 75.0 1.71 6.92 1.09 7.691.11 L-4 3841.6 420 1.25 255.01.56 59.0 2.43 7.01.27 7.451.14 L-5 5131.14 510 1.17 190.01.85 63.0 2.11 7.1 1.36 7.531.41 L-6 4931.07 493 1.52 172.02.82 58.0 2.41 6.9 1.41 7.631.13 L-7 3751.34 380 2.44 168.01.61 52.0 2.35 7.1 1.15 7.541.36 L-8 5061.09 500 1.23 165.0.1.76 59.0 2.23 6.8 1.46 7.591.11 L-9 4151.22 418 2.7 174.02.32 49.0 2.22 7.0 1.17 7.661.36 L-10 4451.70 437 2.41 150.01.71 58.0 1.71 6.7 1.09 7.611.8 L-11 5201.83 511 1.16 168.01.16 54.0 1.9 6.0 1.21 7.671.07 L-12 5391.94 5842..46 164.01.61 63.0 1.84 6.15 1.23 7.621.32
Inorganic parameters
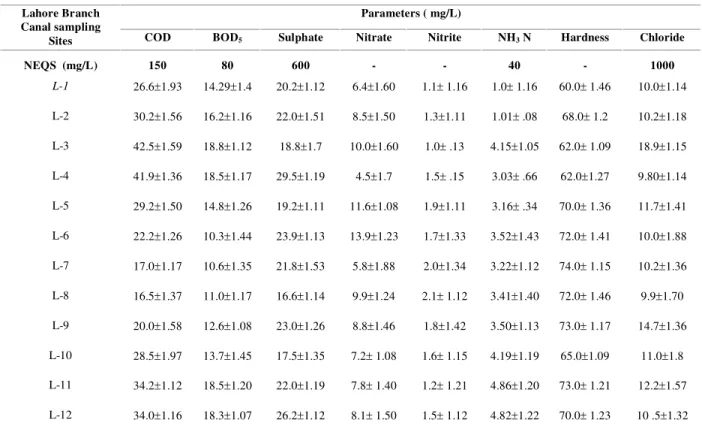
Lowcations and anions in canal water are due to continuous flow and water dilution. In table-3, chloride content in sample, L-3 was 18.9 mg/L. Total hardness is an index of the geological structure of the area from where the surface and ground water comes. Water hardness was found to be same in both samples, L-9 and L-11 contains 73.0 mg/L. The sulphate concentration accounts for the major part of non-carbonate hardness [17].
It is non-absorbable and was very small in all water samples in the range of 16.6-29.5 mg/L.
Ammonia is produced by the hydrolysis of urea, biological degradation of organic compounds, use of nitrate in agriculture and chemical effluent being discharged by the industries. Variation of COD at all twelve sites is shown in (Table 3). Its
range was 16.5 to 42.5 mg/L. The variation of BOD at all sampling sites was between 10.3-18.8 mg/L indicating the presence of some organic pollution. The environmentally acceptable level of BOD5 prevails in canal i.e. < 50 mg/L.
Table 3. Pollution profile in Lahore Branch Canal-Inorganic constituents.
Parameters ( mg/L) Lahore Branch
Canal sampling
Sites COD BOD5 Sulphate Nitrate Nitrite NH3 N Hardness Chloride
NEQS (mg/L) 150 80 600 - - 40 - 1000
L-1 26.61.93 14.291.4 20.21.12 6.41.60 1.1 1.16 1.0 1.16 60.0 1.46 10.01.14
L-2 30.21.56 16.21.16 22.01.51 8.51.50 1.31.11 1.01 .08 68.0 1.2 10.21.18
L-3 42.51.59 18.81.12 18.81.7 10.01.60 1.0 .13 4.151.05 62.0 1.09 18.91.15
L-4 41.91.36 18.51.17 29.51.19 4.51.7 1.5 .15 3.03 .66 62.01.27 9.801.14
L-5 29.21.50 14.81.26 19.21.11 11.61.08 1.91.11 3.16 .34 70.0 1.36 11.71.41
L-6 22.21.26 10.31.44 23.91.13 13.91.23 1.71.33 3.521.43 72.0 1.41 10.01.88
L-7 17.01.17 10.61.35 21.81.53 5.81.88 2.01.34 3.221.12 74.0 1.15 10.21.36
L-8 16.51.37 11.01.17 16.61.14 9.91.24 2.1 1.12 3.411.40 72.0 1.46 9.91.70
L-9 20.01.58 12.61.08 23.01.26 8.81.46 1.81.42 3.501.13 73.0 1.17 14.71.36
L-10 28.51.97 13.71.45 17.51.35 7.2 1.08 1.6 1.15 4.191.19 65.01.09 11.01.8
L-11 34.21.12 18.51.20 22.01.19 7.8 1.40 1.2 1.21 4.861.20 73.0 1.21 12.21.57
L-12 34.01.16 18.31.07 26.21.12 8.1 1.50 1.5 1.12 4.821.22 70.0 1.23 10 .51.32
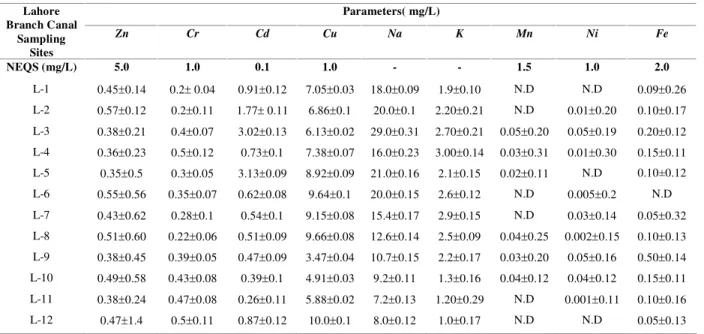
Metal contents
Excess quantities of major dissolved ions are responsible for salinization of the soil. Sodium is particularly dangerous when used to irrigate heavy clay soils since it reduces the stability of the soil particles and causes physical degradation, which is known as sodicity. Calcium and magnesium counteract sodicity in case of water use for irrigation [18]. In (Table 4), Sodium and potassium concentration were very small in all canal water samples. The maximum sodium was 29.0 mg/L in sample L- 3. Potassium was found to be very low in the range of 1.0-3.0 mg/L. Nickel was absent in sample L-1, L-5 and L-12. In sample L-3, nickel construction was 0.05 mg/L. At sampling sites L-8, L-9 and L-10 few industries were located so the presence of nickel was conformed as shown in Table-4 but its
concentration was less than recommended FAO value. Zinc is an essential trace metal for plant growth. Zinc was present in all samples. For zinc, no health based guideline value has been proposed but at lower pH, zinc seems to become mobile in sandy aquifer. The presence of copper in canal water was due to percolation of some industrial wastewater. In all canal water samples, copper was high in concentration than the recommended FAO level. Maximum was 10 mg/L in sample L-12 and low in samples L-9, 3.47 mg/L.
Table 4. Pollution profile in Lahore branch canal- metal constituents.
canal water varies between 0.2 -0.5 mg/L level throughout the year. Chromium is not generally recognized as an essential growth element but it was above the limit. Cadmium is toxic to beans, beets and turnips at concentration as low as 0.1 mg/L in nutrient solutions [2]. In all canal water samples, cadmium was above the FAO limit. The maximum level of cadmium was 3.13 mg/L in sample L-5 while the lower value was 0.26 in sample L-11. Manganese was under limit in all canal water samples.
Conclusion
From the physicochemical study of canal water, the pollution level in Lahore branch canal was not very high except high turbidity and cadmium. The turbid water interferes with the recreational use and the esthetic enjoyment. It can also affect the skin of sensitive people swimming in summer. The rain in monsoon season diluted the more critical contamination in the canal water, thus decreases the pollution effect.
Even then it is advisable to take precautionary measures by the competent authority taking into consideration the anti degradation policy which provides some suggestions for protection in its use for the required purpose.
The city district government must consider and prohibited the people living around not to throw wastes, rubbish, sewer and solid waste directly into the canal in order to sustain the beauty, recreational activity the irrigation water standards because it is a good source of irrigation and gardening in district of Lahore and Kasur.
Acknowledgement
The authors thank Pakistan Council of Scientific and Industrial Research (PCSIR) laboratories Lahore for providing services for this research.
References
1. N. Ahmad and G. R. Chaudhry, Irrigated Agriculture of Pakistan Lahore, (1986). 2. WWF – Pakistan, Irrigation water quality
guidelines for Pakistan, Feb, (2007).
3. I. Ahmad, Studues on the lined B.R.B.D (Bombanwala Ravi Bedian depalpur) link canal causes of its deterioration and the remedial measures (Irrigation central region, Lahore), (1978).
4. M. A. Saleemi, Environmental assessment and management or irrigation and drainage schemes for sustainable agricultural growth.
Parameters( mg/L) Lahore
Branch Canal Sampling
Sites
Zn Cr Cd Cu Na K Mn Ni Fe
NEQS (mg/L) 5.0 1.0 0.1 1.0 - - 1.5 1.0 2.0
L-1 0.450.14 0.2 0.04 0.910.12 7.050.03 18.00.09 1.90.10 N.D N.D 0.090.26
L-2 0.570.12 0.20.11 1.77 0.11 6.860.1 20.00.1 2.200.21 N.D 0.010.20 0.100.17
L-3 0.380.21 0.40.07 3.020.13 6.130.02 29.00.31 2.700.21 0.050.20 0.050.19 0.200.12
L-4 0.360.23 0.50.12 0.730.1 7.380.07 16.00.23 3.000.14 0.030.31 0.010.30 0.150.11
L-5 0.350.5 0.30.05 3.130.09 8.920.09 21.00.16 2.10.15 0.020.11 N.D 0.10±0.12
L-6 0.550.56 0.350.07 0.620.08 9.640.1 20.00.15 2.60.12 N.D 0.0050.2 N.D
L-7 0.430.62 0.280.1 0.540.1 9.150.08 15.40.17 2.90.15 N.D 0.030.14 0.050.32
L-8 0.510.60 0.220.06 0.510.09 9.660.08 12.60.14 2.50.09 0.040.25 0.0020.15 0.100.13
L-9 0.380.45 0.390.05 0.470.09 3.470.04 10.70.15 2.20.17 0.030.20 0.050.16 0.500.14
L-10 0.490.58 0.430.08 0.390.1 4.910.03 9.20.11 1.30.16 0.040.12 0.040.12 0.150.11
L-11 0.380.24 0.470.08 0.260.11 5.880.02 7.20.13 1.200.29 N.D 0.0010.11 0.100.16
Proc. of the CEWRE Intl. Symp. Lahore, 1 (1993) 63.
5. W. J. Viessman and M. J. Hammer, Water Supply and Pollution Control, 7th edition, Pearson education, Inc. Vol. 3, 76 Anmol Publication New Delhi, (2005) 328.
6. M. H. S. Wattoo, F. H. Wattoo, T. G. Karzi, S. A. Tirmizi, M. I. Bhanger, R. B. Mahar and I. Javed, The Nucleous, 41 (2004) 69. 7. S. B. Masood, S. Kamran, E. Babar, Bajwa
and Aziz, Journal of Management Environmental Quality, 16 (2005).
8. N. Wajahat, P. Sajida and S. Asif, Evaluation of irrigation water for heavy metals of Akbar Pura area. J. Agri. Biol. Sci.,
1 (2006) 1.
9. A. Khan, M. Ibrahim, N. Ahmed and S. A. Anwar, Studies on accumulation and distribution of heavy metals in agricultural, soil receiving sewage effluent irrigation In proceedings of 4th National Congress of soil,
Sci. Soc. Pak; efficient use of plant nutrient, Islamabad, (1992) 607.
10. M. A. Khalown and A. D. Khan, Irrigation water quality manual. Pakistan Council of Research in Water Resources (PCRWR), Ministry of Science and Technology, Government of Pakistan, Islamabad, (2002). 11. H. William, American Official Methods of Analysis of Chemicals, (AOAC International), Agricultural chemicals, Contaminants, Drugs. 17th Edition, l.2 (2000).
12. M. C. Rand, A. E. Greenberg and M. J. Taras, Standard Method for the Examination of Water and Wastewater, APHA, AWWA, WPCF. American Public Health Association Inc., Washington DC, (2005).
13. R. K. Khitolya, Environmental Pollution, Management and Control for Sustainable Development. S. Chand Co. India, (2007). 14. Quality Criteria for water “Environmental
Protection Agency (EPA) Office of Water Regulations and Standards, EPA-440/5 86-001 (1986).
15. M. A. Khan and M. A. Khan, Impact of industrial discharge on Karachi coastal environment. In: Proc. Eight Stat. Sem, Karachi University. ISBN-969-8397-07-8, (2001) 205.
16. U. Forstner and G. T. W. Wittmann, Metal pollution in the aquatic environment. Springer – Verlag, Berlin, (1983) 486. 17. G. R. Chhatwal, “Encyclopedia of
Environmental Pollution and its control”,
Deptt. of Chem., Govt. Autonomous college, Satna India, (1982).