RESEARCH ARTICLE
In Situ
Staining and Laser Capture
Microdissection of Lymph Node Residing SIV
Gag-Specific CD8
+
T cells
—
A Tool to
Interrogate a Functional Immune Response
Ex Vivo
Annelie Tjernlund1
*, Adam Burgener1,2,3, Jessica M. Lindvall4, Tao Peng5,6, Jia Zhu5,7,
Lars Öhrmalm1, Louis J. Picker8, Kristina Broliden1, M. Juliana McElrath5, Lawrence Corey5,6,7
1Department of Medicine Solna, Unit of Infectious Diseases, Center for Molecular Medicine, Karolinska Institutet, Karolinska University Hospital, L8:01, 17176 Stockholm, Sweden,2National Laboratory for HIV Immunology, Public Health Agency of Canada, Winnipeg, Manitoba, Canada,3Department of Medical Microbiology, University of Manitoba, 730 William Ave. Winnipeg, MB, Canada,4Department of Biosciences and Nutrition, Karolinska Institutet, Karolinska University Hospital Huddinge, Huddinge, Stockholm, Sweden, 5Vaccine and Infectious Disease Division, Fred Hutchinson Cancer Research Center, Seattle, WA, United States of America,6Department of Medicine, University of Washington, Seattle, WA, United States of America,7Department of Laboratory Medicine, University of Washington, Seattle, WA, United States of America,8Department of Pathology, Vaccine and Gene Therapy Institute, and the Oregon National Primate Research Center, Oregon Health & Science University, Beaverton, OR, United States of America
Abstract
While a plethora of data describes the essential role of systemic CD8+T cells in the control
of SIV replication little is known about the localin situCD8+T cell immune responses
against SIV at the intact tissue level, due to technical limitations.In situstaining, using GagCM9 Qdot 655 multimers, were here combined with laser capture microdissection to detect and collect SIV Gag CM9 specific CD8+T cells in lymph node tissue from SIV infected rhesus macaques. CD8+T cells from SIV infected and uninfected rhesus
macaques were also collected and compared to the SIV GagCM9 specific CD8+T cells. Illu-mina bead array and transcriptional analyses were used to assess the transcriptional pro-files and the three different CD8+T cell populations displayed unique transcriptional patterns. This pilot study demonstrates that rapid and specific immunostaining combined with laser capture microdissection in concert with transcriptional profiling may be used to elucidate phenotypic differences between CD8+T cells in SIV infection. Such technologies may be useful to determine differences in functional activities of HIV/SIV specific T cells. OPEN ACCESS
Citation:Tjernlund A, Burgener A, Lindvall JM, Peng T, Zhu J, Öhrmalm L, et al. (2016)In SituStaining and Laser Capture Microdissection of Lymph Node Residing SIV Gag-Specific CD8+T cells
—A Tool to Interrogate a Functional Immune ResponseEx Vivo. PLoS ONE 11(3): e0149907. doi:10.1371/journal. pone.0149907
Editor:Zandrea Ambrose, University of Pittsburgh, UNITED STATES
Received:November 9, 2015
Accepted:February 5, 2016
Published:March 17, 2016
Copyright:© 2016 Tjernlund et al. This is an open access article distributed under the terms of the Creative Commons Attribution License, which permits unrestricted use, distribution, and reproduction in any medium, provided the original author and source are credited.
Data Availability Statement:All relevant data are within the paper and in its Supporting Information files.
Introduction
Replication of human immunodeficiency virus (HIV) and simian immunodeficiency virus (SIV), the simian equivalent of HIV, is highly variable, as is the host immune response to the infection. Differences in host genetics and adaptive immunity influence the clinical course and progression of the infection. However, CD8+T cells, in particular, may play a pivotal role in controlling both HIV and SIV replication [1–11]. For example, slow progression of HIV/SIV infection is associated with the ability to mount a diverse CD8+T cell restricted response (HLA/MHC class I restricted response) [12]. Humans that have an overrepresentation of HLA-B27, HLA-B57 or HLA-B28 alleles and rhesus macaques (RMs) that have an
overrep-resentation of Mamu-A01, Mamu-B08, or Mamu-B17 alleles are associated with a slow
HIV/SIV disease progression [12]. CD8+T cell responses to specific epitopes are associated with slower progression rates, but not all HIV/SIV specific CD8+T cells are uniformly capable
of preventing HIV/SIV replication [2,13]. GagCM9 is an immunodominant cytotoxic CD8+T cell epitope, which is restricted by the Mamu A01 allele, and is well characterized in
non-human primate (NHP) models, both in SIV infection and SIV vaccine models [12,14–16]. GagCM9 specific CD8+T cells are suggested to have multifunctional capacity (e.g. degranulate
and produce several cytokines at the same time) as well as having access to lymphoid tissues where the primary sites of viral replication occur [17,18].
While a plethora of data describes the essential role of systemic CD8+T cells in the control of HIV/SIV replication, little is known about the localin situCD8+T cell immune responses against HIV/SIV at the intact tissue level [17–19]. Since the distribution and function of immune cells naturally differ between blood, secretions and tissue sites, it is important to study the immune response in these compartments. Furthermore, since HIV/SIV predomi-nantly replicate in lymphoid tissue it is of major importance to study thein situimmune response, including the CD8+T cell response, against HIV/SIV directly in these tissues [20– 26]. We have previously shown that it is possible to detect GagCM9 specific CD8+T cells in
cryopreserved lymphoid tissue from chronically SIV infected RMs with the use of GagCM9 Qdot 655 multimers (Qdot 655 conjugated with the Mamu-A01 MHC Class I allele loaded
with the SIVmac239 peptide Gag181-189CM9; Gag CM9) [27]. This report describes a pilot
study to evaluate the use of these Gag CM9 Qdot 655 multimers forin situstaining followed by laser capture microdissection (LCM) and the subsequent gene transcriptional profiles of these cell populations.
Materials and Methods
Animals, Specimen collection and Ethical statement
Submandibular and mesenteric lymph nodes biopsies were obtained from four purpose-bred RMs (Macaca mulatta) of Indian genetic background; three of the RMs were chronically
SIV-mac239 infected Mamu-A01 positive RMs (animal A, B and C) and one RM were
Mamu-A01 negative, SIV uninfected RM (animal D). SIVmac239 infections were initiated with
intra-venous injection of 5 ng equivalents of SIV p27. The lymph nodes biopsies used in this study were obtained at necropsy (77–85 days post infection), collected by clinical veterinarians. The plasma viral load and the SIV RNA content within the lymph nodes of the three SIV infected RMs, at time of necropsy has been described previously [27]. Shortly, plasma viral load for ani-mal A was 3.3 x 10⁶, for animal B it was<30, and for animal C it was 50 SIV RNA copy/ml plasma. The SIV RNA content in the submandibular lymph nodes for animal A was 29, for ani-mal B it was 28, and for aniani-mal C it was120 RNA copies/250 ng total RNA. The SIV RNA con-tent in the mesenteric lymph nodes for animal A was 9 736, for animal B it was 324, and for
Against HIV and SIV Infection”,http://www. gatesfoundation.org/(M.J.M.) and National Institutes of Health grant R01 AI-42528 and PO1 AI-30731, http://www.nih.gov/(L.C.). The funders had no role in study design, data collection and analysis, decision to publish, or preparation of the manuscript.
animal C it was 7 RNA copies/250 ng total RNA. The biopsies were snap frozen in OCT media (Sakura Finetek USA Inc. Torrance, CA) and kept at -80°C until sectioning.
Specimens from animal A, B and C were obtained from the Oregon National Primate Research Center (Beaverton, OR) (IACUC ID: 0569 and 0631). Specimens from animal D were obtained from the Washington National Primate Research Center at the University of Washing-ton (Seattle, WA), NIH grant RR00166 and from the National Center for Research Resources and the Office of Research Infrastructure Programs (ORIP) of the National Institutes of Health through Grant Number P51 OD 010425 (IACUC ID: 4140–01; Tissue Distribution Program). The study protocols were approved by the Oregon National Primate Research Center’s and the University of Washington Institutional Animal Care and Use Committee (with membership constituted to comply with NIH policy and Animal Welfare Act regulations) under the NIH Office for Laboratory Animal Welfare. The RMs were housed and cared in accordance with stan-dards of the US National Institutes of Health Guide for the Care and Use of Laboratory Animals [28]. The RMs were housed in indoor or indoor-outdoor facilities with twice-daily collection of waste pans, in cages that were sanitized in a central cage washer at least every 2 weeks. They were fed with commercially prepared primate feed milled, supplemented daily with fruits. Fresh pota-ble water was provided by the municipal water district via automatic water systems. Environmen-tal enrichments were provided (toys and a variety of complex foraging devices). The macaques were observed for species-specific behaviors, food and water consumption, and urine and feces production for reporting of abnormalities to the attending veterinarian. All animals were evalu-ated for clinical signs of disease on a daily basis and a clinical veterinarian was responsible for determining if an animal was experiencing any pain or suffering. The animals were euthanized humanely by an overdose of anesthetic (e.g.>50 mg/kg sodium pentobarbital and exsanguinated via the distal aorta) after completion of the experiments.
Synthesis of Gag CM9-Qdot 655 multimers
Qdot 655-conjugated peptide–MHC multimers were formedin vitroas previously described [27,29]. Briefly, biotinylated Mamu-A01/β
2m/peptide monomers were produced with the
known Mamu-A01-restricted SIVmac239 peptide Gag
181-189CM9 (CTPYDINQM: Gag CM9)
[14]. Streptavidin-coated Qdot 655 (Life Technologies/Invitrogen, Eugene, OR) were conju-gated with a saturating amount of biotinylated Mamu-A01/β
2m/peptide monomers.
Laser capture microdissection of individual cells followed by RNA
extraction, cDNA amplification and hybridization to Illumina bead arrays
A rapid immunofluorescent staining method was used to detect SIVGag CM9 specific CD8+ cells in lymph node tissue from chronically SIV infected RMs (GagCM9+cellsSIV+RMs), as well
as CD8+cells from chronically SIV infected RMs (CD8+cellsSIV+RMs) and CD8+cells from
uninfected RMs (CD8+cellsSIV-RMs). The method was modified from a previous published
pro-tocol [27], by using a five-times higher concentration of the GagCM9 Qdot 655 multimer and a ten-times higher concentration of the anti-CD8 antibody. Thereby shorter staining procedure could be achieved to minimize/reduce any potential interaction of RNase activity while pre-serving the staining intensity. Eight-μm thick sections of the lymph nodes biopsies were
mounted on polyethylene naphthalate membrane slide (Carl Zeiss, Thornwood, NY) followed by the addition of the GagCM9-Qdot 655 multimers or Alexa-647 conjugated CD8 anti-body (RPA-T8, BD Biosciences, San Diego, CA) for 5 min. The sections were thereafter washed in ice-cold PBS, fixed and dried with ethanol (75%, 95% 100%) and Xylene. The sections were also kept on ice throughout the whole staining procedure to avoid RNA degradation and the staining was performed during less than 15 min. The GagCM9+cellsSIV+RMs, CD8+cellsSIV+RMs
and CD8+cellsSIV-RMswere visualized and laser microdissected with the use of the Zeiss PALM
Microbeam instrument (Carl Zeiss) as previously described [30,31]. Shortly, a microbeam was used to cut and catapult approximately 100 individual cells, of each specificity, to the desig-nated tube located above the tissue section. Thereafter RNA was extracted from the pooled cap-tured GagCM9+cellsSIV+RMs, CD8+cellsSIV+RMsand CD8+cellsSIV-RM,respectively followed by
cDNA amplification and hybridization to Illumina bead arrays as previously described [30,
31]. Briefly, RNA was extracted from the captured cells using Arcturus PicoPure RNA Isolation Kits (Life Technologies/Invitrogen) and quantified with the use of a NanoDrop 1000 Spect-ometer. One nanogram of total RNA was converted to cDNA and amplified through whole-transcriptome amplification using WT-Ovation Pico RNA Amplification System (NuGEN, San Carlos, CA). Thereafter the cDNA was biotinylated according to the NuGEN protocol and 750 ng of labeled cDNA was hybridized to Illumina Human Ref8 v3 bead arrays in the Shared Resources at Fred Hutchinson Cancer Research Center in Seattle, WA.
Quantitative PCR
TaqMan quantitative real time PCR (qRT-PCR) assay was performed as previously described [30]. Primer and probe sets (Applied Biosystems, Foster City, CA) were used to detect, amplify and quantifyβ-actin and CD8A genes. Each sample was run in duplicate and the Ct values for each target gene were normalized toβ-actin by using the 2-dCTequation.
Statistical analysis and hierarchical clustering of microarray data
Illumina Ref8 v3 bead-arrays were processed using Illumina GenomeStudio software and quan-tile normalized according to the software praxis. Data was then exported and further processed using third party software’s. Probes without an EntrezID were removed, providing 24,487 probes for further analysis. Gene expression was log2transformed to the mean expression value across
all samples. To maximize power to detect statistical differences between GagCM9+cellsSIV+RMs,
CD8+cells
SIV+RMsand CD8+cellsSIV-RMsthe log-normalized data from the two different lymph
nodes (submandibular and mesenteric) were averaged for differential expression analysis. The mean expression value of each cell population (GagCM9+cells
SIV+RMs, CD8+cellsSIV+RMsand
CD8+cellsSIV-RMs), within each animal (A, B, C and D), was then calculated. Independent sample
t-tests (Kruskal-Wallis) were used to detect significant differences between groups. Clustering of genes was generated by unsupervised average linkage hierarchical clustering using Pearson corre-lation coefficient as the distance metric as described previously [32].
Results
Laser capture microdissection of GagCM9
+cells
SIV+RMs, CD8
+cells
SIV+RMsand CD8
+cells
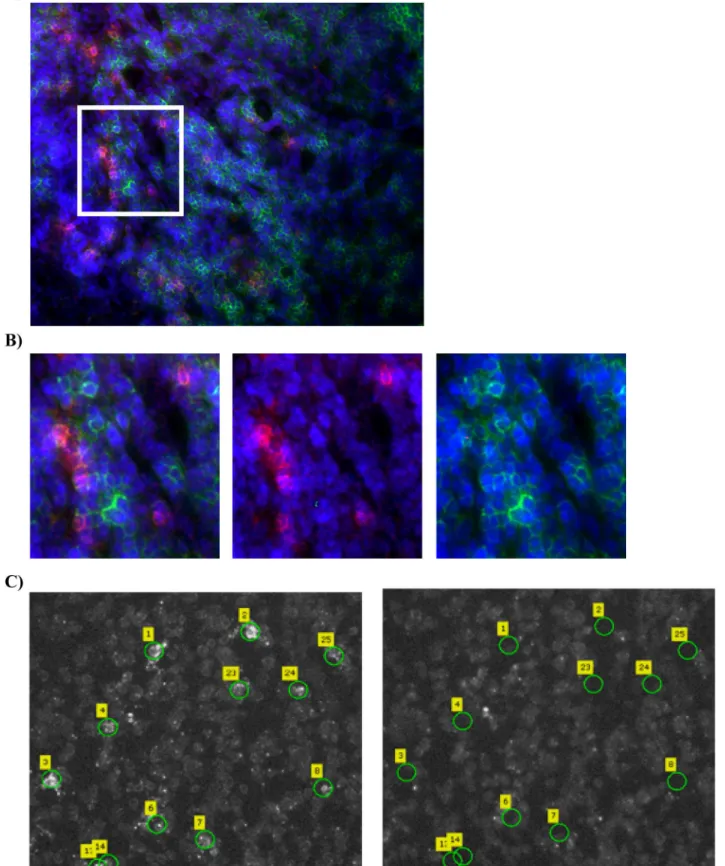
SIV-RMsA rapid immunofluorescent staining combined with LCM was used to detect and collect GagCM9+cellsSIV+RMs, CD8+cellsSIV+RMsand CD8+cellsSIV-RMsin cryopreserved tissue sections
of lymph nodes obtained from chronically SIV infected and uninfected RMs (Fig 1). We used adjacent tissue sections of lymph node biopsies, which we have previously shown to contain GagCM9 specific CD8+T cells (median 4.5%; range 3.3–6.5% GagCM9+cells out of all CD8+T cells) [27], which made it possible to laser-capture microdissect 100 GagCM9+cellsSIV+RMsper
Fig 1. Laser capture microdissection of GagCM9+cells
SIV+RMs, CD8+cellsSIV+RMsand CD8+cellsSIV-RMs. A)Fluorescence images of lymph node tissue sections from an SIV infected RM stained with GagCM9 Qdot 655 multimer (red), CD8 (green) and dapi (blue) showing the abundance of GagCM9+cells.B) A magnified view of the region indicated in panel A, demonstrating that the GagCM9+cells
of 5 samples of CD8+cells
SIV+RMsand 1 out of 2 samples of CD8+cellsSIV-RMs). CD8A, as well
asβ-actin (internal control), were detected in all the eight samples assessed (data not shown).
Gene transcription expression profiles of GagCM9
+cells
SIV+RMsand
CD8
+cells
SIV+RMsvs. CD8
+cells
SIV-RMscells by laser capture
microdissection
The Illumina Human Ref8 v3 bead arrays were used to compare the gene expression profiles between GagCM9+cellsSIV+RMs, CD8+cellsSIV+RMsand CD8+cellsSIV-RMs. Although underpowered
for this purpose with a small animal population size, we reasoned that gene transcriptional profiles may be distinguishable between cell population subsets. Data was quantile normalized (Fig 2A) and genes expression differences compared by t-test between GagCM9+cellsSIV+RMswith
CD8+cellsSIV-RMsor CD8+cellsSIV+RMswith CD8+cellsSIV-RMsfollowed by fold change (FC)
calcula-tions. A positive correlation of gene expression differences was observed (r2= 0.70), indicating a
similarity of gene expression changes for the GagCM9+cellsSIV+RMsand for the CD8+cellsSIV+RMs
relative to the uninfected control (e.g. CD8+cellsSIV-RMs). A relative even distribution of
overex-pressed and underexoverex-pressed genes was observed between GagCM9+cellsSIV+RMsand the CD8+ cells-SIV+RMsas compared to CD8+cellsSIV-RMs(Fig 2B). This suggests that GagCM9+cellsSIV+RMsand
CD8+cellsSIV+RMslocated in the lymph nodes of chronically infected RMs show a similar gene
expression trend as compared to CD8+cells
SIV-RMslocated in lymph nodes of uninfected RMs.
Using a cutoff threshold of p<0.05, one tenth out of total of 24,487 genes, (2,346 genes; 9.6%) met this significance cutoff threshold when compared to controls (e.g. also differentially expressed to that of CD8+cellsSIV-RMscontrol in at least one comparison). This suggests that
these genes may be altered due to SIV infection, although as none of these genes met multiple-comparison correction thresholds we cannot discount the possibility of random variation. A Venn diagram illustrates the differences and overlap of the differentially expressed genes (Fig 2C). GagCM9+cellsSIV+RMsvs. CD8+cellsSIV+RMs(blue circle) revealed the lowest numbers of
differentially expressed genes (959 genes: 491 UP, 468 DOWN) while GagCM9+cellsSIV+RMsvs.
CD8+cellsSIV-RMs(red circle) reveled the highest numbers of differentially expressed genes
(1383 genes: 734 UP, 649 DOWN) followed by the comparison between CD8+cells
SIV+RMsvs.
CD8+cellsSIV-RM(green circle) (1297 genes: 652 UP, 645 DOWN). Although not statistically
powered, this may indicate that the two CD8+cell populations within the SIV infected RMs are more similar to each other as compared to the CD8+cell populations from SIV infected vs. uninfected RMs. Additionally, 183 genes were shared between the comparison of GagCM9 +-cellsSIV+RMsvs. CD8+cellsSIV+RMsand GagCM9+cellsSIV+RMsvs. CD8+cellsSIV-RMs; 166 genes
were shared between the comparison of GagCM9+cellsSIV+RMsvs. CD8+cellsSIV+RMsand CD8+
cellsSIV+RMsvs. CD8+cellsSIV-RMs; 334 genes were shared between the comparison of GagCM9
+-cellsSIV+RMsvs. CD8+cellsSIV-RMsand CD8+cellsSIV+RMsvs. CD8+cellsSIV-RMs;and 47 genes
were shared between all three comparisons.
Hierarchical clustering analysis distinguishes GagCM9
+cells
SIV+RMsand
CD8
+cells
SIV+RMsof infected RMs from CD8
+cells
SIV-RMsof uninfected RM
Hierarchical clustering was performed to better visualize transcriptional profiles of GagCM9 +-cellsSIV+RMs, CD8+cellsSIV+RMsand CD8+cellsSIV-RMs. The genes that met a +/- 0.4 log2-FC
sections from an SIV infected RM stained with CM9 Qdot 655 multimer to detect GagCM9+cellsSIV+RMs. The left images show the tissue section with the
selected GagCM9+cells
SIV+RMsprior to LCM and the images to the right show the same tissue section after the selected cells have been microdissected and
collected.
(p<0.05) were used to minimize cluster vertical sizing. This resulted in 84, 200 and 182 differ-ently expressed genes when comparing GagCM9+cellsSIV+RMsvs. CD8+cellsSIV+RMs(negative
control filtered, e.g. only those genes in context of SIV infection that were significantly different in at least one comparison), GagCM9+cellsSIV+RMsvs. CD8+cellsSIV-RMs, and CD8+cellsSIV+RMs
vs. CD8+cellsSIV-RMs, respectively (S1–S3Tables). The heat map of the differentially expressed
genes from GagCM9+cellsSIV+RMsvs. genes from CD8+cellsSIV+RMsclearly discriminated
between these two cell populations, showing both upregulated (51%) and downregulated (49%) gene clusters (Fig 3A). Next, when comparing the differentially expressed genes from GagCM9+cells
SIV+RMsvs. genes from the CD8+cellsSIV-RMs33% of the genes were upregulated
and 67% of the genes were downregulated (Fig 3B). A similar pattern was also seen when com-paring the differentially expressed genes from CD8+cellsSIV+RMsas compared to the genes from
the CD8+cellsSIV-RMs; 40% of the genes were upregulated and 60% were downregulated (Fig
3C). Furthermore, the transcriptional profile of GagCM9+cellsSIV+RMsvs. CD8+cellsSIV+RMs
was distinguished from the other two comparisons (GagCM9+cellsSIV+RMsand CD8+cellsSIV +RMsvs. CD8+cellsSIV-RMs), which were more comparable to each other. These data suggests
that our methods can be utilized to dissect transcriptional profiling of different CD8+cell pop-ulations within differing microenvironments.
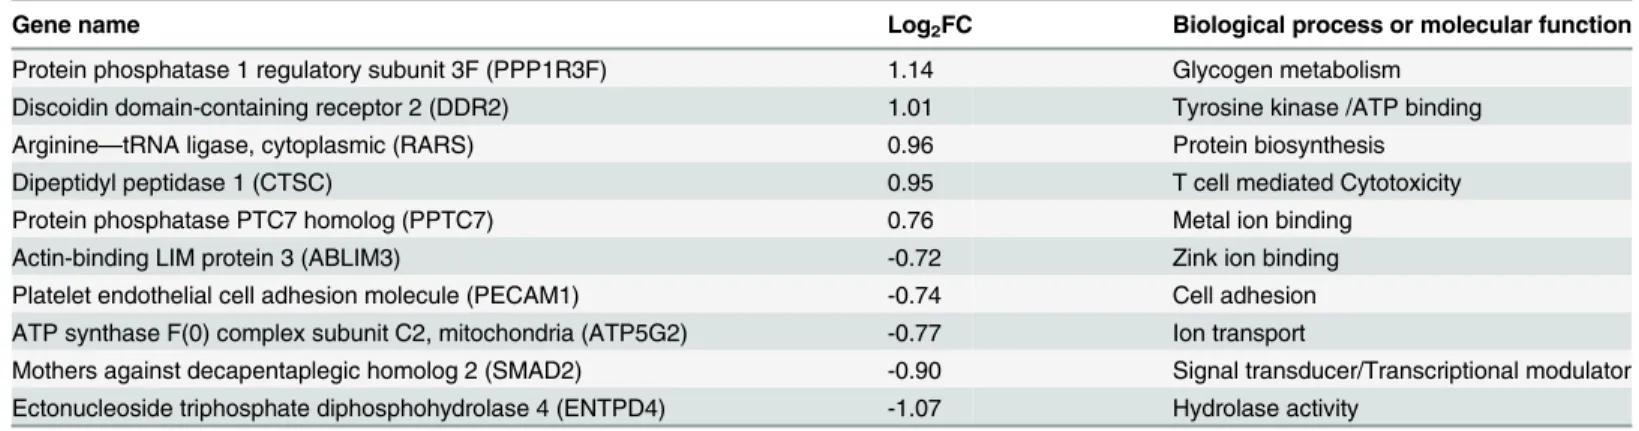
We classified the top five up- and downregulated differentially expressed genes based on FC value (p<0.05) into functional categories based on gene ontology/annotations (http://www.
uniprot.org). Interestingly, one of the five-upregulated genes identified when comparing GagCM9+cellsSIV+RMsvs. CD8+cellsSIV+RMswas Cathepsin C (CTSC), a gene associated with
CD8+T cell mediated immune responses (e.g.“T cell mediated cytotoxicity”). Furthermore, one of the downregulated genes was Mothers against decapentaplegic homolog 2 (SMAD2), a signal transducer that is activated by TGFβand plays and important role in apoptosis. The other up- and downregulated genes were associated with general functions such as metabolism, biosynthesis, transcription, ion transport and ion binding (Table 1andFig 4A). In addition, two of the most strongly downregulated genes (AIMP2/JTV1 and CXCR4) identified when comparing GagCM9+cellsSIV+RMsvs. CD8+cellsSIV-RMsalso play roles in apoptosis. The other
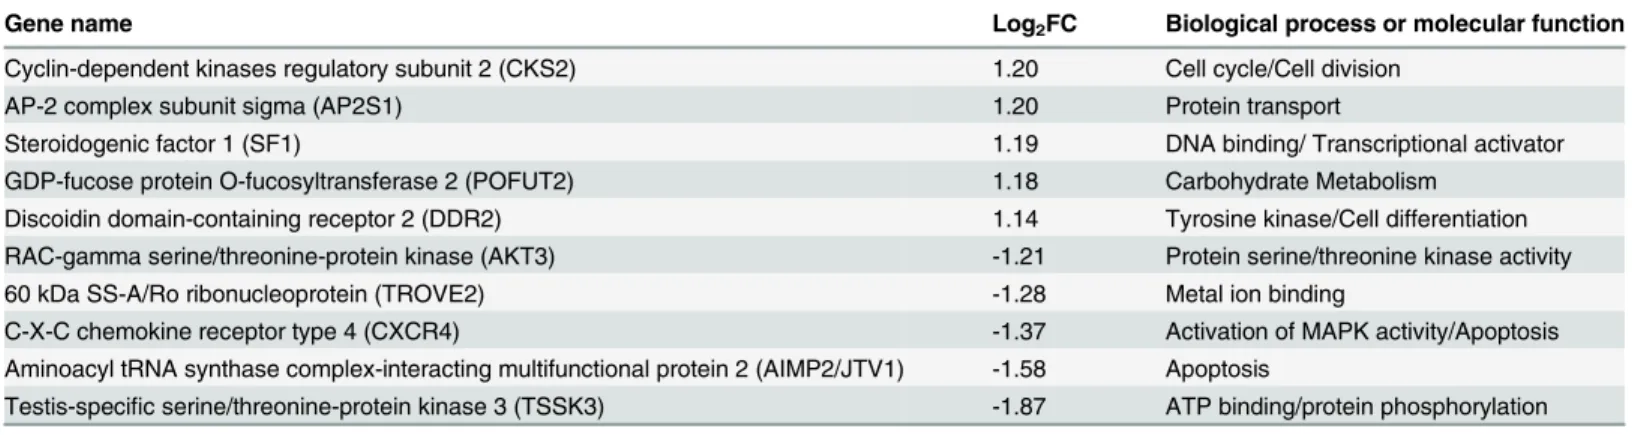
up and downregulated genes in this comparison were associated with general functions (e.g. protein transport, DNA binding, metabolism, cell signaling and ion binding) (Table 2andFig 4B). Finally, when comparing CD8+cellsSIV+RMsvs. CD8+cellsSIV-RMs, CD8A was upregulated
and AIMP2/JTV1 was downregulated (apoptosis-associated gene also downregulated between GagCM9+cellsSIV+RMsvs. CD8+cellsSIV-RMs). The other up and downregulated genes were
asso-ciated with functions such as protein transport, transcription, cell signaling and actin binding) (Table 3).
Discussion
We have previously reported that the Gag CM9 Qdot 655 multimers can be used to detect SIV GagCM9+cells in cryopreserved tissue and that the frequency of these cells, as detected by imaging analysis, was similar as the frequency detected by flow cytometry of single cell
Fig 2. Comparison of gene expression profiles between GagCM9+cells
SIV+RMsand in CD8+cellsSIV+RMsvs. CD8+cellsSIV-RMs. A)The graph shows the distribution and median of the averaged transformed Log2gene expression showing that the overall gene expression intensity by animal and sample type is
similar in all groups.B)The graph shows a positive correlation (r2= 0.70) of gene expression differences between GagCM9+cells
SIV+RMs(Y-axis) and
CD8+cells
SIV+RMs(X-axis) relative to CD8+cellsSIV-RMs. Genes were filtered by those differentially expressed genes found when comparing GagCM9+cellsSIV +RMswith CD8+cellsSIV-RMsor CD8+cellsSIV+RMswith CD8+cellsSIV-RMsfollowed by FC calculations. The blue filled circles symbolize the differently expressed
genes in at least one comparison between GagCM9+cells
SIV+RMsand CD8+cellsSIV+RMsto that of CD8+cellsSIV-RMscontrol (p<0.05).C)The Venn diagram
illustrates how the 2346 genes, which were significantly altered by SIV infection (based on a significance cutoff threshold of p<0.05) overlap between the
three comparisons; GagCM9+cellsSIV+RMsvs. CD8+cellsSIV+RMs, (blue circle); GagCM9+cellsSIV+RMsvs. CD8+cellsSIV-RMs(red circle); CD8+cellsSIV+RMsvs.
CD8+cells
SIV-RMs(green circle).
Fig 3. Heat map analysis of GagCM9+cells
SIV+RMs, CD8+cellsSIV+RMsand CD8+cellsSIV-RMs.The heat map shows discrimination of the gene profiles ofA) GagCM9+cells
suspensions [27]. In this study we have demonstrated, for the first time to our knowledge, that it is possible to detect and laser-capture microdissect GagCM9+cellsSIV+RMs, CD8+cellsSIV+RMs
and CD8+cells
SIV-RMsfrom intact cryopreserved lymph node tissue sections of SIV infected
and uninfected RMs with the use of these Gag CM9 Qdot 655 multimers and CD8 anti-bodies. Additionally, the RNA obtained from the laser-capture microdissected CD8+T cell
populations could further be used to characterize their gene transcriptional profile via gene expression array analysis.
The GagCM9+cellsSIV+RMsand the CD8+cellsSIV+RMsdisplayed a relative even distribution
of overexpressed and underexpressed genes as compared to CD8+cells
SIV-RMs. Furthermore,
the two CD8+T cell populations within the SIV infected RMs were more similar to each other as compared to the CD8+T cell populations from SIV infected vs. uninfected RMs. Thus, the
lowest numbers of differentially expressed genes were detected in the comparison between GagCM9+cells
SIV+RMsvs. CD8+cellsSIV+RMs, while GagCM9+cellsSIV+RMsvs. CD8+cellsSIV-RMs
had the highest numbers of differentially expressed genes followed by the comparison between CD8+cells
SIV+RMsvs. CD8+cellsSIV-RM. Hierarchical clustering and heat maps were next used
to visualize the differences in transcriptional profiles of these three enriched CD8+T cell popu-lations. The differentially expressed genes from GagCM9+cells
SIV+RMsvs. genes from
CD8+cellsSIV+RMswere clearly distinguished and revealed that approximately half of the
differ-entially expressed genes were upregulated and the other half was down regulated. Furthermore, the heat maps of GagCM9+cellsSIV+RMsvs. CD8+cellsSIV-RMsand CD8+cellsSIV+RMsvs.
CD8+cells
SIV-RMsshowed a similar gene expression pattern; again indicating the relatively even
distribution of overexpressed and underexpressed genes between GagCM9+cellsSIV+RMsand
the CD8+cells
SIV+RMsrelative to CD8+cellsSIV-RMs.Taken together, our data show that the
methods used allow us to discriminate between the three different CD8+T cell populations which display both distinct and unique genes. Thus, the transcriptional profile of SIV Gag spe-cific CD8+T cells (GagCM9+cellsSIV+RMs) was clearly distinguished from the other CD8+T
cells residing in lymph nodes of SIV infected RMs (e.g. CD8+cells
SIV+RMs). However, since
these CD8+T cells were only selected based on their expression of CD8, we cannot rule out that some of the CD8+cells
SIV+RMsmay also be SIV specific CD8+T cells restricted by other
than the Mamu-A01 allele. The RMs included in this study were only genotyped for
Mamu-sample t-tests (Kruskal-Wallis) were used to detect significant differences between groups. Clustering of genes was generated by unsupervised centroid linkage hierarchical clustering using Pearson correlation coefficient as the distance metric. Gene expression levels are shown in color, with red indicating over-abundant expression and blue indicating under-abundant expression.
doi:10.1371/journal.pone.0149907.g003
Table 1. The top 10 differentially over/under-expressed genes between GagCM9+cells
SIV+RMsvs. CD8+cellsSIV+RMs.
Gene name Log2FC Biological process or molecular function
Protein phosphatase 1 regulatory subunit 3F (PPP1R3F) 1.14 Glycogen metabolism Discoidin domain-containing receptor 2 (DDR2) 1.01 Tyrosine kinase /ATP binding
Arginine—tRNA ligase, cytoplasmic (RARS) 0.96 Protein biosynthesis
Dipeptidyl peptidase 1 (CTSC) 0.95 T cell mediated Cytotoxicity
Protein phosphatase PTC7 homolog (PPTC7) 0.76 Metal ion binding
Actin-binding LIM protein 3 (ABLIM3) -0.72 Zink ion binding
Platelet endothelial cell adhesion molecule (PECAM1) -0.74 Cell adhesion ATP synthase F(0) complex subunit C2, mitochondria (ATP5G2) -0.77 Ion transport
Mothers against decapentaplegic homolog 2 (SMAD2) -0.90 Signal transducer/Transcriptional modulator Ectonucleoside triphosphate diphosphohydrolase 4 (ENTPD4) -1.07 Hydrolase activity
A01, although RMs obviously can express a variety of Mamu-A and -B alleles [33,34].
Fur-thermore, our study was not powered for the purpose of differential expression analysis and thus we cannot be certain on the functional relevance of these gene sets. Nevertheless, our data is in line with a recent publication by Pereyraet althat stresses the importance of being able to discriminate between the specific protective and non-protective HIV specific CD8+T cells epi-topes in order to specify which epiepi-topes should be included in a HIV vaccine [13]. Thus further studies of detailed evaluations of immunodominant versus subdominant epitopes are
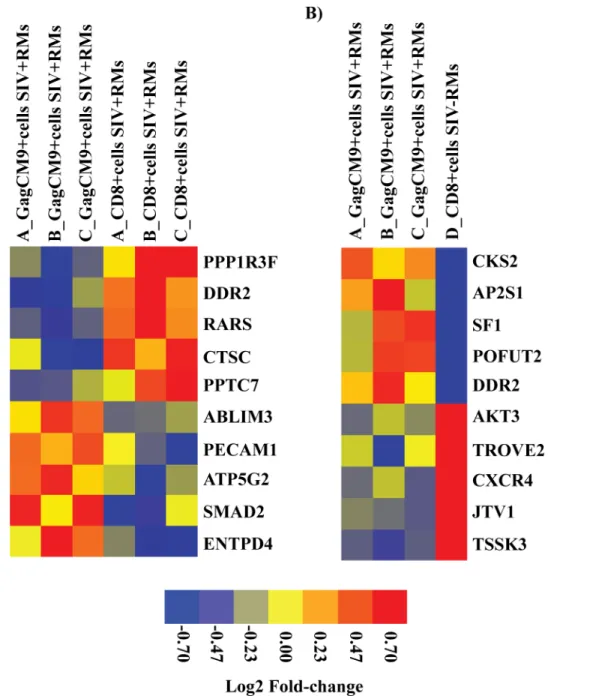
Fig 4. Heat map of top five up and downregulated differentially expressed genes.The heat map shows discrimination of the gene profiles of top five up and downregulated differentially expressed genes in the comparison betweenA)GagCM9+cells
SIV+RMsvs. CD8+cellsSIV+RMsandB)GagCM9+cellsSIV+RMs
vs. CD8+cells
SIV-RMs.Gene expression levels are shown in color, with red indicating over-abundant expression and blue indicating under-abundant
expression.
doi:10.1371/journal.pone.0149907.g004
warranted and may help provide insights on thein vivomechanisms of SIV CD8+T-cell inter-actions [2,13].
Two genes of particular interest, when comparing GagCM9+cellsSIV+RMsvs. CD8+cellsSIV +RMs, were CTSC (upregulated) and SMAD2 (downregulated). The CTSC gene encodes the
protein Cathepsin C, which is a key enzyme in the activation of granule serine peptidases, including Granzyme A and B which play a major role in cytotoxic CD8+T cell mediated killing
[35]. The signal transducer SMAD2 is activated by TGFβand this signaling pathway is sug-gested to play an important role in apoptosis as well as in virus specific CD8+T cell responses
during chronic viral infections, such as LCMV infection in mice and HIV/SIV infection in humans and NHP, respectively [36–38]. Sustained activation of the SMAD/TGFβsignaling pathway in mouse models may however result in suppression of viral specific CD8+T cells and hence viral persistence [38] and attenuation or blocking of this pathway can restore viral spe-cific T cell responses, including those targeting HIV/SIV [36–38]. It is interesting to speculate if these differences in SMAD/TGFβsignaling plays a role in potential functional differences of GagCM9 specific CD8+T cells from other CD8+T cells present in lymph nodes of SIV infected RMs. In addition, when comparing GagCM9+cells
SIV+RMsvs. CD8+cellsSIV-RMsand CD8+ cells-SIV+RMsvs. CD8+cellsSIV-RMs, two downregulated genes (AIMP2/JTV1 and CXCR4) involved
Table 2. The top 10 differentially expressed genes between GagCM9+cells
SIV+RMsvs. CD8+cellsSIV-RMs.
Gene name Log2FC Biological process or molecular function
Cyclin-dependent kinases regulatory subunit 2 (CKS2) 1.20 Cell cycle/Cell division
AP-2 complex subunit sigma (AP2S1) 1.20 Protein transport
Steroidogenic factor 1 (SF1) 1.19 DNA binding/ Transcriptional activator
GDP-fucose protein O-fucosyltransferase 2 (POFUT2) 1.18 Carbohydrate Metabolism Discoidin domain-containing receptor 2 (DDR2) 1.14 Tyrosine kinase/Cell differentiation RAC-gamma serine/threonine-protein kinase (AKT3) -1.21 Protein serine/threonine kinase activity
60 kDa SS-A/Ro ribonucleoprotein (TROVE2) -1.28 Metal ion binding
C-X-C chemokine receptor type 4 (CXCR4) -1.37 Activation of MAPK activity/Apoptosis
Aminoacyl tRNA synthase complex-interacting multifunctional protein 2 (AIMP2/JTV1) -1.58 Apoptosis
Testis-specific serine/threonine-protein kinase 3 (TSSK3) -1.87 ATP binding/protein phosphorylation
doi:10.1371/journal.pone.0149907.t002
Table 3. The top 10 differentially expressed genes between CD8+cells
SIV+RMsvs. CD8+cellsSIV-RMs.
Gene name Log2FC Biological process or
molecular function
AP-2 complex subunit sigma (AP2S1) 1.475 Endocytosis/Protein transport Polymerase I and transcript release factor (PTRF) 1.389 Transcription/Transcription
termination T-cell surface glycoprotein CD8 alpha chain (CD8A) 1.22 Adaptive immunity Vacuolar protein sorting-associated protein 37C (VPS37C) 1.08 Protein transport Actin-like protein 6A (ACTL6A) 1.05 Chromatin Binding AP-1 complex subunit sigma-2 (AP1S2) -1.06 Protein Transport Actin-binding LIM protein 1 (ABLIM1) -1.15 Actin binding Aminoacyl tRNA synthase complex-interacting
multifunctional protein 2 (AIMP2/JTV1)
-1.35 Apoptosis
Beta-2 adrenergic receptor (ADRB2) -1.36 Activation of adenylate cyclase activity
Testis-specific serine/threonine-protein kinase 3 (TSSK3) -1.88 ATP binding/protein phosphorylation
in apoptosis were identified. Thus, the observed downregulation of genes involved in apoptosis in all three comparisons raises the question whether GagCM9+cells
SIV+RMsare less prone to
become apoptotic.
Our studies were designed to be exploratory and hence more provocative in generating hypotheses than definitive in their conclusions. Our sample size was small, which limited sta-tistical power and precluded us from incorporating multiple comparison correction techniques for doing comparisons of gene transcription data. In this exploratory study, we used the human Illumina bead array since less amount of cDNA was required as compared to the NHP Illumina bead array. Furthermore, the SIV infected RMs are Mamu-A01 positive while the
SIV uninfected monkey is Mamu-A01 negative. RMs expressing Mamu-A01 are associated
with a slow SIV disease progression and the SIV specific GagCM9 CD8+T cells have been sug-gested to play an important role in this slow disease progression [9]. However, the slow disease progression seen in Mamu-A01 may also be due to the co-expression of Mamu-B17 or–B08
that are highly associated with elite control of SIV [33,34]. Thus, it would have been preferable if the RMs used in this study were genotyped for additional MHC class I alleles such as Mamu-A02, -B17 or–B08, which presents several immunodominant epitopes [33,34]. While
keep-ing these caveats in mind, our data imply that the three different CD8+T cell populations assessed here displayed distinct gene transcriptional profiles. Interestingly, genes involved in cytotoxic killing, and apoptosis were altered in the GagCM9+cellsSIV+RMsas compared to the
other CD8+T cells from SIV infected and from uninfected RMs. Thus it would be interesting
to further investigate the role of these genes in SIV specific CD8+T cells as compared to other subdominant CD8+T cells. Furthermore, GagCM9+cells
SIV+RMsand CD8+cellsSIV+RMsshowed
a rather similar gene expression profiles as compared to CD8+T cells of uninfected RMs sug-gesting that SIV is a major driver of gene transcription in the CD8+T cell mediated immune
responses in SIV infection.
Several studies have shown transcriptional differences in immune cells obtained from HIV infected individuals in different clinical stages of the disease, as well as from SIV infected vs. uninfected, pathogenic vs. non-pathogenic and vaccinated vs. unvaccinated NHPs [26,39–54]. In a majority of these studies the transcriptional profiles of PBMCs or of single cell suspensions of lymph nodes were investigated, however some of the studies also examined the transcrip-tional profile of purified CD8+T cells from blood [51–54]. The major contribution of our study is the implementation of methods allowing detection, collection and capturing of specific cells of interest from intact tissue sections and subsequent analyses of the different enriched cell populations. Hence, the data provided reflects the status of the cells within their“natural environment”at time of sampling and at critical sites of immune reactions.
In summary, we here introduced novel techniques that allows discrimination between three different CD8+T cell populations, namely GagCM9 specific CD8+T cells and other CD8+T cells from intact cryo preserved lymphoid tissues of SIV infected RMs as well as CD8+T cells
from uninfected RMs. These different CD8+T cell populations displayed unique transcrip-tional profiles. In order to specify which epitopes should be included in a HIV vaccine is of major importance to be able to distinguish between the specific protective and non-protective HIV specific CD8+T cells epitopes. Single-cell gene expression analysis of antigen specific T
cells furthermore suggest that there is a great heterogeneity between individual cells, even with a well-defined cell population, which may be missed when averaging gene expression within a given cell population [55–57]. Thus, the combination of thein situstaining and LCM tech-niques used in this study could be a potential methodological platform in combination with single-cell gene or protein expression analysis, for further characterization of CD8+T cells of importance for the control of SIV/HIV. Consequently, a larger sample size, which also takes into consideration the effect of different MHC class I alleles, is thus needed to pinpoint the
gene transcriptional profiles of SIV specific CD8+T cells, particular in lymphoid tissue where the main HIV/SIV replication occurs.
Supporting Information
S1 Table. Differentially expressed genes between GagCM9+cellsSIV+RMs vs. CD8+-cellsSIV+RMs.
(XLS)
S2 Table. Differentially expressed genes between GagCM9+cellsSIV+RMs vs. CD8+-cellsSIV-RMs.
(XLS)
S3 Table. Differentially expressed genes between CD8+cellsSIV+RMs vs. CD8+-cellsSIV-RMs.
(XLS)
Acknowledgments
We thank Miner Mindy for editorial assistance, Andy Sylwester and Carole Elliott for help with the NHP samples, and Khamsone Phasouk for technical assistance with the LCM experi-ments. We furthermore thank the James B. Pendleton Charitable Trust for their generous equipment donation.
Author Contributions
Conceived and designed the experiments: AT MJM LC. Performed the experiments: AT AB JL TP JZ LJP. Analyzed the data: AT AB JL TP JZ LÖ KB LC. Contributed reagents/materials/ analysis tools: AB JL LJP. Wrote the paper: AT AB JL TP JZ LÖ LJP KB MJM LC.
References
1. Borrow P, Lewicki H, Hahn BH, Shaw GM, Oldstone MB. Virus-specific CD8+ cytotoxic T-lymphocyte activity associated with control of viremia in primary human immunodeficiency virus type 1 infection. Journal of virology. 1994; 68(9):6103–10. Epub 1994/09/01. PMID:8057491
2. Chowdhury A, Hayes TL, Bosinger SE, Lawson BO, Vanderford T, Schmitz JE, et al. Differential Impact of In Vivo CD8+ T Lymphocyte Depletion in Controller versus Progressor Simian Immunodeficiency Virus-Infected Macaques. Journal of virology. 2015; 89(17):8677–86. Epub 2015/06/13. doi:10.1128/
JVI.00869-15PMID:26063417
3. Friedrich TC, Valentine LE, Yant LJ, Rakasz EG, Piaskowski SM, Furlott JR, et al. Subdominant CD8+ T-cell responses are involved in durable control of AIDS virus replication. Journal of virology. 2007; 81 (7):3465–76. Epub 2007/01/26. PMID:17251286
4. Jin X, Bauer DE, Tuttleton SE, Lewin S, Gettie A, Blanchard J, et al. Dramatic rise in plasma viremia after CD8(+) T cell depletion in simian immunodeficiency virus-infected macaques. The Journal of experimental medicine. 1999; 189(6):991–8. Epub 1999/03/17. PMID:10075982
5. Koup RA, Safrit JT, Cao Y, Andrews CA, McLeod G, Borkowsky W, et al. Temporal association of cellu-lar immune responses with the initial control of viremia in primary human immunodeficiency virus type 1 syndrome. Journal of virology. 1994; 68(7):4650–5. Epub 1994/07/01. PMID:8207839
6. Li Q, Skinner PJ, Ha SJ, Duan L, Mattila TL, Hage A, et al. Visualizing antigen-specific and infected cells in situ predicts outcomes in early viral infection. Science. 2009; 323(5922):1726–9. Epub 2009/03/
28. doi:10.1126/science.1168676PMID:19325114
7. Mao H, Lafont BA, Igarashi T, Nishimura Y, Brown C, Hirsch V, et al. CD8+ and CD20+ lymphocytes cooperate to control acute simian immunodeficiency virus/human immunodeficiency virus chimeric virus infections in rhesus monkeys: modulation by major histocompatibility complex genotype. Journal of virology. 2005; 79(23):14887–98. Epub 2005/11/12. PMID:16282488
primary infections of rhesus macaques. Journal of virology. 1998; 72(1):164–9. Epub 1998/01/07.
PMID:9420212
9. McDermott AB, Koup RA. CD8(+) T cells in preventing HIV infection and disease. Aids. 2012; 26 (10):1281–92. Epub 2012/03/24. doi:10.1097/QAD.0b013e328353bcafPMID:22441256
10. Schmitz JE, Kuroda MJ, Santra S, Sasseville VG, Simon MA, Lifton MA, et al. Control of viremia in sim-ian immunodeficiency virus infection by CD8+ lymphocytes. Science. 1999; 283(5403):857–60. Epub
1999/02/05. PMID:9933172
11. Tsukamoto T, Yuasa M, Yamamoto H, Kawada M, Takeda A, Igarashi H, et al. Induction of CD8+ cells able to suppress CCR5-tropic simian immunodeficiency virus SIVmac239 replication by controlled infection of CXCR4-tropic simian-human immunodeficiency virus in vaccinated rhesus macaques. Journal of virology. 2007; 81(21):11640–9. Epub 2007/08/31. PMID:17728225
12. Goulder PJ, Watkins DI. Impact of MHC class I diversity on immune control of immunodeficiency virus replication. Nature reviews Immunology. 2008; 8(8):619–30. Epub 2008/07/12. doi:10.1038/nri2357
PMID:18617886
13. Pereyra F, Heckerman D, Carlson JM, Kadie C, Soghoian DZ, Karel D, et al. HIV Control Is Mediated in Part by CD8+ T-Cell Targeting of Specific Epitopes. Journal of virology. 2014; 88(22):12937–48. Epub
2014/08/29. doi:10.1128/JVI.01004-14PMID:25165115
14. Allen TM, Sidney J, del Guercio MF, Glickman RL, Lensmeyer GL, Wiebe DA, et al. Characterization of the peptide binding motif of a rhesus MHC class I molecule (Mamu-A*01) that binds an immunodomi-nant CTL epitope from simian immunodeficiency virus. Journal of immunology. 1998; 160(12):6062–
71. Epub 1998/06/24.
15. Egan MA, Kuroda MJ, Voss G, Schmitz JE, Charini WA, Lord CI, et al. Use of major histocompatibility complex class I/peptide/beta2M tetramers to quantitate CD8(+) cytotoxic T lymphocytes specific for dominant and nondominant viral epitopes in simian-human immunodeficiency virus-infected rhesus monkeys. Journal of virology. 1999; 73(7):5466–72. Epub 1999/06/11. PMID:10364294
16. Mothe BR, Horton H, Carter DK, Allen TM, Liebl ME, Skinner P, et al. Dominance of CD8 responses specific for epitopes bound by a single major histocompatibility complex class I molecule during the acute phase of viral infection. Journal of virology. 2002; 76(2):875–84. Epub 2001/12/26. PMID:
11752176
17. Genesca M, Skinner PJ, Hong JJ, Li J, Lu D, McChesney MB, et al. With minimal systemic T-cell expansion, CD8+ T Cells mediate protection of rhesus macaques immunized with attenuated simian-human immunodeficiency virus SHIV89.6 from vaginal challenge with simian immunodeficiency virus. Journal of virology. 2008; 82(22):11181–96. Epub 2008/09/13. doi:10.1128/JVI.01433-08PMID:
18787003
18. Vojnov L, Martins MA, Almeida JR, Ende Z, Rakasz EG, Reynolds MR, et al. GagCM9-specific CD8+ T cells expressing limited public TCR clonotypes do not suppress SIV replication in vivo. PloS one. 2011; 6(8):e23515. Epub 2011/09/03. doi:10.1371/journal.pone.0023515PMID:21887264
19. Sasikala-Appukuttan AK, Kim HO, Kinzel NJ, Hong JJ, Smith AJ, Wagstaff R, et al. Location and dynamics of the immunodominant CD8 T cell response to SIVDeltanef immunization and SIVmac251 vaginal challenge. PloS one. 2013; 8(12):e81623. Epub 2013/12/19. doi:10.1371/journal.pone. 0081623PMID:24349100
20. Kuroda MJ, Schmitz JE, Seth A, Veazey RS, Nickerson CE, Lifton MA, et al. Simian immunodeficiency virus-specific cytotoxic T lymphocytes and cell-associated viral RNA levels in distinct lymphoid com-partments of SIVmac-infected rhesus monkeys. Blood. 2000; 96(4):1474–9. Epub 2000/08/15. PMID:
10942394
21. Embretson J, Zupancic M, Ribas JL, Burke A, Racz P, Tenner-Racz K, et al. Massive covert infection of helper T lymphocytes and macrophages by HIV during the incubation period of AIDS. Nature. 1993; 362(6418):359–62. Epub 1993/03/25. PMID:8096068
22. Horiike M, Iwami S, Kodama M, Sato A, Watanabe Y, Yasui M, et al. Lymph nodes harbor viral reser-voirs that cause rebound of plasma viremia in SIV-infected macaques upon cessation of combined anti-retroviral therapy. Virology. 2012; 423(2):107–18. Epub 2011/12/27. doi:10.1016/j.virol.2011.11.024
PMID:22196013
23. North TW, Higgins J, Deere JD, Hayes TL, Villalobos A, Adamson L, et al. Viral sanctuaries during highly active antiretroviral therapy in a nonhuman primate model for AIDS. Journal of virology. 2010; 84 (6):2913–22. Epub 2009/12/25. doi:10.1128/JVI.02356-09PMID:20032180
24. Pantaleo G, Graziosi C, Demarest JF, Butini L, Montroni M, Fox CH, et al. HIV infection is active and progressive in lymphoid tissue during the clinically latent stage of disease. Nature. 1993; 362 (6418):355–8. Epub 1993/03/25. PMID:8455722
25. Tenner-Racz K, Racz P, Bofill M, Schulz-Meyer A, Dietrich M, Kern P, et al. HTLV-III/LAV viral antigens in lymph nodes of homosexual men with persistent generalized lymphadenopathy and AIDS. The American journal of pathology. 1986; 123(1):9–15. Epub 1986/04/01. PMID:3008562
26. Fukazawa Y, Park H, Cameron MJ, Lefebvre F, Lum R, Coombes N, et al. Lymph node T cell responses predict the efficacy of live attenuated SIV vaccines. Nature medicine. 2012; 18(11):1673–
81. Epub 2012/09/11. doi:10.1038/nm.2934PMID:22961108
27. Tjernlund A, Zhu J, Laing K, Diem K, McDonald D, Vazquez J, et al. In situ detection of Gag-specific CD8+ cells in the GI tract of SIV infected Rhesus macaques. Retrovirology. 2010; 7:12. Epub 2010/02/ 18. doi:10.1186/1742-4690-7-12PMID:20158906
28. National Research Council; Guide for the Care and Use of Laboratory Animals. Washington, D.C.: National Academic Press; 1996.
29. Zhu J, Koelle DM, Cao J, Vazquez J, Huang ML, Hladik F, et al. Virus-specific CD8+ T cells accumulate near sensory nerve endings in genital skin during subclinical HSV-2 reactivation. The Journal of experi-mental medicine. 2007; 204(3):595–603. Epub 2007/02/28. PMID:17325200
30. Peng T, Zhu J, Phasouk K, Koelle DM, Wald A, Corey L. An effector phenotype of CD8+ T cells at the junction epithelium during clinical quiescence of herpes simplex virus 2 infection. Journal of virology. 2012; 86(19):10587–96. Epub 2012/07/20. doi:10.1128/JVI.01237-12PMID:22811543
31. Zhu J, Peng T, Johnston C, Phasouk K, Kask AS, Klock A, et al. Immune surveillance by CD8alphaal-pha+ skin-resident T cells in human herpes virus infection. Nature. 2013; 497(7450):494–7. Epub
2013/05/10. doi:10.1038/nature12110PMID:23657257
32. Burgener A, Tjernlund A, Kaldensjo T, Abou M, McCorrister S, Westmacott GR, et al. A systems biology examination of the human female genital tract shows compartmentalization of immune factor expres-sion. Journal of virology. 2013; 87(9):5141–50. Epub 2013/03/02. doi:10.1128/JVI.03347-12PMID:
23449785
33. Yant LJ, Friedrich TC, Johnson RC, May GE, Maness NJ, Enz AM, et al. The high-frequency major histocompatibility complex class I allele Mamu-B*17 is associated with control of simian immunodefi-ciency virus SIVmac239 replication. Journal of virology. 2006; 80(10):5074–7. Epub 2006/04/28. PMID:
16641299
34. Loffredo JT, Valentine LE, Watkins DI. Beyond Mamu-A*01+ Indian Rhesus Macaques: Continued Dis-covery of New MHC Class I Molecules that Bind Epitopes from the Simian AIDS Viruses. 2006; Avail-able:http://www.hiv.lanl.gov/content/immunology/pdf/2006_07/siv_epitopes_article.pdf.
35. Laforge M, Bidere N, Carmona S, Devocelle A, Charpentier B, Senik A. Apoptotic death concurrent with CD3 stimulation in primary human CD8+ T lymphocytes: a role for endogenous granzyme B. Journal of immunology. 2006; 176(7):3966–77. Epub 2006/03/21.
36. Cumont MC, Monceaux V, Viollet L, Lay S, Parker R, Hurtrel B, et al. TGF-beta in intestinal lymphoid organs contributes to the death of armed effector CD8 T cells and is associated with the absence of virus containment in rhesus macaques infected with the simian immunodeficiency virus. Cell death and differentiation. 2007; 14(10):1747–58. Epub 2007/07/07. PMID:17612589
37. Garba ML, Pilcher CD, Bingham AL, Eron J, Frelinger JA. HIV antigens can induce TGF-beta(1)-pro-ducing immunoregulatory CD8+ T cells. Journal of immunology. 2002; 168(5):2247–54. Epub 2002/02/
23.
38. Tinoco R, Alcalde V, Yang Y, Sauer K, Zuniga EI. Cell-intrinsic transforming growth factor-beta signal-ing mediates virus-specific CD8+ T cell deletion and viral persistence in vivo. Immunity. 2009; 31 (1):145–57. Epub 2009/07/17. doi:10.1016/j.immuni.2009.06.015PMID:19604493
39. Belisle SE, Yin J, Shedlock DJ, Dai A, Yan J, Hirao L, et al. Long-term programming of antigen-specific immunity from gene expression signatures in the PBMC of rhesus macaques immunized with an SIV DNA vaccine. PloS one. 2011; 6(6):e19681. Epub 2011/06/28. doi:10.1371/journal.pone.0019681 PMID:21701683
40. Bosinger SE, Hosiawa KA, Cameron MJ, Persad D, Ran L, Xu L, et al. Gene expression profiling of host response in models of acute HIV infection. Journal of immunology. 2004; 173(11):6858–63. Epub
2004/11/24.
41. Bosinger SE, Jacquelin B, Benecke A, Silvestri G, Muller-Trutwin M. Systems biology of natural simian immunodeficiency virus infections. Current opinion in HIV and AIDS. 2012; 7(1):71–8. Epub 2011/12/
03. doi:10.1097/COH.0b013e32834dde01PMID:22134342
42. Favre D, Lederer S, Kanwar B, Ma ZM, Proll S, Kasakow Z, et al. Critical loss of the balance between Th17 and T regulatory cell populations in pathogenic SIV infection. PLoS pathogens. 2009; 5(2): e1000295. Epub 2009/02/14. doi:10.1371/journal.ppat.1000295PMID:19214220
mucosal repair and regeneration. Journal of virology. 2005; 79(5):2709–19. Epub 2005/02/15. PMID:
15708990
44. George MD, Verhoeven D, McBride Z, Dandekar S. Gene expression profiling of gut mucosa and mesenteric lymph nodes in simian immunodeficiency virus-infected macaques with divergent disease course. Journal of medical primatology. 2006; 35(4–5):261–9. Epub 2006/07/29. PMID:16872289
45. Jacquelin B, Mayau V, Targat B, Liovat AS, Kunkel D, Petitjean G, et al. Nonpathogenic SIV infection of African green monkeys induces a strong but rapidly controlled type I IFN response. The Journal of clini-cal investigation. 2009; 119(12):3544–55. Epub 2009/12/05. doi:10.1172/JCI40093PMID:19959873
46. Lederer S, Favre D, Walters KA, Proll S, Kanwar B, Kasakow Z, et al. Transcriptional profiling in patho-genic and non-pathopatho-genic SIV infections reveals significant distinctions in kinetics and tissue compart-mentalization. PLoS pathogens. 2009; 5(2):e1000296. Epub 2009/02/14. doi:10.1371/journal.ppat. 1000296PMID:19214219
47. Li Q, Smith AJ, Schacker TW, Carlis JV, Duan L, Reilly CS, et al. Microarray analysis of lymphatic tissue reveals stage-specific, gene expression signatures in HIV-1 infection. Journal of immunology. 2009; 183(3):1975–82. Epub 2009/07/15.
48. Palermo RE, Patterson LJ, Aicher LD, Korth MJ, Robert-Guroff M, Katze MG. Genomic analysis reveals pre- and postchallenge differences in a rhesus macaque AIDS vaccine trial: insights into mechanisms of vaccine efficacy. Journal of virology. 2011; 85(2):1099–116. Epub 2010/11/12. doi:10.1128/JVI.
01522-10PMID:21068249
49. Rotger M, Dalmau J, Rauch A, McLaren P, Bosinger SE, Martinez R, et al. Comparative transcriptomics of extreme phenotypes of human HIV-1 infection and SIV infection in sooty mangabey and rhesus macaque. The Journal of clinical investigation. 2011; 121(6):2391–400. Epub 2011/05/11. doi:10.
1172/JCI45235PMID:21555857
50. Smith AJ, Li Q, Wietgrefe SW, Schacker TW, Reilly CS, Haase AT. Host genes associated with HIV-1 replication in lymphatic tissue. Journal of immunology. 2010; 185(9):5417–24. Epub 2010/10/12.
51. George MD, Hu W, Billingsley JM, Reeves RK, Sankaran-Walters S, Johnson RP, et al. Transcriptional profiling of peripheral CD8+T cell responses to SIVDeltanef and SIVmac251 challenge reveals a link between protective immunity and induction of systemic immunoregulatory mechanisms. Virology. 2014; 468-470C:581–91. Epub 2014/10/06.
52. Hyrcza MD, Kovacs C, Loutfy M, Halpenny R, Heisler L, Yang S, et al. Distinct transcriptional profiles in ex vivo CD4+ and CD8+ T cells are established early in human immunodeficiency virus type 1 infection and are characterized by a chronic interferon response as well as extensive transcriptional changes in CD8+ T cells. Journal of virology. 2007; 81(7):3477–86. Epub 2007/01/26. PMID:17251300
53. Martinez-Marino B, Foster H, Hao Y, Levy JA. Differential gene expression in CD8(+) cells from HIV-1-infected subjects showing suppression of HIV replication. Virology. 2007; 362(1):217–25. Epub 2007/
01/24. PMID:17240414
54. Wu JQ, Dwyer DE, Dyer WB, Yang YH, Wang B, Saksena NK. Transcriptional profiles in CD8+ T cells from HIV+ progressors on HAART are characterized by coordinated up-regulation of oxidative phos-phorylation enzymes and interferon responses. Virology. 2008; 380(1):124–35. Epub 2008/08/12. doi:
10.1016/j.virol.2008.06.039PMID:18692859
55. Flatz L, Roychoudhuri R, Honda M, Filali-Mouhim A, Goulet JP, Kettaf N, et al. Single-cell gene-expres-sion profiling reveals qualitatively distinct CD8 T cells elicited by different gene-based vaccines. Pro-ceedings of the National Academy of Sciences of the United States of America. 2011; 108(14):5724–9.
Epub 2011/03/23. doi:10.1073/pnas.1013084108PMID:21422297
56. Gupta B, Iancu EM, Gannon PO, Wieckowski S, Baitsch L, Speiser DE, et al. Simultaneous coexpres-sion of memory-related and effector-related genes by individual human CD8 T cells depends on antigen specificity and differentiation. Journal of immunotherapy. 2012; 35(6):488–501. Epub 2012/06/28. doi:
10.1097/CJI.0b013e31826183a7PMID:22735807
57. Iancu EM, Baumgaertner P, Wieckowski S, Speiser DE, Rufer N. Profile of a serial killer: cellular and molecular approaches to study individual cytotoxic T-cells following therapeutic vaccination. Journal of biomedicine & biotechnology. 2011; 2011:452606. Epub 2010/11/30.