Sjafrudin Latar et al. Int. Journal of Engineering Research and Applications
www.ijera.com
ISSN : 2248-9622, Vol. 5, Issue 5, ( Part -2) May 2015, pp.51-56
Relationship with the Degree of Saturation of the Swelling Strain
Sjafrudin Latar
1, Hary Christady Hardiyatmo
2, Agus Darmawan Adi
21)
State Politecnich of Ambon
2)
Lecturer in The Civil Engineering Progrm, Faculty of Engineering U G M
ABSTRACT
Expansive soil in SokooNgawi East Java often gives problems in the building stability. This research aims to study the properties of the soil in the area that mainly related to changes in moisture content in particular the influence of the degree of saturation of the swelling strain.
Swelling tests were performed on disturbed soil by means of oedometer at 6.9 kPa overburden pressure. Initial moisture contents used were varied from 15.04% to 42.88%. Swelling strain was measured using overburden pressure 6.9 kPa and swelling pressure obtained from the pressure required to return the sample to the original condition.
The test results show that for initial moisture content 15.04 % , γd= 1.471 gr/cm ³,S = 50.70 % the
maximum swelling strain were 38.04% and swelling pressure was 2392 kPa. The initial moisture content 42.88%, γd= 0.926 gr / cm ³, S = 65.26 % the minimum swelling strain was
1.68 % and swelling pressure was 34 kPa.
Key words
: Expansive soil, degree of saturation, swelling strain, swelling pressure.I.
INTRODUCTION
Expansive soil is the soil whose clay content has swelling potential resulting from the change in water content. Principally, the expansive soil is managed by maintaining moderate change or by changing the expansive property of the clay soil into non-expansive clay soil.
The expansive clay soil has several characteristics. Chen (1975) suggests that the increase in the water content causes the increase in the volume of the expansive clay soil both horizontally and vertically.
Expansive soil in SokooNgawi East Java often gives problems in the building stability. This research aims to study the properties of the soil in the area is mainly related to changes in moisture content in particular the influence of the degree of saturation of the swelling strain.
II.
LITERATURE STUDY
Swelling Shrinkage Clay
The change in the water content of the soil with high clay content causes the change in its volume. The decrease in the water content results in the clay shrinkage and vice versa. The swelling rate depends on some factors such as the type and the quantity of minerals of the clay, specific width of the clay, structure, salt concentration of pore water, cation valence, cementation, the presence of organic materials, initial water content and so on.
The water content has significant impact on natural clay because the area close to the surface is influenced by evaporation and absorption of
vegetation. The important thing in evaluating the swelling of the clay is the depth of active zone. The water content under the active zone is considered to always be constant that there is not any expansive clay under the active zone.
The position of the expansive clay changes after the expansion process. The clay becomes over-consolidated and its compressibility decreases as a result of the increase in capillary pressure.
Swelling is a quite complex process. The magnitude of the pressure value of swelling depends on the number of the minerals of the clay and the initial water content. The clay with random structure is more likely to expand than the well-structured one. Laboratory swelling test and the analysis chemical and mineralogy and its correlation with classification and soil index properties may be carried out to predict the expandability of the clay.
Swelling Test
Generally, swelling test is carried out on cylindrical steel ring for laterally restrained soil clay. First, the dry soil sample is given evenly distributed load and then it is soaked in water. The swelling clay sample vertically and the change in its height is divided by its initial height to obtain its swelling potential in percent. The test can also be carried out using conventional consolidometer. However, the absence of standard testing procedure results in various testing specifications and consequently, it is impossible to compare the testing results.
Some researchers carry out 24 hours test or other researchers wait till the swelling rate reaches certain level, for example 0.001”/hour that it takes several days Caduto (1994) in Hardiyatmo (2010).
Sjafrudin Latar et al. Int. Journal of Engineering Research and Applications
www.ijera.com
ISSN : 2248-9622, Vol. 5, Issue 5, ( Part -2) May 2015, pp.51-56
Snethen (1984) in Hardiyantmo (2010) suggests the definition of the swelling potential as follow: Swelling potential is the balance of vertical volume change (testing object deformation) using consolidometer, which is expressed in percent and the initial height of undisturbed sample and the water content and the natural density in saturated condition under the load equivalent to the overburden pressure in place.
Swelling Pressure Test
Swelling pressure that prevents ground from expanding is referred to as swelling pressure (σs). The
loading test is carried out by measuring the swelling at the end of the loading step of the swelling test by gradually releasing the load to the initial volume. Chen (1988) in Hardiyatmo (2010) and some researchers suggest that the swelling pressure does not depend on the initial water content, the initial degree of saturation , the ground thickness and the variation of dry density. They are all the fundamental physical properties of the expansive clay. However, other studies do not confirm the evaluation and claim that they vary.
Chen (1988) in Hardiyantmo (2010) suggests testing remolded ground sample at relative density of 100% and he defines the swelling pressure as the value required to maintain the dry density.
III.
STUDY METHOD
Preparation Stage
The materials prepared are among others the disturbed samples of clay soil of SokooNgawi East Java.
Testing Stage
The test consists of initial test and main test. The initial test represents the one that examine the clay soil properties, including water content, specific grafity, sieve analysis and hydrometer, Atterbert limit and standard and modified solidification. The main test represents the one that examines the swelling using oedometer with the variation of water contents. The testing materials are molded in accordance with the existing reference and aerated until their water content reaches the predetermined one. Vertical load is given to the materials, which equals to estimated overburden pressure. The normal load at 6.9 kPa (Seed et. al. 1962 in Hardiyanto 2010) for 5 minutes and the loading is set and then the resulting deformation is recorded.
Subsequently, the consolidomeer arm is supported and the pointer is zeroed. And then, the materials are given water while at the same time the swelling reading is observed. The reading is conducted continuously till it reaches very small value and it usually takes place for days (5-16 days).
IV.
TESTING RESULTS
Preliminary Testing Results
The Table 1 below summarizes the preliminary testing results.
Tabel 1 The testing results of the properties of the clay of Sokoo
Soil Properties Value
Grain size analysis
Get away No 200 (%) 96.98 Get away < No 4 (%) 100
Atterberg limits
Liquid Limit (%) 105.03 Plastic Limit (%) 34.26 Plasticity index (%) 70.77 Shrinkage Limit (%) 9.65
Specific grafity (Gs) 2.63
Original water content (%) 53.3
Optimum water content (%) (standar Proctor)
34.58
Max dry density, γdmax (gr/cm³) 1.203
Optimum water content (%) (modified Proctor)
23.92
Max dry density, γdmax (gr/cm³) 1.471
Activity 4.03
Soil
Clasification
Unified system CH
AASTHO system A-7-5
Atterberg limits mean that the clay has shrinkage limit (SL) of 9.65% and liquid limit (LL) of 105.03%, which indicate that the soil has very high expandability (Holtz and Gibbs, 1969; USBR, 1974; Seed et. al., 1962 in Hardiyanto, 2010).
The soil clay has sand content of 3.02%, while its clay content is 96.98%. The activity resulting from the relationship between the clay percentage and the plasticity index is 4.03 that can identify very high expandability.
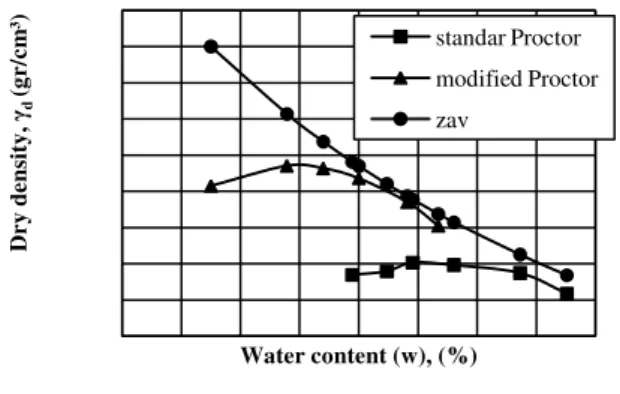
Figure 1. Compaction curve
The standard Proctor result gives maximum dry density (γd max) of 1,203 gr/cm³ and optimum water
content of 34.58 %, while the modified Proctor give
D
r
y
d
e
n
si
ty
,
γd
(g
r
/c
m
³)
Water content (w), (%)
standar Proctor
Sjafrudin Latar et al. Int. Journal of Engineering Research and Applications
www.ijera.com
ISSN : 2248-9622, Vol. 5, Issue 5, ( Part -2) May 2015, pp.51-56
the maximum dry density (γd max) of 1,471 gr/cm³
and the optimum water content of 23.92 % as seen in Figure 1.
Main Testing Results Swelling Test
The main test is carried out to examine the expansion and then the swelling pressure.
The results of maximum and minimum expansions may be observed in Figure 2 and Figure 3 in their correlation with the tension and the time for the initial varied water content and the varied solidity.
Figure 2.Relationship the strain and the time for the variation of water content with dry density (γd)=
1.471 gr/cm³
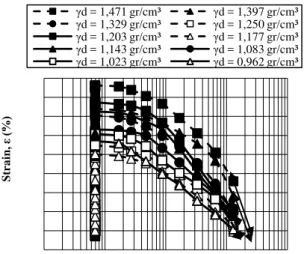
Figure 3. Relationship the strain and density variations with time for initial water content (wo) =
42.88%
Swelling Pressure Test
The results of the swelling pressure test are plotted in the graph of the correlation between the tension and the maximum and minimum overburden pressures as seen in Figure 4 and Figure 5.
Figure 4. Relationship the strain and overburden pressure (σ'v) for density variations with initial water
content (wo) = 15:04%
Figure 5.Relationship the strain and overburden pressure (σ'v) for density variations with initial water
content (wo) = 42.88 %
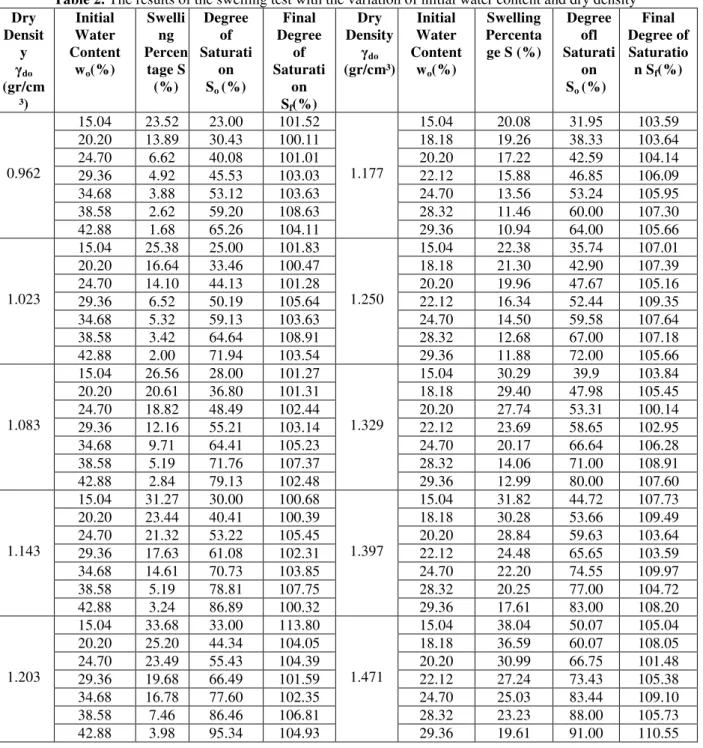
The main test is carried out by examining the expansion with the instrument of Oedometer, including the variation of initial water content and solidity. The results of the expansion test are summarized in Table 2.
S
tr
a
in
,
ε
(%
)
Time, minute
wo = 15.04 % wo = 18.18 % wo = 20.20 % wo = 22.12 % wo = 24.70 % wo = 28.32 % wo = 29.36 %
S
tr
a
in
,
ε
(%
)
Time, minute γd : 1.203 gr/cm³ γd : 1.143 gr/cm³ γd : 1.083 gr/cm³
S
tr
a
in
,
ε
(%
)
Overburden pressure, σ'v (kPa) γd = 1,471 gr/cm³ γd = 1,397 gr/cm³ γd = 1,329 gr/cm³ γd = 1,250 gr/cm³ γd = 1,203 gr/cm³ γd = 1,177 gr/cm³ γd = 1,143 gr/cm³ γd = 1,083 gr/cm³ γd = 1,023 gr/cm³ γd = 0,962 gr/cm³
S
tr
a
in
,
ε
(%
)
Sjafrudin Latar et al. Int. Journal of Engineering Research and Applications
www.ijera.com
ISSN : 2248-9622, Vol. 5, Issue 5, ( Part -2) May 2015, pp.51-56
Table 2. The results of the swelling test with the variation of initial water content and dry density Dry
Densit y γdo (gr/cm
³)
Initial Water Content
wo(%)
Swelli ng Percen
tage S (%)
Degree of Saturati
on So (%)
Final Degree
of Saturati
on Sf(%)
Dry Density
γdo (gr/cm³)
Initial Water Content
wo(%)
Swelling Percenta ge S (%)
Degree ofl Saturati
on So (%)
Final Degree of Saturatio
n Sf(%)
0.962
15.04 23.52 23.00 101.52
1.177
15.04 20.08 31.95 103.59
20.20 13.89 30.43 100.11 18.18 19.26 38.33 103.64
24.70 6.62 40.08 101.01 20.20 17.22 42.59 104.14
29.36 4.92 45.53 103.03 22.12 15.88 46.85 106.09
34.68 3.88 53.12 103.63 24.70 13.56 53.24 105.95
38.58 2.62 59.20 108.63 28.32 11.46 60.00 107.30
42.88 1.68 65.26 104.11 29.36 10.94 64.00 105.66
1.023
15.04 25.38 25.00 101.83
1.250
15.04 22.38 35.74 107.01
20.20 16.64 33.46 100.47 18.18 21.30 42.90 107.39
24.70 14.10 44.13 101.28 20.20 19.96 47.67 105.16
29.36 6.52 50.19 105.64 22.12 16.34 52.44 109.35
34.68 5.32 59.13 103.63 24.70 14.50 59.58 107.64
38.58 3.42 64.64 108.91 28.32 12.68 67.00 107.18
42.88 2.00 71.94 103.54 29.36 11.88 72.00 105.66
1.083
15.04 26.56 28.00 101.27
1.329
15.04 30.29 39.9 103.84
20.20 20.61 36.80 101.31 18.18 29.40 47.98 105.45
24.70 18.82 48.49 102.44 20.20 27.74 53.31 100.14
29.36 12.16 55.21 103.14 22.12 23.69 58.65 102.95
34.68 9.71 64.41 105.23 24.70 20.17 66.64 106.28
38.58 5.19 71.76 107.37 28.32 14.06 71.00 108.91
42.88 2.84 79.13 102.48 29.36 12.99 80.00 107.60
1.143
15.04 31.27 30.00 100.68
1.397
15.04 31.82 44.72 107.73
20.20 23.44 40.41 100.39 18.18 30.28 53.66 109.49
24.70 21.32 53.22 105.45 20.20 28.84 59.63 103.64
29.36 17.63 61.08 102.31 22.12 24.48 65.65 103.59
34.68 14.61 70.73 103.85 24.70 22.20 74.55 109.97
38.58 5.19 78.81 107.75 28.32 20.25 77.00 104.72
42.88 3.24 86.89 100.32 29.36 17.61 83.00 108.20
1.203
15.04 33.68 33.00 113.80
1.471
15.04 38.04 50.07 105.04
20.20 25.20 44.34 104.05 18.18 36.59 60.07 108.05
24.70 23.49 55.43 104.39 20.20 30.99 66.75 101.48
29.36 19.68 66.49 101.59 22.12 27.24 73.43 105.38
34.68 16.78 77.60 102.35 24.70 25.03 83.44 109.10
38.58 7.46 86.46 106.81 28.32 23.23 88.00 105.73
42.88 3.98 95.34 104.93 29.36 19.61 91.00 110.55
V.
DISCUSSION
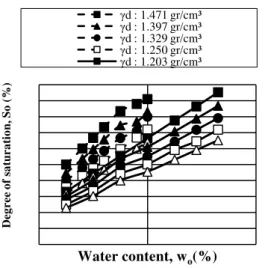
Relationship Water Content and Degree of Saturation
Sjafrudin Latar et al. Int. Journal of Engineering Research and Applications
www.ijera.com
ISSN : 2248-9622, Vol. 5, Issue 5, ( Part -2) May 2015, pp.51-56
Fibure 6.Relationship the water content and the degree of saturation and the compaction variation.
Relationship the Degree of Saturation and the Swelling Strain and the Swelling Pressure
The results of the swelling test as presented in Figure 7 show that there is a significant relationship the swelling strain and the initial degree of saturation. It indicates that the higher is the degree of saturation, the smaller the swelling is. It also the case of the contrary, which means that the lower is the initial degree of saturation, the biggest the swelling is.
Figure 7. Relationship the degree of saturation and the swelling strain and the variation of compaction
Figure 8. Relationship the degree of saturation and the swelling pressure and the variation compaction
Similar behavior is observed in the swelling pressure. The high swelling needs high swelling pressure to bring it back to its initial condition before the swelling.
VI.
CONCLUSION AND
RECOMMENDATION
Conclusion1. The results of the test show that the highest swelling takes place to the water content (15.04%) with the swelling percentage of 38.04 at γdof 1.471 gr/cm3.
2. The results of the consolidation test show that the highest swelling pressure takes place to the initial water content (wo), which is 15.04 % with the
dry density (γd) of 1.471 gr/cm3, which is 2392
kPa.
3. The biggest is the initial water content, the smaller is the swelling. It is also the case of the contrary, which means that the smaller is the initial water content, the biggest the is swelling. 4. The highest is the solidity or the heavier the dry
density, the biggest of swelling is percentage. 5. The highest is the degree of saturation, the
smallest is the swelling. It is also the case of the contrary, which means that the lower the initial degree of saturation, the lower is the swelling. 6. It is necessary to get high swelling pressure to
bring the soil to its initial condition before the swelling.
7. The longest time necessary for the swelling process is 16 days, while the shortest time is 5 days.
Recommendation
1. It is necessary to conduct a study of different conditions with undisturbed soil samples of the same location that a comparison of the results may be made.
2. It necessary to examine the expansive soil using other testing method to broaden the insight of the
D
e
g
r
e
e
o
f
sa
tu
r
a
ti
o
n
,
S
o
(
%
)
Water content, wo(%) γd : 1.471 gr/cm³ γd : 1.397 gr/cm³ γd : 1.329 gr/cm³ γd : 1.250 gr/cm³ γd : 1.203 gr/cm³
S
w
ell
in
g
str
a
in
,
ε
(%
)
Degree of saturation, So(%)
γd = 1,471 gr/cm³ γd = 1,397 gr/cm³ γd = 1,329 gr/cm³ γd = 1,250 gr/cm³ γd = 1,203 gr/cm³ γd = 1,177 gr/cm³ γd = 1,143 gr/cm³ γd = 1,083 gr/cm³ γd = 1,023 gr/cm³ γd = 0,962 gr/cm³
Sw
elling
press
ure,
σ
'v
(%)
Sjafrudin Latar et al. Int. Journal of Engineering Research and Applications
www.ijera.com
ISSN : 2248-9622, Vol. 5, Issue 5, ( Part -2) May 2015, pp.51-56
determination of the swelling potential of the expansive soil.
REFERENCE
[1] ASTM, 2003, Annual Book of ASTM Standards, section 4, volume 04 08, Philadelpihia, USA.
[2] Chen, F. H, 1975, Fondation on Expansive Soil, Elsevier Science Publishing Company, New York.
[3] Das, B. M, 2008, Advanced Soil Mechanic,
Third Edition, Taylor & Francis Group, London.
[4] Hardiyatmo, H. C, 2010, Soil Mechanic I,