ESTIMATION OF DAMAGED AREAS DUE TO THE 2010 CHILE EARTHQUAKE AND
TSUNAMI USING SAR IMAGERY OF ALOS/PALSAR
Ni Made Pertiwi Jaya a, Miura Fusanori b, A. Besse Rimba c* a,b,c
Yamaguchi University, Graduate School of Science and Engineering, Disaster Prevention System Engineering, Ube City, Yamaguchi Prefecture, Japan 755-0097 – [email protected]; [email protected]; [email protected]
Commission VIII, WG VIII/1
KEY WORDS: Damaged Areas Estimation, SAR Imagery, ALOS/PALSAR, the 2010 Chile Earthquake and Tsunami
ABSTRACT:
A large-scale earthquake and tsunami affect thousands of people and cause serious damages worldwide every year. Quick observation of the disaster damage is extremely important for planning effective rescue operations. In the past, acquiring damage information was limited to only field surveys or using aerial photographs. In the last decade, space-borne images were used in many disaster researches, such as tsunami damage detection. In this study, SAR data of ALOS/PALSAR satellite images were used to estimate tsunami damage in the form of inundation areas in Talcahuano, the area near the epicentre of the 2010 Chile earthquake. The image processing consisted of three stages, i.e. pre-processing, analysis processing, and post-processing. It was conducted using multi-temporal images before and after the disaster. In the analysis processing, inundation areas were extracted through the masking processing. It consisted of water masking using a high-resolution optical imageof ALOS/AVNIR-2 and elevation masking which built upon the inundation height using DEM image of ASTER-GDEM. The area result was 8.77 Km2. It showed a good result and corresponded to the inundation map of Talcahuano. Future study in another area is needed in order to strengthen the estimation processing method.
* Corresponding author
1. INTRODUCTIONS
1.1 Background
Over the past two decades, the number of recorded disasters has doubled from approximately 200 to over 400 per year. Areas vulnerable to disasters are also expanding worldwide. According to the Hyogo Framework for Action 2005-2015 (HFA), disaster risk reduction should be made as an essential component of development policies and programs (UN/ISDR and UN/OCHA, 2008). In addition, disaster risk reduction, including disaster prevention, should be an integral part of social and economic development, if such development is expected to be sustainable. Priorities for Action also stated that in orderto achieve the HFA’s goals, it is essential to improve disaster related information.
Information about affectedareas immediately after a disaster is one of the most important steps in performing disaster prevention. Thishelps to estimate the scaleand impact of the disaster. However, disaster areas are typically very difficult to analyze from the ground due to obstacles and debris. Therefore on the ground investigations can take time and result in limited data. In suchcases, the application of geospatial analysis and spectral image processing using remote sensing data of satellite images is considered to be an effective technique to analyze disaster damage.
Remote sensing has become a suitable tool able to be used in crisis analysis. The availability of remote sensing data applicable for global, regional and local environment monitoring has greatly increased. Recently, space missions have not only developed Very High Resolution (VHR) optical images but also Synthetic Aperture Radar (SAR) images. The SAR transmits a microwave to the earth, day or night and
despite weather conditions, which irradiates the contours of the surface being analyzed. This can also be used to observe tidal movements. The images of SAR can be obtained easily and immediately after a disaster (Chini, et. al, 2013).
In 2006, Japan Aerospace Exploration Agency (JAXA) launched the Advanced Land Observing Satellite (ALOS) Phased Array type L-band Synthetic Aperture Radar (PALSAR) which has further improved the functionality and performance of a conventional SAR. It has also improved ground resolution with a wider observation mode thatis three to five times wider than the conventional SAR. SAR irradiates microwaves with a property that becomes strong in some conversely uneven surfaces and reflected bright on the image (Matsuoka and Yamazaki, 2000). The ALOS/PALSAR images can be used to extract images oftsunami disaster areas by integrating the image with optical data as the water mask and DEM data as the elevation mask (Iseki, 2013). According to previous researches of other tsunami events, the ALOS/PALSAR images showed a good result in extracting the tsunami inundation.
A tsunami is a series of large water waves produced by a sudden vertical displacement of water (Mc Cart, 2002). While rare, high-impact tsunamis have the potential to cause widespread destruction and affect hundreds of thousands. Chile is one of the seismically most active countries in the world with an earthquake of magnitude 8 or larger occurring every 10 years. The largest recent event was a magnitude 8.8 earthquake on February 27th, 2010. The earthquake triggered a tsunami that lost 500 people lives and caused major damage in some areas around the Chilean coast. One of the areas is Talcahuano which is located near the earthquake epicenter. Furthermore, the tsunami was recorded by tide gauges to radiate towards shores throughout the Pacific Ocean basin (Geist, 2010). In this study, ALOS/PALSAR data are used for extracting damaged areas ISPRS Annals of the Photogrammetry, Remote Sensing and Spatial Information Sciences, Volume III-8, 2016
caused by the earthquake and tsunami from the 2010 Chile earthquake. The damaged areas are the area which inundated and suffered damage by the tidal wave water.
1.2 Research Objectives
The objective of this research is to evaluate the method to extract tsunami inundation areas in Talcahuano due to the 2010 Chile earthquake using ALOS/PALSAR satellite images. The main purpose of the analysis is to enable disaster related agencies or institutions to perform a quick response on disaster prevention. Further, it is useful for creating hazard maps in the area.
2. METHODOLOGY
2.1 Research Scheme
It is generally difficult to make short-term assessment of the impact of a major natural disaster as the consequences may vary according to the spatial scale, the time interval leading up to and following the disasters, as well as other variable, which together make it necessary to have an enough time frame and a large amount of information from a broad number of areas in order to perform an accurate analysis.
In this regard, space-borne image of SAR is possible to estimate the damage caused by disaster phenomena immediately after the event (Cardenaz-Jiron, 2013). In order to evaluate the extraction method of space-borne images using ALOS/PALSAR, some disaster damage should be detected.
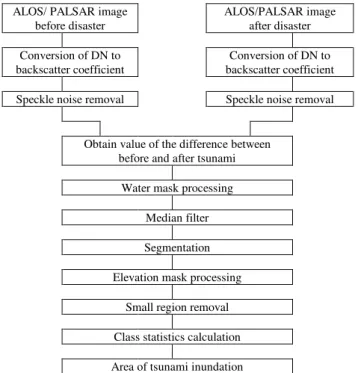
In this study, the analysis is done by grasping the reflection characteristics of the ALOS/PALSAR image before and after the disaster. Those images are used to extract tsunami damaged areas by applying some processes of image processing techniques. The flowchart of the method of tsunami inundation areas extraction using ALOS/PALSAR is showed in Figure 1.
ALOS/ PALSAR image before disaster
ALOS/PALSAR image after disaster
Conversion of DN to backscatter coefficient
Conversion of DN to backscatter coefficient
Speckle noise removal Speckle noise removal
Obtain value of the difference between before and after tsunami
Water mask processing
Median filter
Segmentation
Elevation mask processing
Small region removal
Class statistics calculation
Area of tsunami inundation
Figure 1. Flowchart of the method of the analysis of tsunami inundation using ALOS/PALSAR satellite images
2.2 Research Area
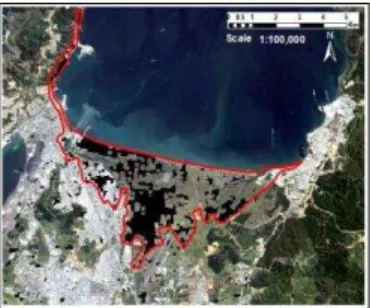
The study area is located in Talcahuano which is located near the epicenter of the 2010 Chilean earthquake. The area was also strongly affected by the earthquake and tsunami. Figure 2 below showed the research area using the true color imagery of the optical image of ALOS/AVNIR-2 with 10m resolution which is acquired on February 24th, 2007.
Figure 2. The research area
2.3 Data Source and Instrument
Materials of this research are ALOS/PALSAR images provided by JAXA as shown in Table 1, an ALOS optical image of Advanced Visible and Near Infrared Radiometer Type-2 (AVNIR-2), Digital Elevation Model (DEM) data of Advanced Space-borne Thermal Emission Reflectance Radiometer (ASTER) Global Digital Elevation Model (GDEM) and institutional map of inundation in Talcahuano, Chile. Software applications used in this research are ENVI 4.8 and ArcMap 10 on ArcGIS.
Sensor Before Tsunami
After Tsunami
Resolution Level
PALSAR 2009/3/11 2010/3/14 6.25m 1.5 AVNIR-2 2007/2/24 2010/9/4 10m 1B2
ASTER-GDEM
2007 - 30m -
Table 1. List of satellite data used in the study
2.4 Data Analysis
Image processing techniques for extracting tsunami damaged areas from ALOS/PALSAR consists of three stages, i.e. pre-processing, analysis pre-processing, and post-processing. In the analysis processing, the near-infrared (NIR) band data of ALOS/AVNIR-2 is used as a waters mask for creating data of water area. A DEM image is also used as elevation mask for creating data to integrate and improve the extraction accuracy. In addition, additional information such as the map information on computer analysis can be managed by a system which can be referred to the geographic information.
The processes in the pre-processing are geometric correction, speckle noises removal and conversion of the Digital Number (DN) value into backscatter coefficient. Images before and after the disaster after conducted the pre-processing will be used to obtain an absolute difference image. This is the first stage of the analysis processing. Then the image is used to extract tsunami damaged areas by applying some processes. These processes are ISPRS Annals of the Photogrammetry, Remote Sensing and Spatial Information Sciences, Volume III-8, 2016
segmentation process to divide water and another area, water mask processing to clearly show water areas in the image, median filter process for reducing some disturbances in the image, elevation mask processing to mask the image based on the tsunami inundation height, and very small region removal. After removing some very small regions which are not necessary, the area calculation can be done to obtain the area of tsunami inundation. The statistics calculation of the inundation area is conducted in the post-processing.
3. RESULTS AND DISCUSSION
3.1 Tsunami Inundation in Chile
Coastal Chile has a history of very large earthquakes. Since 1973, there have been 13 events of magnitude 7.0 or greater. The February 27th earthquake produced a tsunami that caused major damage locally over 500 km of coastline. The local tsunami water height and arrival times were influenced by bathymetry, coastal topography, aspect, fault slips, and localized subsidence and uplift due to the earthquake (Carderaz-Jiron, 2013).
In Talcahuano, the tsunami arrived 30 minutes after the earthquake with water flooding around the town coastline. Nonstructural damage was widespread; almost all exterior enclosures and contents of commercial buildings and industrial warehouses along the shorefront were damaged by the hydrodynamic loading of the flooding and debris field, and the commercial fishing facilities along the wharf were also rendered inoperable. Debris impact, particularly in the form of fishing vessels, shipping containers, and trucks, caused damage to masonry and steel-framed harbor buildings, though reinforced concrete structures were generally able to with-stand the battering. The piers at the Naval Base at Talcahuano were also damaged due to up-lifted large naval ships and barges (ITIC, 2015).
Scouring of shallow foundations caused a number of buildings to collapse. Sheet pile wharfs in Talcahuano Harbor collapsed or were damaged by soil failure induced by tsunami inundation and drawdown. Elevated pore pressures led to fluidization of backfill during tsunami inundation and drawdown, causing severe scour that damaged sheet pile wharf structures, machinery with shallow foundations, and soil-supported pavements. Eyewitness reports from dock-workers indicated that the majority of damage was caused by the tsunami. In addition, Chilean community had not been properly educated with signs for safety that caused hundreds people live were lost. An event report of the earthquake and tsunami event on February 27th, 2010 has been written by Impact Forecasting LLC. It reported the area of tsunami inundation in some regions of Chile including the area of Talcahuano (AON Benfield, 2010). There is also an inundation map provided by the government institution of Chile that is Secretaria Comunal de Panicacion, I. Municipalidad. According to the map, areas along the coast also showed as the tsunami inundation area in Talcahuano (Secretaria Comunal de PanicacionI, 2010). According to the historical tsunami events in Chile, the government has made hazard map of tsunami vulnerable areas. The map is created based on research results on tsunami analysis in the area. The latest map of the tsunami hazard map in the area of Talcahuano can be seen in Figure 3. The map shows areas of Talcahuano which are observed as tsunami vulnerable area. The areas consist of housing and public building areas, the port of the city and vegetated areas.
Figure 3. Real tsunami hazard map in Talcahuano area
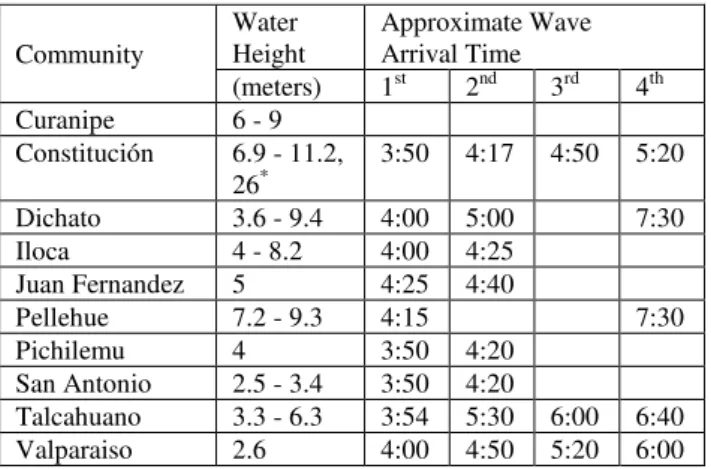
A conspicuous feature of the Chilean tsunami was its extreme variability in height, destructiveness, and wave arrival times as showed in Table 2. Local tsunami water height and arrival times were influenced by bathymetry, coastal topography, aspect, fault slips, and localized subsidence and uplift due to the earthquake. It was occurred on the February 27th, 2010 at 3:34 hours, local time in Chile (06:34 hours UTC). The first tsunami surges generally arrived less than 30 minutes after the earthquake. There were three or four distinct surges. The third or the fourth were typically the largest, arriving between 90 minutes and four hours after the earthquake.
Community
Water Height
Approximate Wave Arrival Time
(meters) 1st 2nd 3rd 4th Curanipe 6 - 9
Constitución 6.9 - 11.2, 26*
3:50 4:17 4:50 5:20
Dichato 3.6 - 9.4 4:00 5:00 7:30
Iloca 4 - 8.2 4:00 4:25
Juan Fernandez 5 4:25 4:40
Pellehue 7.2 - 9.3 4:15 7:30
Pichilemu 4 3:50 4:20
San Antonio 2.5 - 3.4 3:50 4:20
Talcahuano 3.3 - 6.3 3:54 5:30 6:00 6:40 Valparaiso 2.6 4:00 4:50 5:20 6:00
Table 2. Water heights and wave arrival times (NGDC, 2010)
3.2ALOS/PALSAR Images Processing to Estimate Tsunami Inundation Areas
The SAR raw images of ALOS/PALSAR before and after the tsunami disaster are displayed as black and white images, where the image brightness corresponds to the backscattered radar ISPRS Annals of the Photogrammetry, Remote Sensing and Spatial Information Sciences, Volume III-8, 2016
brightness. The brightness of the radar image is dependent on many properties of the objects that are scattering the radiation. There are three primary ways that radar waves scatter off the ground, i.e. rough surface scatter, diffuse scatter, and double bounce scatter. These different scattering mechanisms result in three vary different brightness in the imagery, from dark (rough surface), to medium brightness (diffuse), to bright (double bounce). The scattering mechanism depends also on the orientation angles and incidence angles, as well as the transmitted polarization of the radar. Factors that affect the dielectric constant can also affect the radar image brightness (Comer and Harrower, 2013).
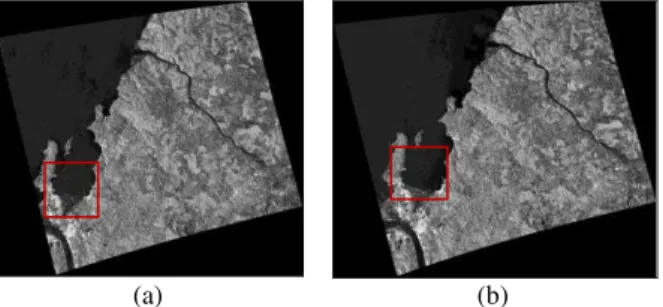
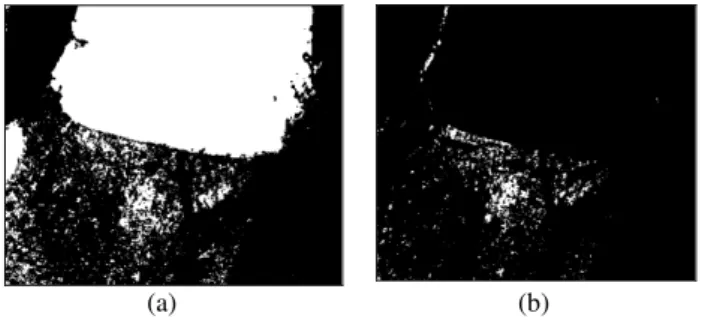
The PALSAR is an enhanced version of the Synthetic Aperture Radar on JERS-1 (L-band, HH-polarization, 35°off-nadir angle), like its predecessor, PALSAR was developed jointly by JAXA and the Japan Resources Observation Systems Organization (JAROS) (Rosenqvist, et.al, 2004). The PALSAR which is used in the research is the fully polarimetry SAR data of ALOS level 1.5. The raw images can be seen in Figure 4. The characteristics of the image are showed in Table 3.
(a) (b)
Figure 4. ALOS/PALSAR raw images: (a) Image before the disaster (2009/3/11) and (b) Image after the disaster (2010/3/14)
Mode Characteristics (Fine Image) Chirp bandwidth 28MHz
Polarization HH or VV
Incident angle 8 to 60deg. Range Resolution 6.25 to 44m Observation swath 40 to 70km
Bit length 5 bits
Data rate 240Mbps
NE σ° < -23dB (Swath Width 70km) < -25dB (Swath Width 60km)
S/A > 16dB (Swath Width 70km)
> 21dB (Swath Width 60km) Radiometric accuracy Scene: 1dB / orbit: 1.5 dB
Table 3. The characteristic of ALOS/PALSAR image (Rosenqvist, et. al, 2004)
3.2.1Pre-Processing
Firstly, a correction is necessary to get a corresponding image for the next processes. The image is not geometrically corrected due to the shapefile of Chile area. Therefore it was performed image to image registration using 10 Ground Control Point (GCP). In the image to image registration needs a base image as a correct image and a warp image that is the image which is going to be corrected. In this process, the high resolution image of ALOS/AVNIR-2 was used as the base image because the image is already correspond to the shapefile of Chile. The method of the wrapping process is 1st degree Polynomial with the resampling method of Nearest Neighbour. Based on the reference, this method required minimum 6 GCP with the RMS
(Root Mean Square) below than 1. The correction process for images before and after the disaster was done by using the method with 10 GCP and the RMS was below than 1. After that, images were resized according to the research area as shown in Figure 5 below.
(a) (b)
Figure 5. Result images of the registration and resize process: (a) Image before the disaster and (b) Image after the disaster
The values of each pixel in a SAR image file are usually calibrated such that the pixel value in unit of “radar cross section”. These values are recorded in the SAR data file integers or floating point numbers, which can be converted to radar cross section in decibels (dB) through a calibration factor often provided with the data. Since there is a strong preference for most of the energy to reflect away from the radar due to the side-looking geometry, the observed ratio is almost always less than one. The dB values are therefore usually negative, typically ranging from -5 dB (bright) to -20 dB or less (dark) (Comer and Harrower, 2013).
Calibration of ALOS/PALSAR backscattering on the image was done through the equation of Sigma Nought (σ°) described as follows (Shimada, 2007):
σ° = 10 log10 (DN²) + CF (1)
where:
DN : Value of Converted Brightness CF : Calibration Factor, that is -83
The result of normalized images by applying the backscatter equation of ALOS/PALSAR images (1) can be seen in Figure 6.
(a) (b)
Figure 6. Result images after backscattering processing: (a) Image before the disaster and (b) Image after the disaster
Speckle noise removal was done by applying a filtering process that is Lee filter to reduce the interference with the radar image and soften the image. Figure 7 shows the result images after removed speckle noise through filtration process. The following is the equation for the speckle noise removal (Dewantoro and Nur, 2012):
(|Xa - Xb|²) (2)
where:
Xa : Estimate of the filtered image
Xb : The intensity of the image that does not exist speckle (un-speckle).
(a) (b)
Figure 7. Result images after speckle noise removal: (a) Image before the disaster and (b) Image after the disaster
After carried out the speckle noise removal, images became darker but it showed the detail of the image clearer. Then, the calibration process made images became brighter or looked the same as the colour of the raw images. Images also had some values below and above 1 indicated the backscatter value. Darker areas contained value below 1 or minus which can be interpreted as water areas, such as sea water, river, or prospective inundation. While brighter areas contained value above 1 or positive which can be interpreted as vegetation, land or other areas. According to the pre-processing, images were corrected geometrically, filtered from noises and calibrated to get images with appropriate and clear appearance contained backscatter value. The images were then used for the analysis processing.
3.2.2Analysis Processing
First stage of the analysis processing is to find the absolute difference between images before and after the tsunami disaster. The image is obtained by subtracting the pre-processed image after and before the disaster as can be seen in Figure 8. In the image, the rubble area shows positive value otherwise the inundation area shows negative value, and the others are non-affected area.
Figure 8. The absolute difference image of images before and after the disaster
A histogram is also can be derived from the image result. It is created from the statistics calculation of the image values. Figure 10 shows the histogram of subtraction result image from the image before and after the disaster after the pre-processing which is the absolute difference image. It also shows image histograms from the pre-processed images. These two images have some differences because of some changes due to the disaster. The pre-processed images possess many changing values so that there are some changing points which might be
refer as a threshold value. This value is applied to an image in order to classify or segment images into two different areas. However, the threshold value is observed clearly in the absolute difference image. It is used for the segmentation process. Mask processing of water area was conducted before segmented the image into some areas. This process is conducted in order to omit water areas, i.e. sea water and river. Therefore the image values which indicate water areas might be the inundation areas. The pre-disaster image of AVNIR-2 band 4 (Near Infrared band) was used as a mask of water area. The first step of mask processing was created a range value of water areas. In general, the value of water areas is ranging among the percentage of cumulative frequency of 20% to 60%. Thus, some range values which lied at those percentages were used. The best range was given by the value of the percentage of 45% which ranged among 1-41. The value of percentages below it showed small areas of water. In the other hand, the bigger percentage values gave too large water areas. The water mask was created by using the range value of water areas. The mask of water body has value only of 1 (white area) and 0 (black area). The area which has values among the range values of water areas will turned into black colour with the value of 0. These areas are the area of sea water and river which will not be included in the inundation area calculation.
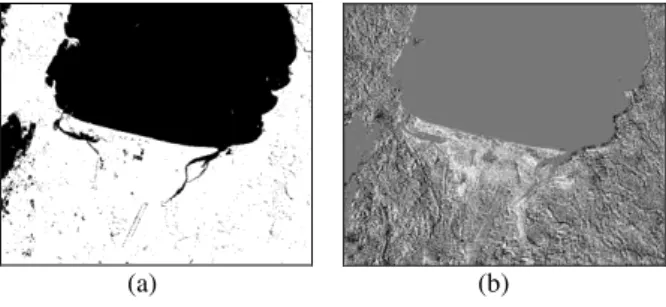
The mask of water body that has been built was then applied to the ALOS/PALSAR image to deplete the value of the water areas. It is necessary to adjust the resolution of the mask image and the image which will be masked. It can be carried out by using the function of Layer Stacking in ENVI 4.8. By applying the mask, areas which have value of 1 are left with the original raster value of the original image, but areas which have the mask value of 0 will also have the value of 0. The mask and the image result after the masking process are shown in Figure 9.
(a) (b)
Figure 9. The water mask processing: (a) Water mask and (b) Image result after the water mask processing
Median filter processing was then conducted in order to highlight the edge of the extraction target. The object was filtered in the N x N pixels with the filter size of 21 x 21 in this study (N=21). It was carried out to the image result after the mask processing. This filter size is used because it gave the best appearance of the image. The edge of the extraction target areas which might represent inundation areas can be observed visually from the image. All of the small parts which represent same areas or have same interpretation are gathered. Therefore, generally this process makes images easier to be segmented into two or three areas, i.e. water and another area.
The segmentation process was performed using the threshold value obtained from the image histogram after the median filter processing. This process is conducted to extract the region of interest in the image. In order to accurately extract a target region, the determination of the threshold which separates the target area and the background area is important. Based on the statistics calculation data of the image, the segmentation result ISPRS Annals of the Photogrammetry, Remote Sensing and Spatial Information Sciences, Volume III-8, 2016
by using the threshold value of 1.99 at the percentage of 50% was given a good segmentation result. While other percentage values were not giving appropriate image results. The segmentation image result is showed in Figure 10 below.
Figure 10. The binary image result of water and other areas
In order to obtain the damaged areas according to the area elevation, the mask processing of DEM should be applied to the image. This process is done by creating and applying a range of elevation which refers to the tsunami inundation height. The areas which have elevation correspond to the tsunami inundation height are considered as damaged areas cause by the disaster. An exact result of damaged areas can be derived by applying the DEM mask to the binary or segmentation image result. Even though the segmentation image result was already segmented the image into damaged areas and another area, but some areas might be or might not be damaged areas regarding to the area elevation. Some areas which lied at the elevation range will be included as the damaged areas. In the contrary, some areas which are not represented the elevation range will be excluded as the damaged areas. The mask and the result image after the mask processing are showed in Figure 11 below.
(a) (b)
Figure 11. The elevation mask processing: (a) Elevation mask and (b) Image result after the elevation mask processing
The ASTER GDEM was used to create the elevation mask. Firstly, the DEM image was resized according to the research area. Based on the data of Table 2, the water height in Talcahuano was among 3.3-6.3 m (NGDC, 2010). By obtaining the horizontal profile of the DEM image, the elevation range of 1-7 m was created to represent the area elevations which are considered damaged as tsunami inundation areas. In this mask processing, the mask areas which have values among the elevation range were set to have the original raster value of the original image or the value of 1. Otherwise areas which were not at the elevation range will have the value of 0. It is necessary to adjust the resolution too before the mask image will be applying to an image. The image result after the mask was applied will showed the areas at the elevation range in white colour with the original raster value of the original image. In the other hand, other areas were in black colour with the value of 0.
Masking is the most important process to extract the damage area. A mask in image mask is a way to mask out pixel from image. Those pixels are might not need to induce or visualize in the analysis. In this case, to obtain the damage area of inundation, water area and elevation have to represent clearly in the image. Therefore, masking process is necessary for water and elevation. The area of water which does not water area based on the water mask can be considered as inundation area. Also for the elevation mask, areas which are located on the elevation below the range of the inundation height can be considered as the inundated area. Those two masks give a good image result of inundation areas.
In this processing, a process called resampled should have to conduct before applying a mask into an image. The resample process is done by the function of layer stacking in ENVI in order to adjust the resolution of the mask and the image which will be masked. The range for creating the mask also has to determine exactly. For the water mask, the threshold can be obtained from the histogram of the image where the threshold value can be considered as the point where there is a significant change of the image. On the other hand, the range for DEM mask refers to the inundation height in Talcahuano.
3.2.3 Post-Processing
The post-processing consisted of the contraction and expansion processing followed with the statistics calculation of damaged areas. The contraction and expansion process is used to exclude small region which is not necessary in the area calculation. In this study, the process is done by applying 1 time of closing-opening and 1 time of erode-dilate function on ENVI software. In these processes, if the pixel density values in the filter is 1 when it is multiplied by the filter, then this technique is used for converting a pixel of interest to be 1 (Iseki, 2013). The contraction and expansion processes were carried out by performing the morphology method of Closing and Opening. The closing process was performed in the size of 21x21 (N=21). Further, the opening process was performed in the size of 3x3 (N=3) to recover expansion process. The statistics result is showed in Table 4 and the result image can be seen in Figure 14.
Digital Number*)
Opening Process Closing Process
Pixel % Pixel %
0 4727793 95.43 4727793 95.47
1 226200 4.57 224577 4.53
Total 4953993 100 4953393 100
*)
The Digital Number (DN) of 1 is the extraction result of damaged areas and the DN of 0 is another area.
Table 4. Image statistics results of the post-processing
(a) (b)
Figure 14. Result images of the contraction and expansion processing: (a) Closing and (b) Opening ISPRS Annals of the Photogrammetry, Remote Sensing and Spatial Information Sciences, Volume III-8, 2016
The total area of damaged areas can be calculated based on the statistics result of the image. Considering the resolution of ALOS/PALSAR images that is 6.25 m, the total area of 1 pixel can be calculated as 6.25 m x 6.25 m = 39.1 m2. The image result after performed closing followed by opening process was used to obtain the total area of damaged areas. According to the statistics calculation result, the amount of pixels for the damaged area extraction is 224,577 pixels. The tsunami damaged areas is the pixels amount of the extraction result with the total area of 1 pixel image, that is 224,557 pixels x 39.0625 m2 = 8,771,757.8125 m2, or equal to 8.77 Km2.
3.3 Analysis of the Tsunami Damaged Areas .
The damaged areas caused by the 2010 Chile earthquake and tsunami can be simply observed from the high resolution optical image of ALOS/AVNIR-2. There are differences which can be obtained by applying the true-colour composite on optical images before and after the disaster. The true-colour image is the same image as can be seen by the human eye. This method can be used to represent the image close to its natural shades. The following images show the differences between before and after disaster by obtaining optical images of ALOS. Figure 15 below shows differences which can be obtain visually from the true-colour composite images of of ALOS/AVNIR-2.
(a)
(b)
Figure 16. True-colour composite of optical images of ALOS/AVNIR-2: (a) Image before the disaster (2007/2/24) and
(b) Image after the disaster (2007/9/24)
The differences between the two images are considered as the damage areas caused by tsunami. Areas such as the area along the coast showed that the area was in black colour in the after image while it was red in the before image. Areas around the airport also showed some black in the after image.
However optical data sometimes give images which consist of clouds due to high condensation during the period. In this case the use of PALSAR data should be considered as a good alternative for disaster monitoring. SAR satellite systems have provided a wealth of information on Earth observation since the last two decades. Indeed, SAR has become the premier sensor for the coverage necessary to observe some phenomena because it is sensitive to small surface roughness changes on the order of the radar wavelength. It is also independent of solar illumination and is generally unaffected by cloud cover. In addition, SAR has the advantage of providing control over such factors as power, frequency, phase, polarization, incident angle, spatial resolution and swath width, all of which are important
when designing and operating a system for the extraction of quantitative information (McCandless and Jackson, 2004). Interpreting a radar image is not a straightforward task. It very often requires some familiarity with the ground conditions of the areas imaged. Image processing and analysis techniques have been developed to aid the interpretation of remote sensing images and to extract as much information as possible from the images. The choice of specific techniques or algorithms to use depends on the goals of project. Since the PALSAR image is a SAR imagery which cannot observe visually like an optical image, more processes are needed to obtain damage areas. In this study, the method consists of three steps, i.e. pre-processing, analysis processing and post-processing.
The result of the ALOS/PALSAR images processing to estimate inundation areas showed that the area of inundation is located along the areas near the coast line. An overlay image of the extraction result on the optical image is shown in Figure 16. It is made to be able to see the distribution of damaged areas along the coast clearly. The areas were damaged by the earthquake which triggered tsunami. It caused the areas covered by sea water which represented the area of inundation. The inundated areas were housing areas, part of the city harbor, part of the airport base, and some vegetation.
Figure 16. Overlay image of the ALOS/PALSAR extraction result of damaged areas on the ALOS/ AVNIR-2 (true-colour)
Compare with the field survey result, the distribution of the damaged areas showed the same areas. This area belongs to coastal area, vegetation, housing, port and airport of the city. As reported, the February 27th earthquake and tsunami events affected highly populated areas of Chile, causing some severe but relatively localized damages in 45 towns covering an area 600 km, north to south, and 100 km from the Pacific inland to the east. A damage map of tsunami inundation due to the 2010 Chile earthquake in Talcahuano is shown in Figure 17.
Figure 17. The inundation map of Talcahuano (Creixell, et.al, 2010)
However, the result image is seen patchy. The water might not appear as inundation in images which are used in this study due to the distance of times of the disaster and the image. The PALSAR image after the disaster that was used in the study is acquired on March 14th, 2010. It means that the image is taken around two weeks after the disaster event on February 27th, 2010. Although there was a distance of times between the image and the disaster event, the PALSAR image is able to use in extracting damaged areas caused by the tsunami. The image result showed that tsunami damaged areas is mostly located along the coastal area. Besides the observation date of the image, the DEM data that was used to mask the image is also affected the image result. A higher resolution of the DEM image should be given clearer appearance of damaged areas on the image. Instead of the lack of the data related to the 2010 Chile earthquake and tsunami, the extraction method attained corresponding result according to the damage map of tsunami inundation in the area. Thus, the method could be an alternative to estimate damaged areas caused by the inundation of sea water, in the case field observation or investigation is difficult to perform in the area.
4. CONCLUSION
4.1 Conclusion
The estimation of damaged areas using SAR imagery of ALOS/PALSAR consists of pre-processing, analysis processing and post processing. In the pre-processing, images before and after the disasters are corrected and resized according to the research area, then calibration into backscatter coefficient and speckle noise removal are applied to images. In the analysis processing, the first process is to get the absolute difference image from the image before and after the disaster. It is followed by processes such as water masking, segmentation, median filter, and elevation masking to extract the distribution of damaged areas on the image. The last process of post-processing is the contraction and expansion process followed by statistics calculation of the damaged areas.
The result showed that inundation areas were distributed along the coast, area near the airport and some parts around river. The area result is 8.77 Km2. The extraction result corresponded to the institutional inundation map of Talcahuano, although there are differences in the distribution of damaged areas.
4.2 Suggestion
Future study is needed in order to evaluate the method of the analysis, such as examine the difference between satellite remote sensing result and in situ observation, try to analysis other events, and use a higher resolution of DEM data to get more obvious result image.
ACKNOWLEDGEMENTS
The author would like to grateful the JAXA as data provider and the Ministry of National Education of Indonesia as the financial supporter through Beasiswa Unggulan Scholarship.
REFERENCES
AON Benfield., 2010. Event Recap Report: 02/27/10 Chile Earthquake. Chicago: Impact Forecasting LLC.
Cardenaz-Jiron, L A., 2013. The Chilean Earthquake and Tsunami 2010, A Multidisciplinary Study of Mw 8.8, Maule. United Kingdom: WIT Press, 41 p.
Chini, M., Alessandro P., Francesca R. C., Stefania A., Rosa N., and Paolo M. D. M., 2013. The 2011 Tohoku (Japan) Tsunami Inundation and Liquefaction Investigated Through Optical, Thermal, and SAR Data. IEEE Geoscience and Remote Sensing Letters, 10 (2): 347-351.
Comer, D. C. and Harrower, M. J., 2013. Mapping Archaelogical Landscapes from Space. New York: Springer, p. 122-126.
Creixell, C., Blanco, N., Falcón, M.F., Vás., 2010. Mapas de Inundación por tsunami del 27 de febrero de 2010. http://tienda.sernageomin.cl/TiendaVirtual/ProductDetail.aspx? pid=2102. Acessed on November 30th, 2015.
Dewantoro, M. D. R. and Nur M. F., 2012. ALOS PALSAR Image for Landcover Classification Using Pulse Coupled Neural Network (PCNN). International Journal of Advanced Research in Computer and Communication Engineering: 1 (5): 289-294.
Geist, E., 2010. The 2010 Chilean Tsunami and Uncertainty in Tsunami Modeling. United States of America: United States Geological Survey (USGS).
Iseki, S., 2013. Extraction of Disaster Domain caused by the 2011 Tohoku Earthquake Tsunami Disaster Using the ALOS/PALSAR Images (thesis). Yamaguchi: Yamaguchi University, 59 p.
ITIC, 2010. 27 February 2010, MW 8.8, Off Central Chile. http://193.191.134.38/itic/index. Acessed on November 30th, 2015.
Liew, S. C. 2001. Principles of Remote Sensing. Singapore: Center for Remote Imaging, Sensing, and Processing (CRISP), National University of Singapore.
Matsuoka, M. and Yamazaki F., 2000. Use of Interferometric Satellite SAR for Earthquake Damage Detection. California: Proceedings of the 6th International Conference on Seismic Zonation.
McCandless, S. W. Jr. and C. R. Jackson, 2004. Principles of Synthetic Aperture Radar. United States of America: Radar Imaging Resources. p. 1-23.
Mc Cart, D., 2002. Tsunamis. Philadelphia: Lippicott William and Wilkins, p. 29-34.
NGDC, 2010. NOAA/WDC Historical Tsunami Data Base. United States of America: National Geophysical Data Center.
Rosenqvist, A., Masanobu S., and Manabu W., 2004. ALOS PALSAR: Technical Outline and Mission Concepts. 4th International Symposium on Retrieval of Bio- and Geophysical Parameters from SAR Data for Land Applications. Austria.
Secretaria Comunal de Panicacion, 2010. Inundation Map of Talcahuano. Chile: I. Municipalidad.
Shimada, M. 2007. ALOS User Handbook. Japan: Earth Observation Center, Japan Aerospace Agency.