www.geosci-instrum-method-data-syst.net/4/89/2015/ doi:10.5194/gi-4-89-2015
© Author(s) 2015. CC Attribution 3.0 License.
A high dynamic radiation measurement instrument:
the Bolometric Oscillation Sensor (BOS)
P. Zhu1, M. van Ruymbeke1, Ö. Karatekin1, J.-P. Noël1, G. Thuillier3, S. Dewitte2, A. Chevalier2, C. Conscience2, E. Janssen2, M. Meftah3, and A. Irbah3
1Royal Observatory of Belgium, Av. Circulaire 3, B1180 Bruxelles, Belgium
2Royal Meteorological Institute of Belgium, Av. Circulaire 3, B1180 Bruxelles, Belgium 3LATMOS, 4 place Jussieu 75252 Paris CEDEX 05, France
Correspondence to:P. Zhu ([email protected])
Received: 5 August 2014 – Published in Geosci. Instrum. Method. Data Syst. Discuss.: 3 December 2014 Revised: 1 April 2015 – Accepted: 24 April 2015 – Published: 8 May 2015
Abstract. The Bolometric Oscillation Sensor (BOS) is a broadband radiation measurement instrument onboard the PICARD satellite that was active between 2010 and 2014. The main detector is a thermistor attached black coated sur-face, which was permanently exposed to space without any optical and aperture accessories. The temperature measure-ments are used within a transfer function to determine vari-ations in incoming solar irradiance as well as the terrestrial radiation. In the present article, the measurement principle of the BOS and its transfer function are presented. The per-formance of the instrument is discussed based on labora-tory experiments and space observations from the PICARD satellite. The comparison of the short-term variation of to-tal solar irradiance (TSI) with absolute radiometers such as VIRGO/SOHO and TIM/SORCE over the same period of time suggests that the BOS is a relatively much simpler but very effective sensor for monitoring electromagnetic radia-tion variaradia-tions from visible to infrared wavelengths.
1 Introduction
The SOlar VAriability experiment for the PICARD mission (SOVAP) is one of the three instruments constituting the solar payload of CNES’s PICARD microsatellite (Thullier et al., 2006). It is composed of a DIARAD-type absolute ra-diometer (Dewitte et al., 2004) and the Bolometric Oscilla-tion Sensor (BOS) (van Ruymbeke et al., 2010, 2011), which measure the incoming radiation with sampling frequencies of 180 and 10 s respectively. The main requirement for the
BOS was to provide stable and precise measurements of the incoming electromagnetic radiation over the broad spectrum with a high 10 s cadence. The short-term solar irradiance variation from seconds to minutes remain less studied due to the nature of operation sequences of absolute radiome-ters. The sensing unit is usually operated in an opening and closing sequence. In order to reach the thermal radiation power equivalent, the exposer and closer time are dependent on the instrument structure itself. In general, one measure-ment takes at least 1 min. The high-frequency measuremeasure-ment is strictly limited by it. In order to study some typical events, like the solar oscillation modes, the solar eclipses, the solar white flares, and the transit of other planets, high sampling data are preferred. The BOS sensor is developed to meet such requirements.
mis-Figure 1.The PICARD satellite and SOVAP experiment. The BOS is integrated into the same unit with DIARAD (photo credits: CNES).
Figure 2.The sketch of the BOS. The detector (m1) is connected to the heat sink (m2) by a thin shunt, which is thermally isolated fromm2
by multi-layer isolation (MLI). The instrument unit is installed in the front panel of the spacecraft through a high thermal resistance Vespel® layer.
sion was extended for 1.5 years. PICARD has three exper-iments: SODISM (Meftah et al., 2014a) measures the di-ameter of the Sun, while PREMOS (Schmutz et al., 2013) and the SOVAP (Zhu et al., 2010; Meftah et al., 2014b) measure the total and spectral solar irradiance (Fig. 1). The BOS as a part of the SOVAP experiment has acquired data quasi-continuously over the 3.5 year mission duration. BOS data are archived and publically available on the website (http://picard-bos.oma.be).
In the next section the measurement principle of the BOS and its geometry are presented. Reduction of the electronic common mode and background ambient thermal noise is discussed in Sect. 3. The laboratory experiment and the flight performance of the instrument are respectively pre-sented in Sects. 5 and 6. The space observation results are then compared with absolute radiometers VIRGO/SOHO and TIM/SORCE.
2 Operating principle and geometry
The measurement principle of the BOS is a combination of a thermistor-based bolometer and a pyrometer. The basic ge-ometry is a cylinder where the heat flux measurement is re-alised through temperature measurements at thermal nodes (Fig. 2, left). The team has tested a number of prototypes before opting for this flying model (Fig. 2, right) (van Ruym-beke, 2006).
The working principle of the BOS is quite straightfor-ward. The light mass (m1) absorbs and re-emits a broadband wavelength electromagnetic radiation from space. The heav-ier mass (m2) absorbs less energy and re-emits most energy caught bym1andm2back into space.
According to the thermal node analysis method, the ther-mal network of the BOS is approximated by the temperature at two diffusion nodesT1 andT2. Mathematically, the tem-perature of the diffusion node is modelled by the expression (K & K Associates, 2000)
6Q−CdT
dt =0, (1)
with6Qthe sum of the thermal energy of the network, and Cthe thermal capacitance. The instrument is thermally insu-lated from the outside with a high thermal resistance Vespel® layer. Supposing a constant temperature of the environment, the diffusion node can be approximated by
6Q=αs1Qin−ǫs1σ T14−K1T , (2) whereαandǫare the absorption and emissivity coefficients of the black coating,Qinthe incoming electromagnetic radi-ation,s1the surface area of massm1,σ the Stefan–Boltzman coefficient,K=kA/Lthe thermal conductance,kthe ther-mal conductivity of the shunt,AandLthe surface area and length of the shunt,1T =T1−T2the difference betweenT1 and the temperature measured under the black surface, and T2the temperature at the bottom end of the shunt (Fig. 2). The effect of the electronic common mode as well as the background ambient thermal noise are discussed in the next section.
From Eqs. (1) and (2), we can find a numerical solution of Qinwith the values of two temperature measurements:
Qin= 1 αs1
(ǫs1σ T14+K1T+C dT1
dt ). (3)
Since the sensing surface ofm1is directly exposed to space with a hemispherical field of view (HFOV), it absorbs all electromagnetic radiation by principle. We use the Mini Be-taCURVE polymide NTC (negative temperature coefficient) thermistor component as temperature detectors. These com-ponents were calibrated by measurement specialities. The thermistor resistance at 25◦C is 100 K. The tolerance of the beta value is ±0.5 % at 25◦C (Measurements techni-cal specialties®data sheet; Measurements specialties, 2005). Two electronic interfaces (EI) are separately connected to each thermistor. The V2F digital counting of each EI has a 120 dB dynamic bandwidth covering the T1 working tem-perature range between −30 and 60◦C. The instrument is designed to be automatically off when the T1 is out of this range. With such a large dynamic range, the resolution of the temperature measurement can theoretically reach 90 µ◦ (90×10−6◦C).
3 Reducing the electronic common mode and background ambient thermal noise
The common mode is usually indicating the noise induced by the amplifier of electronics. Here, it is referred to as the electronic common mode (ECM).
In order to limit the overheating by the Joule effect, two re-sistances (74 KforT1and 82 KforT2) are wired in series with NTC thermistors. The amplifier is separately applied to the output voltage of the first thermistor and to the volt-age difference between the first and second thermistors. This configuration is essentially increasing the resolution of tem-perature difference measurements and reducing the ECM by a common electronic interface rather than individually count-ing the output of two NTC thermistors (van Ruymbeke et al., 2010).
The instrument package was installed at the front Sun-pointing panel of the PICARD satellite and fixed with six screws. Each screw was surrounded by a layer of Vespel®, which has a very low thermal conductivity co-efficient (0.005 W cm−1K−1) (Vespel technical information (Miller, 2000)). The mass ratio betweenm2 and the main sensing unitm1 is as high as 200. In addition, the energy absorbed by the black coated surface s1 is 2 times higher than the white painted surfacem2due to its strong reflectiv-ity to visible radiation (Zhu et al., 2012). All these factors guarantee that the heat flux direction is from the main de-tectorm1 along the isolated shunt towards the junction be-tween the shunt andm2during the Sun observation nominal phase. The surrounding ambient thermal noise is damped by the heat sink (m2). The temperature measured atT2has been slowly changing over the mission and can be considered to be a stable reference for short-period thermal modulation.
4 Laboratory thermal vacuum test
Table 1.Laboratory experiment results.
Experiment T1(K) 1σ T2(K) 1σ T1−T2(K) 1σ F(Wm−2) 1σ
1 294.888 0.005 294.469 0.004 0.423 0.001 83.6 0.08 2 294.906 0.004 294.482 0.005 0.423 0.001 83.9 0.09 3 294.904 0.010 294.487 0.007 0.423 0.002 83.9 0.10 4 294.909 0.008 294.494 0.003 0.423 0.001 84.0 0.10 5 294.884 0.010 294.473 0.003 0.423 0.002 83.7 0.09 6 294.880 0.009 294.465 0.005 0.423 0.001 83.8 0.10 7 294.891 0.007 294.471 0.006 0.423 0.001 83.9 0.09 8 294.911 0.006 294.495 0.002 0.424 0.001 84.0 0.10
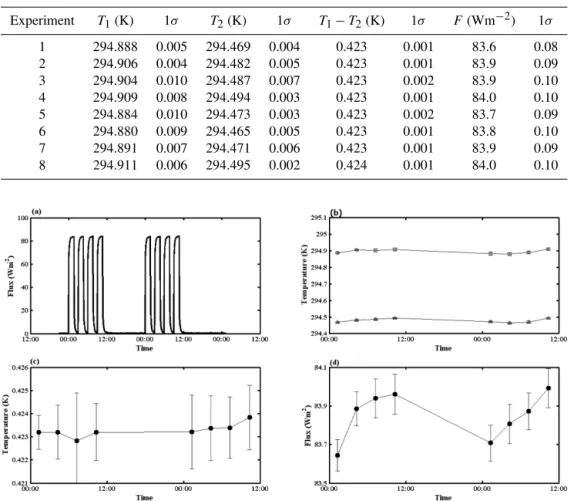
Figure 3.The instrument was tested in a temperature-controlled clean room.(a)Eight cycles of an on/off radiation source.(b)Temperatures of T1 and T2 measured around the peak of each cycle.(c)The temperature difference T1–T2.(d)Flux computed from temperatures T1 and T2.
it produces a very homogenous UV–VIS–NIR radiation. The radiation source generated by Labsphere arrived at the front transparent optical window of the vacuum tank after passing through a 1 cm aperture. The source is set to be automatically ON/OFF for eight measurement cycles. The duration of each measurement cycle is 99 min, which is approximately the or-bital period of PICARD (Fig. 3a).
The T1 and T2 temperatures were recorded with a pe-riod of 10 s for the eight repeated measurement cycles. The mean value and the standard deviation (1σ) of T1 are 294.897±0.007 K,T2is 294.480±0.004 K, and the temper-ature difference(T1−T2)is 0.423±0.001 (Fig. 3b, c). The flux is calculated with Eq. (3) from the measurements ofT1 and T2. The mean value and the standard deviation of the relative flux are 83.9±0.1 Wm−2. The 1σvalue of tempera-ture is at the level of milli-Kelvin, and that of the heat flux is about one-tenth of Wm−2(Table 1). The signal shows a clear diurnal cycle variation in temperature and, more evidently, in flux (Fig. 3d).
5 Observations from space
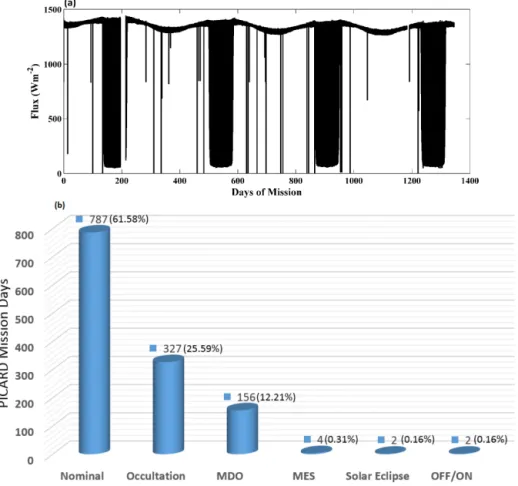
The BOS sensor onboard the PICARD microsatellite was switched on on 28 June 2010. It has been continu-ously recording since then with a 10 s cadence. The to-tal duty cycle of BOS observation is 1278 days. The com-plete space-acquired level 2 data set in Wm−2 is plot-ted in Fig. 4a. The global data set is categorised accord-ing to the physical origin of the signal (Fig. 4b). The complete full sampling data are published and accessible through the website: http://idoc-picard.ias.u-psud.fr/sitools/ client-user/Picard. The nominal mode represents the data when the sensor is only receiving the solar and terrestrial ra-diation at an altitude around 725 km. During satellite occul-tations, the BOS sensor looks through the upper atmosphere to the Sun until its vision is completely blocked by the Earth. This happened every year between the beginning of Novem-ber and mid-February.
Figure 4.Observations during the entire PICARD mission.(a)Level 2 thermal flux.(b)Data partition according to its physical origin; unit is the day. Nominal: the measurements without any special operation. Occultation: observation during the satellite occultation by the Earth; it is related to the orbit of PICARD. MDO (MOde Distortion): the satellite is rotating along its Sun-pointing axis. MES (ModE Stellar): the Sun-pointing axis is turning away to a star. OFF/ON: the SOVAP experiment is switched off and on to test the electrical ground.
Table 2.MES calibration validation.
Date T1(K) 1σ T2(K) 1σ T1−T2(K) 1σ F(Wm−2) 1σ
2010/10/06 299.4 0.13 301.4 0.13 −2.226 0.0091 1411.9 0.65 2010/11/09 301.8 0.13 303.6 0.13 −2.256 0.0068 1388.0 0.43
2011/05/04 302.7 0.09 304.8 0.12 −2.286 0.0037 1389.5 0.77 2011/05/30 302.4 0.19 304.5 0.11 −2.278 0.0040 1370.9 4.70 2011/10/01 305.4 0.14 307.5 0.14 −2.379 0.0036 1371.5 0.86 2011/10/24 305.9 0.12 308.1 0.13 −2.381 0.0036 1378.6 0.49 2012/03/19 306.5 0.13 308.7 0.13 −2.388 0.0031 1372.0 1.19
2012/03/24 306.4 0.13 308.6 0.13 −2.386 0.0037 1371.5 2.59 2012/04/24 305.7 0.13 307.8 0.14 −2.362 0.0080 1365.2 3.62
2012/05/25 304.4 0.10 306.5 0.13 −2.323 0.0023 1369.7 1.88 2012/07/15 304.5 0.13 306.6 0.13 −2.318 0.0103 1351.7 5.15 2012/07/22 304.7 0.13 306.8 0.13 −2.331 0.0077 1355.2 2.57 2012/10/13 307.2 0.13 309.4 0.13 −2.419 0.0078 1361.8 1.04 2012/10/19 307.4 0.13 309.6 0.13 −2.419 0.0087 1368.7 0.83 2012/11/09 308.1 0.15 310.1 0.15 −2.422 0.0068 1343.7 0.30 2013/03/11 308.4 0.13 310.5 0.14 −2.424 0.0096 1360.4 0.91
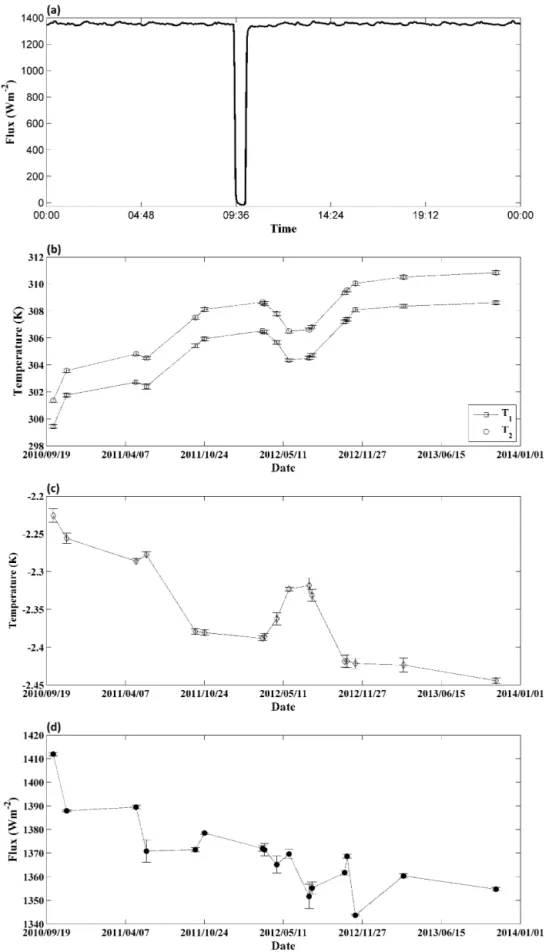
Figure 5.Star-pointing events (MES) observed in space.(a)One example of MES events.(b)T1andT2of all MES.(c)The temperature
Figure 6.Decrease in the instrument sensitivity as obtained from the global data set(a)and from MES(b).
the star-pointing mode, in which the sensing unit was point-ing to a star in deep space. The observations durpoint-ing MES are important for the calibration of all payload instruments. During the entire PICARD lifetime, there have in total been 22 MES operations. We consider 17 of them for the in-flight calibration of the BOS, excluding those with an abnormal positive minimum, observed inside the occultation period of 2013. The cause of the anomaly is still under investigation.
Contrarily to the laboratory experiment, the temperature is measured around the minimum value during MES (Fig. 5a), because it is like an OFF/ON of a radiation source and the laboratory experiment is an ON/OFF process of light. When the MES was started, the sensor passed a process.
During the MES, at the beginning, the sensor is still receiv-ing solar energy. When the satellite is turnreceiv-ing away from the Sun to a star, the energy is gradually decreased until it does not receive solar energy at all. The small valley around June to July in the records of T1andT2(Fig. 5b) and the corre-sponding plateau presented in Fig. 5c are due to the variation of solar and terrestrial radiation modulated by the Sun–Earth orbit distance change. Such effects are reduced by normal-ising the calibrated flux in a unit distance 1 AU and correct velocity effects (Fig. 5d).
From 17 MES events, the mean value and the standard deviation of T1 are 305.3±0.13, T2 307.4±0.13 K and, (T1−T2),−2.356±0.006 K; the value of the calibrated flux F is 1369.7±1.68 Wm−2(Table 2). The uncertainties ofT
1 andT2are 2 orders and the fluxF 1 order higher than during the laboratory experiment. Only the temperature difference T1−T2shows a similar level error budget to the results of the laboratory experiment (Table 1).
The variation of the flux received by the BOS was mod-ulated by the Sun–satellite distance which can be corrected using the knowledge of the position and attitude of the satel-lite. The BOS with its hemispherical field of view has been receiving both solar and terrestrial radiation above the top of the atmosphere (TOA), which can not be separated easily. After normalising the flux of MES to 1 AU, the decreasing radiative flux with time can be associated with the change in instrument sensitivity (Fig. 5d). The variation of the flux with time is calculated both from MES and from the global
Figure 7.Upper panel: stacking results of 17 star-pointing (MES) observations during ascending phases. Lower pane: the diamond sign is the rotation of the spacecraft; the circle represents the motion inverted from BOS records.
data set. Its linear fits are represented in Fig. 6. The former analysis yields to a loss of−16.5 Wm−2yr−1as the sensitiv-ity decreases by 5 % over the whole mission, while the latter suggests a loss rate of−17.1 Wm−2yr−1. Both results are in agreement within the 95 % confidence level (Fig. 6).
6 Lambertian performance
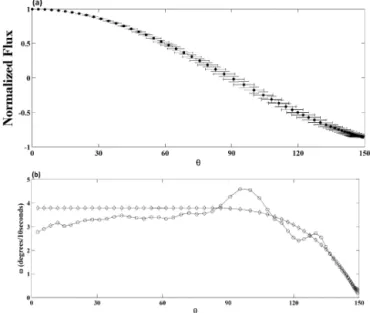
The BOS has a hemispherical field of view (HFOV) and the detector is directly exposed to space without any optical or aperture accessories. In optics, Lambert’s cosine law says that the radiant intensity or luminous intensity observed from an ideal diffusely reflecting surface or ideal diffuse radiator is directly proportional to the cosine of theθangle between the direction of the incident light and the surface normal (Smith, 1966). The Lambertian performance is studied using the part of data obtained during MES, when the satellite is slowly turning away from the Sun-pointing axis to a star in deep space. We stacked all 17 MES records of descending phases; then, we removed the mean value and normalised the stack-ing results to unity (Fig. 7a).
Figure 8.Comparison of the BOS with VIRGO/SOHO and TIM/SORCE. The upper panel shows the records during the whole PICARD lifetime. The cross-correlations are BOS-VIRGO 60.3 %, BOS-TIM 61.7 %, and VIRGO-TIM 97.5 %. The lower panel shows a zoom-in of the upper panel; the three measurements are plotted together with the sampling periods of 10 s for the BOS, 1 h for VIRGO and 6 h for TIM. The cross-correlation coefficients over this period are BOS-VIRGO 66.5 %, BOS-TIM 62.3 %, and VIRGO-TIM 90.5 %.
angular velocity are plotted together in Fig. 7b. The angular velocity from the BOS follows the true motion of the satel-lite well. The cross-correlation coefficient between them is 99.2 %. Thus, the instrument has a Lambertian response to the incoming radiation. As a consequence, the total radiation emitted by the Sun is equal to measured flux multiplied by the cosine of the pointing angle. In the case of PICARD, the pointing accuracy is better than 0.1◦(Meftah et al., 2014b). For the radiation of the Earth’s origin, a correction factor has to be applied according to Lambert’s cosine law.
7 Preliminary comparison with absolute radiometers
The variation of TSI is obtained after normalising to 1 AU, correcting orbital velocity effects (Frohlich et al., 1997) and removing the terrestrial radiation by a 7 day running mean. Since it is difficult to find a physical model of terrestrial radi-ation which could be directly applied to the records, we used the running average to remove the daily variation induced by terrestrial radiation. Several different window lengths have been tested; the one of 7 days is selected because it yields stable results for the solar radiation and terrestrial radiation.
For the solar radiation, we judge the results by comparing it with the satellite–Sun distance modulation. The terrestrial ra-diation is then projected onto a 1◦by 1◦map to be compared with the CERES product. The details about these higher-level products will be discussed in detail in the future works.
the influence of the terrestrial radiation on the main detector of the BOS.
VIRGO is a TSI composite from two absolute radiometers: the PMO6V and DIARAD from SOHO. The TIM/SORCE is another total solar irradiance measurement, which provides a new lower value of the solar constant. The variation of TSI is computed after removing the mean value of each individ-ual data set. The sampling rate of VIRGO and TIM is lin-early interpolated to 10 s to match the cadence of the BOS. Figure 8 shows the short-term variation of total solar irra-diance from the three independent experiments. The cross-correlation between VIRGO and TIM is 97.5 %. The value for VIRGO-BOS is 60.3 %, and TIM-BOS is 62.3 %. The BOS follows fairly well the TSI evolution of VIRGO/SOHO and TIM/SORCE, assessing the ability of the BOS to mea-sure the TSI. The contribution of the terrestrial radiation, on the other hand, is more difficult to estimate due to the varia-tion with time of the angle between the source and the sensor.
8 Conclusions and discussions
The BOS has worked in space for 3.5 years. The sensibility of the absolute temperature measurements has been deter-mined in the laboratory to be of the order of 10−3. In-flight data rather suggest uncertainties of the order of 0.1 K, which is 2 orders higher than the laboratory results. The 1σ value of flux determination is 1.6 Wm−2; it is about 10 times that of laboratory results. The temperature of T1andT2was in-creased from 306 to 326 K and 301 to 322 K respectively since the beginning of the mission. The 20 K temperature rise was not sufficient to explain the disagreement in the er-ror budget between the space observations and the laboratory experiment.
The uncertainty in the short-term solar irradiance varia-tion is±0.45 Wm−2after removing the terrestrial radiation (Zhu et al., 2014). It hints at the fact that the larger error bar deduced from MES could be due to the contribution of ter-restrial radiation that was permanently recorded by the BOS during the entire mission. It proves that we are able to im-prove the relative uncertainty but obviously not the absolute accuracy. On the other hand, the errors in the temperature difference measurements (T1−T2) are in milli-Kelvin, calcu-lated from both laboratory and space experiments. It shows that the ECM and ambient thermal noise are efficiently re-duced with the design of electronic interface and the thermal structure of the BOS instrument.
Globally, the BOS shows a linear degradation of −16.8±0.4 Wm−2yr−1(−33.7±0.8 ppm day−1to the TSI amount). It is 1 order higher than the degradation of the PMO6V and DIARAD absolute radiometers onboard the SOHO satellite (Frohlich et al., 1997). The high degradation rate could be linked to the longer exposure time. A robust relation between the exposure time and the detector’s
degra-Table 3.Instrument data sheet:∗diameter;∗∗sensibility.
Parameter Data
Mass (g) 168
Volume (cm3) 366.7 Height (cm) 9.13 White surface (cm)∗ 6.34
Black surface (cm)∗ 4.65
Shunt (cm)∗ 1.81
Absolute temperature (K)∗∗ 10−1
Relative temperature (K)∗∗ 10−3
Flux (Wm−2)∗∗ 100
Operating temperature (◦C) [−30,+60]
Power consumption (mW) [100, 300]
dation could be established when the UV dose can be simul-taneously monitored.
The instrument-sensitive mode of the absolute radiometer is better modelled with a hyperbolic function. However, from the current space cumulated data, the linear regression func-tion is the best fit for the change in BOS sensitivity. Taking into account that the main detector either of the BOS or the absolute radiometer is black coated, it suggests that the non-linearity of the absolute radiometer’s degradation is mainly induced by the optical part rather than by the painting, a phenomenon which is designated as the “siliconising” of the quartz window exposed to UV radiation (Frohlich, 2003).
The BOS is a perfect Lambertian detector. A cosine cor-rection must be applied to the total amount of radiation. The contribution is small since the pointing angle is stable in the Sun’s direction. The correction is more important for the terrestrial radiation, where the pointing angle between the source and the sensor is bigger.
The BOS is a TRL level-9 space instrument after its suc-cessful service to the PICARD mission according to the defi-nition of ESA’s technology readiness level (ESA, 2012). The details of the instrument are listed in Table 3. The space per-formance of the instrument proves that the BOS is able to measure a large dynamic range of electromagnetic radiation with a relative high resolution. The electronic and thermal design shows its high efficiency in reducing the ECM and ambient thermal noise. The BOS is a stable sensor to track the small amount of variation in the electromagnetic radia-tion. It can be payloaded on the micro, even CubeSat, mis-sions to study the irradiance from the solar as well as plane-tary origin.
and B. Giordanengo from DeMeLab, ROB (Royal Observatory of Belgium), who provided us with the Labsphere and source calibration, and Marie Dominique for her valuable comments on the manuscript. F. Clette gave valuable suggestions for data analysis. J.-P. De Cuyper welcomed us to do the experiment at his digital laboratory. The BOS experiment is financed by the Belgian PRODEX program, and the ESA project with the management support of BELSPO.
Edited by: M. Díaz-Michelena
References
Dewitte, S., Crommelynck, D., Mekaoui, S., and Joukoff, A.: Mea-surement and uncertainty of the long-term total solar irradiance trend, Solar Phys., 224, 209–216, 2004.
ESA: Strategic readiness level, available at: http://sci.esa.int/sre-ft/ 37710-strategic-readiness-level/ (last access: 7 May 2015), 2012.
Fröhlich, C.: Long-term behaviour of space radiometers, Metrolo-gia, 40, S60, doi:10.1088/0026-1394/40/1/314, 2003.
Fröhlich, C., Crommelynck, D. A., Wehrli, C., Anklin, M., De-witte, S., Fichot, A., Finsterle, W., Jiménez, A., Chevalier, A., and Roth, H.: In-flight performance of the Virgo solar ir-radiance instruments on SOHO, Solar Phys., 175, 267–286, doi:10.1023/A:1004929108864, 1997.
K & K Associate: Thermal network modeling handbook, Version 97.003, available at: http://www.tak2000.com (last access: 7 May 2015), 2000.
Kopp, G. and Lean, J. L.: A new, lower value of total solar irradi-ance: evidence and climate significance, Geophys. Res. Lett., 38, 1706, doi:10.1029/2010GL045777, 2011.
Labsphere: Uniform source spheres (PB-13019-000), available at: http://www.labsphere.com (last access: 7 May 2015), 2005. Martinez, L. D.: Participation à la conception et à la réalisation du
capteur BOS destiné à mesurer la variabilité de l’irradiance so-laire totale, thesis, Annee Academique, 2006–2007, Université Libre de Bruxelles, 2007.
Measurement specialties: Mini BetaCURVE Thermistor Probe (MDB), available at: http://www.meas-spec.com (last access: 7 May 2015), 2005.
Mekaoui, S., Dewitte, S., Conscience, C., and Chevalier, A.: To-tal solar irradiance absolute level from DIARAD/SOVIM on the International Space Station, Adv. Space Res., 45, 1393–1406, 2010.
Meftah, M., Hochedez, J.-F., Irbah, A., Hauchecorne, A., Boumier, P., Corbard T., Turck-Chièze, S., Assus, P., Bertran, E., Bourget, P., Buisson, F., Chaigneau, M., Damé, L., Djafer, D., Dufour, C., Etcheto, P., Ferrero, P., Hersé, M., Marcovici, J.-P., Meissonnier, M., Morand, F., Poiet, G., Prado, J.-Y., Renaud, C., Rouanet, N., Rouzé, M., Salabert, D., and Vieau, A.-J.: PICARD SODISM, a space telescope to study the Sun from the middle ultraviolet to the near infrared, Solar Phys., 289, 1043–1076, 2014a.
Meftah, M., Dewitte, S., Irbah, A., Chevalier, A., Conscience, C., Crommelynck, D., Janssen, E., and Mekaoui, S.: SOVAP/Picard, a spaceborne Radiometer to Measure the Total Solar Irradiance, Solar Phys., 289, 1885–1899, 2014b.
Miller, R.: DuPont Engineering Technical Information, Polymeres, Vespel polyimide parts and shapes, available at: http://www. dupont.com (last access: 7 May 2015), 2000.
Schmutz, W., Fehlmann, A., Finsterle, W., Kopp, G. and Thuillier, G.: Total solar irradiance measurements with PREMOS/PICARD, AIP Conf. Proc., 1531, 844, doi:10.1063/1.4804902, 2013.
Smith, W. J.: Modern optical engineering, Tata McGraw-Hill Edu-cation, p. 228, 1966.
Thullier, G., Dewitte, S., Schmutz, W., and The Picard team: Si-multaneous measurement of the total solar irradiance and solar diameter by the PICARD mission, Adv. Space Res., 38, 1792– 1806, doi:10.1016/j.asr.2006.04.034, 2006.
van Ruymbeke, F.: Mise au point d’un capteur embarqué sur satel-lite destiné à mesurer les variations du flux radiative solaire, the-sis, Annee Academique 2005–2006, Université Catholique de Louvain, 2006.
van Ruymbeke, M., Renders, F., Noël, J.-P., van Ruymbeke, F., Mar-tinez, D. L., and Zhu, P.: Mise en orbite d’un bolomèter élaboré à l’Observatoire Royal de Belgique 1ère Partie: Description du dispositif. Ciel et Terre, 126, 173–179, 2010.
van Ruymbeke, M., Zhu P., Renders, F., and Noël J.-P.: Mise en or-bite d’un bolomèter élaboré à l’Observatoire Royal de Belgique 2ème partie : Présentation d’observations de divers phénomènes enregistrés en orbite par le BOS, Ciel et Terre, 127, 14–16, 2011. Zhu, P., Ruymbeke, M. V., Meftah, M., Clette, F., Dewitte, S., Chevalier, A., van Ruymbeke, F., and Noel, J.: The preliminary measurements from the Bolometer Oscillation System (BOS) on board PICARD, American Geophysical Union, Fall Meeting 2010, abstract #GC21B-0873, 2010.
Zhu, P., Karatekin, Ö., Noël, J.-P., van Ruymbeke, M., and Dehant, V.: EGU General Assembly 2012, 22–27 April 2012, Vienna, Austria, p. 7271, 2012.