Pharmacophore modeling and 3D-QSAR
studies on substituted benzothiazole /
benzimidazole analogues as DHFR
inhibitors with antimycobacterial activity
R. Priyadarsini*a, Dr. C.B. Tharanib , Sathya Suganyaa , S.Kavithaa
a
Department of Pharmacy, Madras Medical College, Chennai, India b
Department of Pharmacology, Saveetha Medical college, Chennai - 600077 Email: rpdharsinimpharm@yahoo.co.in.
ABSTRACT
The resurgence of tuberculosis and the emergence of multidrug-resistant strains of Mycobacteria drugs has propelled the development of new structural classes of antitubercular agents. The present study was undertaken to investigate the opportunities which the enzyme dihydrofolate reductase, a promising drug target for treatment of Mycobacterial infections offers for the development of new TB drugs. Pharmacophore models were established by using the HipHop and HypoGen algorithms implemented in the Catalyst software package. The best quantitative pharmacophore model, consisted of two hydrogen bond acceptor, a hydrophobic aliphatic, and a ring aromatic feature which has the highest correlation coefficient (0.93), as well as enrichment factor of 1.75 and Goodness of hit score of 0.73. Based on the pharmacophore model some leads were optimized and some of its derivatives were synthesized and analysed by following QSAR studies. About 25 compounds of substituted benzothiazole/ benzimidazole derivatives were synthesized as potent DHFR inhibitors and screened for antimycobacterial activity. To further explore the structure-activity relationships of all newly synthesized compounds, 3D-QSAR analyses were developed. MFA studies were performed with the QSAR module of Cerius2 using genetic partial least squares (G/PLS) algorithm. The predictive ability of the developed model was assessed using a training set of 25 and a test set of 5 compounds (r2pred = 0.924).The analyzed MFA model demonstrated a good fit, having r2 value of 0.868 and cross validated coefficient r2cv value of 0.771 . KEYWORDS: Pharmacophore, 3D-QSAR-MFA, DHFR , Benzothiazole/Benzimidazole derivatives, Antitubercular agents
INTRODUCTION
Tuberculosis (TB) is the most common cause of disease–related mortality worldwide. Tuberculosis continues to be a major health problem worldwide[1]. The general symptoms of infection includes loss of weight, loss of energy, poor appetite, fever, a productive cough, and night sweats. The World Health Organization estimates that 2 billion people have latent TB, while another 3 million people worldwide die of TB each year[2]. In addition, the prevalence of drug-resistant TB is also increasing worldwide. TB infection with HIV has been an important factor in the emergence and spread of resistance[3]. Thus, there is an urgent need for new antitubercular drugs inhibiting the complete growth of causative Mycobacterium species exhibiting favorable resistance profiles and well tolerated by the patients.
QSAR studies currently being applied in many disciplines pertaining to drug design.The primary aim of 3D-QSAR methods is to establish a correlation of biological activities of a series of structurally and biologically characterized compounds with the spatial fingerprints of numerous field properties of each molecule, such as steric demand, lipophilicity, and electrostatic interactions[4]. 3D-QSAR analysis using MFA technique calculates hydrogen probe interaction energies on a rectangular grid around a bundle of active molecules. The best model is selected based on statistical measures such as data points (n), correlation coefficient (r), square correlation coefficient (r2), cross-validated correlation coefficient(r2cv), predicted correlation coefficient (r2pred), predicted sum of squares (PRESS), bootstrap correlation coefficient (r2BS) and least-square error of fit (LSE)
EXPERIMENTAL
Pharmacophore studies using Catalyst
Pharmacophore modeling correlates the biological activitiy with the spatial arrangement of various chemical features in a set of active analogues. It is based on common chemical features of molecules with inhibitory activity towards DHFR using Hip Hop and HypoGen/Hypo Refine modules implemented in the Accelry’s Catalyst 4.11[11] software package.
Database Mining and Training Set:
A set of 228 Dihydrofolate reductase inhibitors was then divided into 2 sets as training and test sets. The training set of 24 molecules was designed to be structurally diverse with a wide activity range. The test set of remaining 204 molecules are designed to evaluate predictive ability of the resultant pharmacophore.
HypoGen generation and validation studies:
Several quantitative models were generated utilizing the training set (1-24) along with DHFR inhibitory activities . To confirm essential features prevailing among DHFR inhibitors, 10 common feature hypotheses were generated using the most active molecules .The top ten hypotheses were composed of HBA, HYA, and RA features . The quality of HypoGen models are best described in Catalyst user guide in terms of Fixed Cost, Null Cost and total Cost and other statistical parameters. The values of ten hypotheses such as cost, correlation (r), and root-mean-square deviations (rmsd) are statistically significant. The derived pharmacophore models were validated using a set of parameters including cost analysis, test set prediction, enrichment factor, goodness of hit and results are tabulated in Table 1.Based on the pharmacophore model some leads were optimized and some of its derivatives were synthesized and analysed by following QSAR studies.
MFA method:
MFA is a method implemented in the Cerius2 program.[12] The surface was generated from a ‘‘Shape Field’’. The atomic coordinates of the contributing models were used to compute field values on each point of a 3D grid. Grid size was adjusted to default 2.00 A ˚. The MFA evaluates the energy between a probe (H+, CH3 and HO-) and a molecular model at a series of points defined by a rectangular grid. Fields of molecules were represented using grids in MFA and each energy associated with an MFA grid point serves as input for the calculation of a QSAR.
The antitubercular activities of the synthesized compounds were assessed on the basis of the Alamar Blue assay method and MIC method . The minimum inhibitory concentration of test samples required to inhibit the growth of mycobacterium tuberculosis H37RV were obtained and converted into corresponding log MIC values.
Molecular structure generation: The molecular structures of all the synthesized substituted benzthiazole/benzimidazole derivatives were modeled with SYBYL 7.0 molecular modeling program.
Structural alignments: The field fit alignment method was used for MFA. All molecules were submitted to the CONFORMER SEARCH module within Cerius2 to generate 150 conformers of each molecule using Boltzman jump method . The lowest energy conformer of each molecule was selected. All the selected conformers were aligned using field fit alignment method in the QSAR module.
The MFA model of 25 subsituted benzothiazole/benzimidazole derivatives (20 compounds in a training set; 5 compounds in a test set) was developed using field fit alignment. The most active compound,BIM1 was used as a template model for superimposing the rest of the molecules. The steric (CH3) and electrostatic (H+) descriptors in the MFA-QSAR equations specify the regions where variations in the structural features (steric or electrostatic) of different compounds in the training set, leading to either an increase or a decrease in activities. The steric descriptor with positive or negative coefficients shows a region where bulky substituent is favored or disfavored, respectively. The electrostatic descriptor with a positive coefficient indicates a region favorable for electropositive group, while a negative coefficient indicates that an electronegative (electron-withdrawing) group is required at the position.
The r value is a relative measure of the quality of fit of the model. Its value depends on the overall variance of the data. An r2cv, a squared correlation coefficient generated during a cross-validation procedure, is used as a diagnostic tool to evaluate the predictive power of an equation. Cross-validation is often used to determine how large a model (number of terms) can be used for a given data set. The predictive power of the model was calculated by using the following equation
r2pred= SD-PRESS/SD
RESULTS AND DISSCUSSIONS: Pharmacophore model:
While generating the quantitative model, a minimum of 0 to a maximum of 3 features involving HBA(Hydrogen bond acceptor), HYA(Hydrophobic aliphatic )and RA(Ring aromatic) features were selected and used to build a series of hypotheses using a default uncertainty value of 3. Hypo1 HBA(Hydrogen bond acceptor), HYA(Hydrophobic aliphatic )and RA(Ring aromatic) features was used to search the test set of known DHFR inhibitors. Database mining was performed using the BEST flexible searching technique. HypoGen features with its distance constraints are given in FIGURE 1.Hypo 1 succeeded in the retrieval of 85% of the active compounds from the test set. In addition, the Pharmacophore also retrieved 18 inactive compounds (false positives) and predicted 9 active compounds as inactive (false negatives). An enrichment factor of 1.75 and a GH score of 0.73 indicate the quality of the model. Overall, a strong correlation was observed between Hypo1 predicted activity and the experimental DHFR inhibitory activity (pIC50) of the training and test set compounds
MFA STUDIES
A QSAR equation is generally acceptable if the correlation coefficient (r) is approximately 0.9 or higher . MFA-QSAR studies[13-20] were performed on a series of newly synthesised subsituted benzothiazole /benzimidazole derivatives using field fit alignment with high predictive ability, high cross-validated, conventional and predictive r2.The MFA-QSAR equation is expressed as follow:
Equation: GFA activity:
2.61898 - 0.03492 * "H+/860" - 0.062619 * "CH3/870" - 0.04755 * "CH3/955" + 0.027067 * "CH3/482" 0.830988 23.354449 0.710583 0.832677 0.009168 24.000000 5.000000 0.000000 3.000000 5.464927 18.882538 1.455375 0.299192 0.795406 0.132974 0.911585 -13.796613 1.000000
Mean Activity: 1.455; Sum of squared deviations from the mean (SD): 18.88; LOF: 0.299; r2: 0.831; r2adj: 0.795; F-test: 23.354; LSE: 0.133; r: 0.921; C (p): -13.797; XV r2: 0.711; Boot strap (BS) r2: 0.833; BS r2err: 0.009; N obs: 24.000; N vas: 5.000; Press: 5.469; Dep SD: 18.883; Dep mean: 1.455
The presence of two steric descriptors (CH3/870) and (CH3/955) with negative coefficients, indicates that bulky substituents are disfavored. The presence of electrostatic descriptor (H+/860)is also with a negative coefficient indicates that electron withdrawing groups will decrease the activity of the molecule.The positive coefficient of (CH3/482)descriptor indicates that bulky groups are favored in this region
Equation 1 explains 95% variance in the activity with respect to the steric and electrostatic fields and molecular volume while leave-one-out cross-validation power of prediction was found to be 75.5%. An r2BS value of 0.833 is an average squared correlation coefficient calculated during the validation procedure
G/PLS activity
2.12851 - 0.05683 * "CH3/548" - 0.065269 * "CH3/877" + 0.129623 * "CH3/965" - 0.046214 * "H+/860" 0.892088 0.000000 0.376900 0.614521 2.128118 24.000000 5.000000 0.000000 3.000000 11.765706 18.882538 1.455375 0.000000 0.000000 0.084902 0.944504 0.000000 1.000000
Mean Activity: 1.455; Sum of squared deviations from the mean (SD): 18.882; r2: 0.892; F-test: 23.354; LSE: 0.085; r: 0.945; XV r2: 0.377; Boot strap (BS) r2: 0.615; BS r2err: 2.128; N obs: 24.000; N vas: 5.000; Press: 11.766; Dep SD: 18.883; Dep mean: 1.455
The presence of two steric descriptors (CH3/548) and (CH3/877) with negative coefficients, indicates that bulky substituents are disfavored. The presence of electrostatic descriptor (H+/860)is also with a negative coefficient indicates that electron withdrawing groups will decrease the activity of the molecule. The positive coefficient of (CH3/965)descriptor indicates that bulky groups are favored in this region
Randomization test results:
Test results from 19 trails, r from non-random: 0.8537, Confidence level: 95%, Mean value of r from random trails: 0.787, Standard deviation of random trails: 0.0461, Standard deviation from non-random r to mean: 1.445: r2: 0.630, r: 0.794, LSE: 0.274
Cross-validation: Leave-one out cross-validation test results -PRESS: 7.557, Sum of Squared deviation: 22.201, Trails: 1, r2CV: 0.660, r2: 0.715
CONCLUSION
value (125.16), the highest cost difference (59.24), the lowest RMSD (1.264), and the best correlation co-efficient (0.93). The fixed cost and null cost are 107.99 and 184.4 bits respectively. The MFA model was generated based on the feature-shape query of the biologically active conformation of the most active compound. The MFA model was statistically validated and its predictive ability was evaluated. Most of the molecules showed residual values less than 0.25. The obtained MFA model shows good statistical results with r2cv = 0.660, conventional r2 = 0.715 and r2pred = 0.630.The new hits generated were cross validated with both QSAR and Pharmacophore based techniques and the results suggested that both these approaches yield almost same results.
REFERENCES
[1] V. Kumar, A.K. Abbas, et.al. Robbins Basic Pathology. Saunders Elsevier.,2007. 8:516–22.
[2] N.P. Thompson, M.E. Caplin, et.al. Anti-tuberculosis medication and the liver: dangers and recommendations in management. Eur Respir J., 1995, 8:1384–88.
[3] S.D.Lawn, A.L. Zumla, Tuberculosis. Lancet. , 2011,378:57–72.
[4] Madsen Ulf, Krogsgaard-Larsen Povl, et.al.Textbook of Drug Design and Discovery. Washington, DC: Taylor & Francis., 2002. [5] F. Manetti, F. Corell. et.al. Building a pharmacophore model for a novel class of antitubercular compounds. Farmaco Societa chimica
italiana.,2000, 55: 484-91.
[6] Y. Kurogi, O.F.Güner, Pharmacophore modeling and three-dimensional database searching for drug design using catalyst. Curr. Med. Chem. ,2001, 8: 1035–55.
[7] S. Hawser, S. Lociuro. Dihydrofolate reductase inhibitors as antitubercular agent.2006.
[8] Kerly Fernanda Mesquita Pasqualoto, Marcia Miguel Castro Ferreira,Molecular Modeling and Receptor-Dependent (RD) 3D-QSAR approach to a Set of Antituberculosis Derivatives. QSAR Comb. Sci., 2009, 28: 1455 – 64.
[9] M.C.Sharma, Smita Sharma.3D- Quantitative Structure-Activity Relationship Analysis of Some 2-Substituted Halogenbenzimidazoles Analogues with Antimycobacterial activity .Int.J. ChemTech Res. ,2010, 2(1):606-614.
[10] Oldrich pyleta, Vera Klimesova, Effect of substitution on the antimycobacterial activity of 2-(substituted benzyl) sulfanyl benzimidazoles, benzoxazoles, benzothiazoles-a QSAR study. Chemical Pharmaceutical bulletin., 2011, 59(2):179-184.
[11] Catalyst User Guide, Version 4.11. Accelrys Inc, San Diego, CA 92121, USA, (2010). [12] Cerius2, version 4.11; Accelrys Inc: San Diego, California, USA, (2010).
[13] Weerasak Samee, Patcharawee Nunthanavanit, et.al. 3D-QSAR Investigation of Synthetic Antioxidant Chromone Derivatives by Molecular Field Analysis .Int. J. Mol Sci., 2008, 9(3): 235–246.
[14] Atanu Bhattacharjee, Baphilinia Jones Mylliemngap ,3D-QSAR studies on fluroquinolones derivatives as inhibitors for tuberculosis .Bioinformation.,2012 8(8): 381-387 .
[15] Suresh B .Vepuri, S. Anbazhagan, et.al. Pharmacophore Modeling and Docking Based QSAR Studies of Aryl Amidino Isoxazoline Derivatives to Design Potential FXa Inhibitors .American Journal of Bioinformatics Research. ,2012, 2(3):11-20.
[16] Patil Swaraj, Prajapati Amit,3D QSAR Analysis on Triazepane Derivatives as DPP-IV Inhibitors. IJRPS. , 2011,1(3) .
[17] Sharma M.C.; Smita Sharma.3D- Quantitative Structure-Activity Relationship Analysis of Some 2-Substituted
Halogenbenzimidazoles Analogues with Antimycobacterial activity .Int.J. ChemTech Res.2010,2(1),
[18] Neha Kansal, Muttineni Ravikumar. Three–Dimensional Molecular Field Analysis of Dihydroindazolocarbazole Analogues of KDR and Tie–2 Receptor Tyrosine Kinase Inhibitors. Internet Electronic Journal of Molecular Design . 2008, 7: 142–151.
[19] S.K. Jain, S.Vishwakarma, et.al. 3D QSAR Analysis on Pyrrolidine Derivatives as DPP IV Inhibitors., International Journal of Research in Pharmaceutical and Biomedical Sciences., 2011: 2 (3) .
[20] Prafulla B. Choudhari, Manish S. Bhatia, Pharmacophore Identification and QSAR Studies on Substituted Benzoxazinone as Antiplatelet Agents: kNN-MFA Approach . Sci Pharm. ,2012, 80:283–294.
[21] Kamalakaran Anand Solomon, Srinivasan Sundarajan, QSAR Studies on N-aryl Derivative Activity Towards Alzheimer’s Disease .Molecules., 2009, 14:1448-1455.
TABLE 1:
10 Pharmacophore models generated by the HypoGen for DHFR inhibitors
Hypo
No.
Total cost Cost
difference$
RMS
deviation
Training set
(r)
Features#
1 125.16 59.24 1.264 0.93 AAHR
2 127.91 58.49 1.754 0.858 AAHR
3 129.24 57.16 1.748 0.861 AAHR
4 130.11 56.29 1.791 0.852 AAHR
5 130.7 55.7 1.812 0.848 AHRR
6 130.8 55.6 1.857 0.839 AAHR
7 133.48 52.92 1.938 0.822 AAHR
8 133.72 52.68 1.888 0.834 AAHR
9 133.83 52.57 1.811 0.851 AAHR
10 134.7 51.7 1.877 0.837 AAAH
$(null cost-total cost), null cost = 184.4, fixed cost = 107.99, for the hypo-1 weight = 1.124, configuration = 15.14. all cost units are in bits. #A- hydrogen bond acceptor, H – hydrophobic aliphatic and R – Ring aromatic
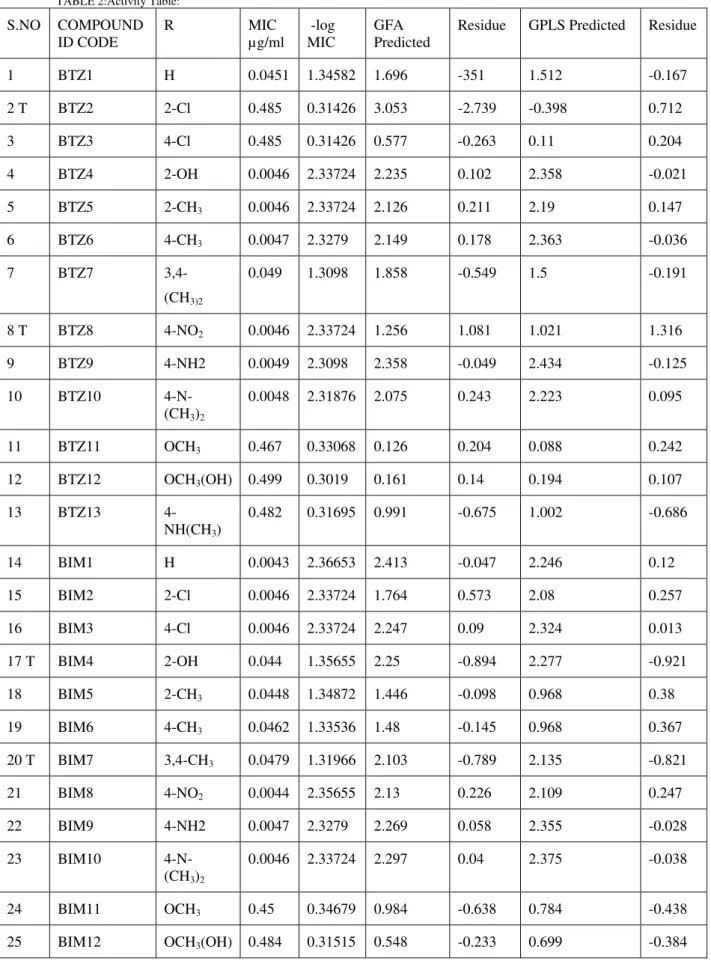
TABLE 2:Activity Table:
S.NO COMPOUND ID CODE
R MIC
µg/ml -log MIC
GFA Predicted
Residue GPLS Predicted Residue
1 BTZ1 H 0.0451 1.34582 1.696 -351 1.512 -0.167
2 T BTZ2 2-Cl 0.485 0.31426 3.053 -2.739 -0.398 0.712
3 BTZ3 4-Cl 0.485 0.31426 0.577 -0.263 0.11 0.204
4 BTZ4 2-OH 0.0046 2.33724 2.235 0.102 2.358 -0.021
5 BTZ5 2-CH3 0.0046 2.33724 2.126 0.211 2.19 0.147
6 BTZ6 4-CH3 0.0047 2.3279 2.149 0.178 2.363 -0.036
7 BTZ7 3,4-
(CH3)2
0.049 1.3098 1.858 -0.549 1.5 -0.191
8 T BTZ8 4-NO2 0.0046 2.33724 1.256 1.081 1.021 1.316
9 BTZ9 4-NH2 0.0049 2.3098 2.358 -0.049 2.434 -0.125
10 BTZ10
4-N-(CH3)2
0.0048 2.31876 2.075 0.243 2.223 0.095
11 BTZ11 OCH3 0.467 0.33068 0.126 0.204 0.088 0.242
12 BTZ12 OCH3(OH) 0.499 0.3019 0.161 0.14 0.194 0.107
13 BTZ13
4-NH(CH3)
0.482 0.31695 0.991 -0.675 1.002 -0.686
14 BIM1 H 0.0043 2.36653 2.413 -0.047 2.246 0.12
15 BIM2 2-Cl 0.0046 2.33724 1.764 0.573 2.08 0.257
16 BIM3 4-Cl 0.0046 2.33724 2.247 0.09 2.324 0.013
17 T BIM4 2-OH 0.044 1.35655 2.25 -0.894 2.277 -0.921
18 BIM5 2-CH3 0.0448 1.34872 1.446 -0.098 0.968 0.38
19 BIM6 4-CH3 0.0462 1.33536 1.48 -0.145 0.968 0.367
20 T BIM7 3,4-CH3 0.0479 1.31966 2.103 -0.789 2.135 -0.821
21 BIM8 4-NO2 0.0044 2.35655 2.13 0.226 2.109 0.247
22 BIM9 4-NH2 0.0047 2.3279 2.269 0.058 2.355 -0.028
23 BIM10
4-N-(CH3)2
0.0046 2.33724 2.297 0.04 2.375 -0.038
24 BIM11 OCH3 0.45 0.34679 0.984 -0.638 0.784 -0.438
25 BIM12 OCH3(OH) 0.484 0.31515 0.548 -0.233 0.699 -0.384
FIGURE 1. Pharmacophore models for DHFR inhibitors. HypoGen features with its distance constraints. Features are color coded with green: one hydrogen bond acceptor, light blue: hydrophobic aliphatic and grey: Ring aromatic
FIGURE 2:BTZ1
FIGURE 4: Superimposition of aligned fit molecules
FIGURE 6
Mapping of the best 3D-GPLS model and the interaction points. The most active compound, BIM1, is displayed in background as reference.
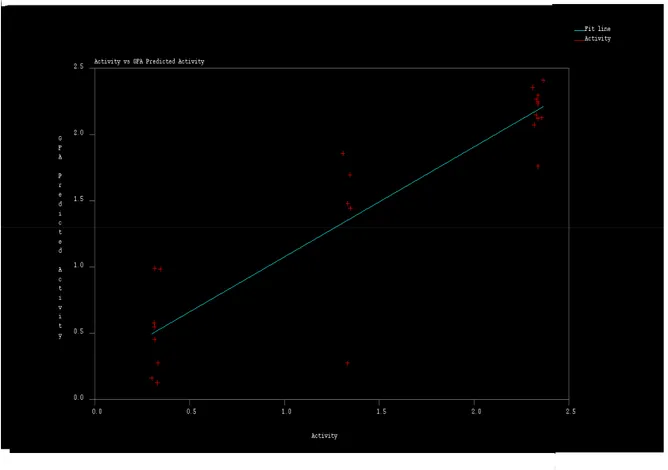
Scattered plots of calculated and actual activities and the plot of residuals for the training set and the test set molecules are shown in following graphs