❊♥s❛✐♦s ❊❝♦♥ô♠✐❝♦s
❊s❝♦❧❛ ❞❡
Pós✲●r❛❞✉❛çã♦
❡♠ ❊❝♦♥♦♠✐❛
❞❛ ❋✉♥❞❛çã♦
●❡t✉❧✐♦ ❱❛r❣❛s
◆◦ ✸✸✾ ■❙❙◆ ✵✶✵✹✲✽✾✶✵
P✉❜❧✐❝ ❱❡rs✉s Pr✐✈❛t❡ Pr♦✈✐s✐♦♥ ♦❢ ■♥❢r❛str✉❝✲
t✉r❡ ✐♥ ❛ ◆❡♦❝❧❛ss✐❝❛❧ ●r♦✇t❤ ▼♦❞❡❧
P❡❞r♦ ❈❛✈❛❧❝❛♥t✐ ●♦♠❡s ❋❡rr❡✐r❛
❖s ❛rt✐❣♦s ♣✉❜❧✐❝❛❞♦s sã♦ ❞❡ ✐♥t❡✐r❛ r❡s♣♦♥s❛❜✐❧✐❞❛❞❡ ❞❡ s❡✉s ❛✉t♦r❡s✳ ❆s
♦♣✐♥✐õ❡s ♥❡❧❡s ❡♠✐t✐❞❛s ♥ã♦ ❡①♣r✐♠❡♠✱ ♥❡❝❡ss❛r✐❛♠❡♥t❡✱ ♦ ♣♦♥t♦ ❞❡ ✈✐st❛ ❞❛
❋✉♥❞❛çã♦ ●❡t✉❧✐♦ ❱❛r❣❛s✳
❊❙❈❖▲❆ ❉❊ PÓ❙✲●❘❆❉❯❆➬➹❖ ❊▼ ❊❈❖◆❖▼■❆ ❉✐r❡t♦r ●❡r❛❧✿ ❘❡♥❛t♦ ❋r❛❣❡❧❧✐ ❈❛r❞♦s♦
❉✐r❡t♦r ❞❡ ❊♥s✐♥♦✿ ▲✉✐s ❍❡♥r✐q✉❡ ❇❡rt♦❧✐♥♦ ❇r❛✐❞♦ ❉✐r❡t♦r ❞❡ P❡sq✉✐s❛✿ ❏♦ã♦ ❱✐❝t♦r ■ss❧❡r
❉✐r❡t♦r ❞❡ P✉❜❧✐❝❛çõ❡s ❈✐❡♥tí✜❝❛s✿ ❘✐❝❛r❞♦ ❞❡ ❖❧✐✈❡✐r❛ ❈❛✈❛❧❝❛♥t✐
❈❛✈❛❧❝❛♥t✐ ●♦♠❡s ❋❡rr❡✐r❛✱ P❡❞r♦
P✉❜❧✐❝ ❱❡rs✉s Pr✐✈❛t❡ Pr♦✈✐s✐♦♥ ♦❢ ■♥❢r❛str✉❝t✉r❡ ✐♥ ❛ ◆❡♦❝❧❛ss✐❝❛❧ ●r♦✇t❤ ▼♦❞❡❧✴ P❡❞r♦ ❈❛✈❛❧❝❛♥t✐ ●♦♠❡s ❋❡rr❡✐r❛ ✕ ❘✐♦ ❞❡ ❏❛♥❡✐r♦ ✿ ❋●❱✱❊P●❊✱ ✷✵✶✵
✭❊♥s❛✐♦s ❊❝♦♥ô♠✐❝♦s❀ ✸✸✾✮
■♥❝❧✉✐ ❜✐❜❧✐♦❣r❛❢✐❛✳
Public Versus Private Provision of
Infrastructure in a Neoclassical Growth
Model
Pedro Cavalcant i Ferreira
¤Graduat e School of Economics
Fundação Get ulio Vargas
A bst r act
T his article studies t he welfare and long run allocat ion impact s of privatizat ion. T here are two types of capit al in t his model economy, one privat e and t he other initially public (“ infrastructure” ). A positive ext ernality due t o infrast ructure capital is assumed, so t hat t he govern-ment could improve upon decentralized allocations int ernalizing the ext ernality, but public investment is …nanced through dist ort ionary t axat ion. It is shown t hat privat izat ion is welfare-improving for a large set of economies and that aft er privatizat ion under-invest ment is optimal. When operation ine¢ ciency in t he public sect or or sub-sidy t o infrast ruct ure accumulat ion are int roduced, gains from priva-t izapriva-t ion are higher and posipriva-t ive for mospriva-t reasonable combinapriva-tions of paramet ers.
JEL Classi…cation: E62; H54; H41; E37.
Keywords: Infrast ruct ure; Public Goods; Privat izat ion; Welfare.
¤Graduat e School of Economics, Fundação Get ulio Vargas. Praia de Bot afogo, 190, Rio
1
I nt r oduct i on
Infrast ruct ure and privat izat ion of public ut ilit ies have been, in t he past years, t he subject of ext ensive lit erat ure and moved t o t he cent er of t he pol-icy debat e in bot h developed and developing count ries around t he world. On t he one hand, t he product ive impact of infrast ruct ure has been invest igat ed lat ely by an increasing number of st udies, st art ing wit h Aschauer’s pioneer paper(1989). T hese st udies use di¤erent economet ric t echniques and dat a samples t o est imat e t he out put and product ivity elast icity t o public capit al. Alt hough t he magnit udes found vary considerably, t he overall est imat es (e.g. Aschauer (1989), Ai and Cassou(1995), Du¤y-Deno and Ebert s(1991), and East erly and Rebelo(1993)) t end t o con…rm t he hypot hesis t hat infrast ruc-t ure capiruc-t al posiruc-t ively a¤ecruc-t s producruc-t iviruc-ty and ouruc-t puruc-t , despiruc-t e some impor-t animpor-t excepimpor-t ions (e.g. Holimpor-t z-Eakin(1992) and Hulimpor-t en and Swcharimpor-t z(1992)). On t he ot her hand, t he perception of poor performance of public-operat ed infrast ruct ure ut ilit ies, among ot her reasons, led t o a ‡urry of privat izat ion and concessions in a large and increasing number of count ries. For inst ance, from 1988 t o 1992, revenue from infrast ruct ure privat izat ion in developing count ries t ot alled 19.8 billion of dollars (World Bank[1994]) and since t hen it s pace has accelerat ed remarkably.
In t his paper we use a compet it ive general equilibrium model, basically a variat ion of t he neoclassical growt h model, t o invest igat e the welfare and long run allocat ion impact s of privat izat ion. T here are two types of capit al in t his model economy, one privat e and t he ot her init ially public (“ infrast ruc-t ure” ), and a posiruc-t ive exruc-t ernaliruc-ty due ruc-t o ruc-t he laruc-t ruc-t er is assumed. A benevolenruc-t government can improve upon decent ralized allocation by int ernalizing t he ext ernality. However, it is assumed t hat lump sum t axat ion is not an opt ion and t hat t he government uses dist ort ionary t axes t o …nance invest ment . This last feat ure int roduces a t rade-o¤ in t he public provision of infrast ruct ure, as dist ort ionary t axes may o¤set t he product ive e¤ect int ernal and ext ernal -of public capit al. The net e¤ect -of privat izat ion and ot her quant it at ive prop-erties of t his t heoret ical economy depend t o a large ext ent on t he relat ive st rengt h of t he two e¤ect s1.
1T he model could be int erpret ed also as a model of public versus privat e provision of
This model economy was solved by using simulat ion t echniques on t he lines of K ydland and Prescott (1982), alt hough t he model is non st ochast ic. The paramet ers and funct ional forms of t he model were calibrat ed following t he t radit ion of real business cycle models of mat ching feat ures of t he act ual U.S. economy. We could not , however, set t le for unique values of t he int ernal and ext ernal e¤ect of infrast ruct ure capit al, given t he large and con‡ict ing number of est imat es in t he lit erat ure. We chose, t herefore, t o use several values for t he ext ernal-e¤ect paramet er and compare t he result s.
Two set s of experiment s were performed, one measuring t he welfare e¤ect s of privat izat ion under alt ernat ive set s of paramet ers and the ot her comparing long run allocat ions. One of t he main result s of t he paper is t hat when we make t he best case for public act ion - maximization of individuals’ welfare, no operat ion ine¢ ciency, det erminist ic and known policy and free supply t o society of infrast ruct ure services - privat izat ion will be welfare improving if t he ext ernal e¤ect is not st rong enough, but for some reasonable combina-t ions of paramecombina-t ers icombina-t may imply in welfare loss. However, when operacombina-t ion ine¢ ciency is int roduced, gains from privatizat ion are higher and posit ive for most reasonable combinat ions of paramet ers. Moreover, if a subsidy t o infrast ruct ure accumulat ion is also allowed so t hat agent s can int ernalize it s ext ernality, t he bene…ts of privat e operat ion of infrast ruct ure will increase for a given economy, as well as t he number of economies which can pro…t from it .
On a purely t heoret ical ground, Devarajan, Xie and Zou(1998) invest igat e alt ernat ive syst ems of infrast ruct ure-services provision using dist ort ionary t axes and part of our model borrows from t heirs. However, t hey work in an endogenous growt h environment while we work wit h t he t radit ional neoclassi-cal growt h model. This framework was chosen, among other reasons, because in order t o obt ain sust ainable growt h it is necessary t o assume empirically im-plausible values for t he infrast ruct ure coe¢ cient in t he product ion funct ion. In ot her words: if we consider t he usual capit al share of 0.36, t he coe¢ cient of infrast ruct ure in a Cobb-Douglas product ion funct ion would have t o be 0.64 for t he model t o display sust ainable growt h. But t he values est imat ed in t he lit erat ure range from zero t o 0.4, and even t his last value (Aschauer’s (1989) est imat e) was discredit ed on met hodological grounds (Gramlich(1994)). The addit ion of human capit al t o t he model could help but would st ill not solve t he problem.
form ext ernalit ies were int roduced in t he product ion funct ion. This is a possi-ble reading of t he paper and we basically phrased it in t erms of infrast ruct ure provision following t he lit erat ure ment ioned above and so being able t o use t he paramet er est imat ions of t hese papers in t he calibrat ion of our models.
This paper is organized as follows. Sect ion two present s t he model wit h public provision of infrast ruct ure, sect ion t hree present s t he model wit hout government ( i.e., aft er privatizat ion), sect ion 4 brie‡y discusses calibrat ion and sect ion 5 discusses met hodology and present s t he main result s of t he simulat ions. The experiments wit h subsidy t o invest ment in infrast ruct ure are present ed in sect ion 6. Finally, in sect ion 7 some concluding remarks are made.
2
M odel I : P ubli c I nfr ast r uct ur e
In t his economy a single …nal good is produced by …rms from labor, H, and two types of capit al, K and G. There is a posit ive ext ernality generat ed by t he average of capit al G, G , so t hat t he t echnology of a represent at ive …rm is given by:
Yt = KtµG Á tH
1¡ µ¡ Á
t G
°
t (1a)
In t his …rst model, labor and K , privat e capit al, are owned by individuals who rent t hem t o …rms. The second type of capit al, infrast ruct ure (G), is owned by t he government , who …nances it s invest ment s by t ax collect ion and supplies G for free t o …rms.
The technology above may be t hought of as a generalizat ion of a class of models t hat incorporat es infrast ruct ure or public capit al t o t he product ion funct ion. In t he one hand, Aschauer(1989), Barro(1990) and Cassou and Lassing(1996), among ot hers, assume no ext ernality due t oG(i.e.,° = 0) and const ant ret urns t o scale overK ; GandH :On t he ot her hand, Turnovsky and Fisher ( 1995) and Glomm and Ravikumar (1994 and 1997) assume const ant returns t o scale t o privat e factors only -K andH - and consequent lyÁ = 0:In t his case t he public good quality of G is emphasized. Finally, Devarajan, Xie and Zou (1998) work wit h a product ion funct ion in which bot h ° andÁare di¤erent from zero, but µ + ° + Á = 1:
M ax
K t ; H t K µ tG
Á tH
1¡ µ¡ Á
t G
°
t ¡ wtHt ¡ rtKt
From t he solut ion of t his simple problem we obt ain t he expressions for t he rent al rat e of privat e capit al, r, and wages, w:
rt = µ
µ
Kt
Ht
¶µ¡ 1µG t
Ht
¶Á
G°t (2a)
wt = (1¡ Á¡ µ)
µ
Kt
Ht
¶µµG t
Ht
¶Á
G°t (3) A represent at ive agent is endowed wit h one unit of time which he divides between labor and leisure (l). His ut ility at each period is de…ned over sequences of consumpt ion and leisure, and it is assumed t hat preferences are logarit hm in bot h it s argument s2:
U[c0; c1; :::; h0; h1; :::] = 1
X
t= 0
¯t[ln(ct) + A ln(1¡ ht)]
Families have one addit ional source of income, dividends¼: Not e t hat t here is one fact or of product ion ( G) t hat is not paid by t he …rm, as govern-ment supplies it for free. Hence, …rms obt ains an economic pro…t equal t o
Á Kµ tG
Á tH
1¡ µ¡ Á
t G
°
t ( t he public capit al share of out put ) which are dist ribut ed
t o t he families - t he owners of the …rms - as dividends. All families receive equal amount s of t ot al pro…ts and t ake t he dividends as given when solving t heir problem. Income from all sources are t axed by t he government at t he same t ax rat es¿and t ot al disposable income is used by agent s for consump-t ion and invesconsump-t menconsump-t (i ). Not e t hat households t ake as given t he t ax rat es, which are assumed t o be const ant over t ime. Hence, households’ budget const raint is given by:
ct + it · (1¡ ¿)wtht + (1¡ ¿)rtkt + (1¡ ¿)¼ (4)
It is assumed t hat households know t he law of mot ion of privat e and public capit al:
kt + 1= (1¡ ±)kt + it (5)
2Not e t hat we use capit al let t ers for aggregat e variables, t aken as given by t he
Gt + 1= (1¡ ±g)Gt + Jt; (6)
where±and ±g are t he depreciat ion rat es of privat e and public capit al,
re-spect ively, andJ is invest ment in public capit al. Consumers t ake government act ions - t ax rat es and invest ment - as given and it is imposed t hat t he gov-ernment budget const raint is always in equilibrium (ruling out public debt ):
¿wtHt + ¿rtKt + ¿¼= Jt; 8t (7)
We can writ e t he household’s problem in a recursive form. The opt imality equat ions can t hen be writ t en as:
v(k; K ; G; G) = M ax
c;h;i
n
[ln(c) + A ln(1¡ h)] + ¯ v(k0; K0; G0; G0)
o
s:t :
c + i = (1¡ ¿)r (K ; G; G)k + (1¡ ¿)w(K ; G; G)h + (1¡ ¿)¼
³
K ; G; G
´
k0= (1¡ ±)k + i
G0= (1¡ ±
g)G + J
¿r K + ¿wH + ¿¼= J k0and G0 > 0and given
c¸ 0; 0· h· 1
It can be shown t hat , aft er some simple manipulat ions, solut ions for t his problem sat isfy t he following condit ions:
1 c =
¯
µ
(1¡ ¿)µ
³
K0 H0
´µ¡ 1³
G0 H0
´Á
G0° + (1¡ ±)
¶
c0 (8)
A 1¡ h =
(1¡ ¿)(1¡ Á¡ µ)
³
K H
´µ³
G H
´Á
G°
c (9)
A recursive competitive equilibrium for t his economy is a value func-t ion V (s), s given by (k; K ; G; G), a set of decision rules for t he house-hold, c(s); h(s)and i (s), a corresponding set of aggregat e per capit a decision rules,C(S); H (S)andI (S),Sgiven by(K ; G; G), and fact or prices funct ions,
w(S)andr (S), such t hat t hese funct ions sat isfy: a) t he household’s problem; b) t he …rm’s problem and equat ions 2 and 3; c) consist ency of individual and aggregat e decisions, i.e., C(S) = c(s); H (S) = h(s),I (S) = i (s) and also
¼= ÁY (S); d) the aggregat e resource const raint ,C(S)+ I (S)+ J (S) = Y (S), 8S; e) and t he government budget const raint clears.
Following Chari, Christ iano and K ehoe(1994) t he exist ence of a commit -ment t echnology or some inst it ut ion t hat forces t he govern-ment t o bind itself t o a part icular announced policy at t ime zero is supposed. Once t he gov-ernment picks it s policy at t he beginning of t ime, agent s will choose t heir allocat ions so t hat prices and consumers’ allocat ions will be described as funct ions of public policies.
Government t herefore picks¿in order to maximize the individual’s wel-fare, t aking as given opt imal decision rules and t he equilibrium expressions for wages and rent al rat e of capit al. It solves t he following problem3:
M ax
¿ 1
X
t = 0
¯t [ln((ct(¿)) + A ln(1¡ ht(¿))] ;
s:t
ct(¿) + it(¿) = (1¡ ¿)rt(¿)kt(¿) + (1¡ ¿)wt(¿)ht(¿) + (1¡ ¿)¼(¿)
rt = µKtµ¡ 1H ¡ µ¡ Á
t G
Á+ ° t
wt = (1¡ Á¡ µ)KµHt¡ µ¡ ÁG Á+ ° t
¼t = ÁKµH 1¡ µ¡ Á
t G
Á+ ° t
¿rtkt + ¿wtht + ¿¼= Jt
Gt + 1 = (1¡ ±g)Gt + Jt
The opt imal policy, t he price rulesw(¿) andr (¿) and allocat ions rules for consumpt ion and invest ment t hat solve t he above problem is a Ramsey Equi-librium. For t he sake of simplicity, only in t he …rst line of t he rest rict ions did we writ e variables explicit ly as a funct ion of t ax rat es.
3Glomm and Ravikumar (1994) prove exist ence and uniqueness in a model very close t o
In t he expression of w, r, and ¼t he posit ive ext ernal e¤ect due t oG is t aken int o account . As lump sum t axat ion was ruled out , government act ions creat e a t rao¤. On t he one hand, t hrough t axat ion it dist ort s opt imal de-cisions and reduces labor and capit al ret urns. On t he ot her hand, it supplies infrast ruct ure, which has a posit ive e¤ect on ret urns and consequent ly on t he equilibrium levels of capit al, labor and out put . Not e t hat, in t he economy wit hout government , t he ext ernal e¤ect due t o G is not t aken int o account when individuals decide how much t o spend on J, so t hat t he isolat ed e¤ect is under-invest ment in infrast ruct ure. Of course, t he absence of t axat ion may o¤set t his negat ive e¤ect .
3
M odel I I : P r ivat izat ion
Suppose now privat e operat ion and ownership of infrast ruct ure (type G cap-it al), and assume t oo no government and hence no t ax. Technology and t he laws of mot ion of bot h capit als in t his economy remain t he same as before, but t he problem of …rms and households will change.
As in t he previous problem, …rms face t he same st at ic problem each pe-riod, but now t hey pick K , H and G in order t o maximize t heir pro…ts:
M axKt;Ht;Gt K µ
t G
Á t H
1¡ µ¡ Á
t G
°
t ¡ wtHt ¡ rtKt ¡ ½tGt
The expressions for t he rent al rat e of capit al K and wages, obt ained from t he solut ion of t his problem, reproduces equat ions 2 and 3 (wit hout t he t ax rat es, of course) while t he expression for ½, t he rent al rat e of type G capit al, is:
½t = Á
µ
Kt
Ht
¶µµG t
Ht
¶Á
G°t (10) Consumer’s ut ility funct ion remains t he same, but not his/ her budget const raint . In addit ion t o consumpt ion and invest ment in capit al k, t he consumer expends part of his/ her income on invest ment on capit al g, labeled j. Moreover, he/ she now receives rent s from g used by …rms, so t hat his/ her budget const raint is given now by:
ct + it + jt · rtkt + wtht + ½tgt (11)
t he welfare of a represent at ive agent , because of dist ort ions. In bot h cases t he solut ion follows recursive met hods for dist ort ionary economies, as explained in Hansen and Prescot t (1995), and t he equilibrium concept is t he recursive compet it ive equilibrium due t o Prescot t and Mehra(1980). The expression for t he household’s problem in a recursive form closely follows t he expression for t he previous problem wit h t he appropriat e modi…cat ions and one addit ional st at e variable, g. It can be shown t hat , aft er some simple manipulat ions, solut ions for t his problem sat isfy t he following condit ions:
1 c= ¯ µ µ ³ K0 H0
´µ¡ 1³
G0 H0
´Á
G0° + (1¡ ±)
¶
c0 (12)
1 c = ¯ µ Á ³ K0 H0
´µ³
G0 H0
´Á¡ 1
G0° + (1¡ ± g)
¶
c0 (13)
A 1¡ h =
(1¡ Á¡ µ)
³
K H
´µ³
G H
´Á
G°
c (14)
The second expression above was not present in t he solut ion of the pre-vious problem and is an Euler equat ion for capit al g. The two remaining expressions, except for t he absence of t axes, are equivalent t o equat ions 8 and 9. From equat ions 12 and 13 it can be seen t hat consumers equat e t he marginal product ivity of t he two capit als in every period. T he de…nit ion of a recursive compet it ive equilibrium closely follows t he de…nit ion in sect ion 3, wit h minors changes due t o t he presence of one addit ional st at e variable, g.
4
Cal ibr at ion
Quant it at ive propert ies of t his t heoret ical economy depend t o a large ext ent on t he values of t he model’s paramet ers. Depreciat ion rat e for K is t aken from K ydland and Prescot t ’s (1982), among many ot hers, and is set equal t o 0.025 per quart er. Out put share of privat e capit al, µ;was set equal t o 0.34, following Cooley and Prescot t (1995).
Preference paramet ers follow Cooley and Hansen(1989), among ot hers:
maximize t he individual’s welfare and are not calibrat ed to mat ch observed values.
There are no independent est imat es of° (t he coe¢ cient of t he ext ernality e¤ect due t o G) t hat we know in t he lit erat ure. As a mat t er of fact , most papers est imat e° and Ájoint ly. To obt ain °, we …rst set Á = 0:05, a value t hat matches post -war share of public invest ment (J=Y) in t he U.S. and it is t he benchmark value used by Baxt er and K ing(1993). We t hen subt ract ed t his calibrat ed value from the joint est imat es of Á + ° in order t o obt ain t he value of °.
Using t his met hod, we obt ained ° values t hat range from zero t o 0.30. For inst ance, Rat ner (1983), using U.S. annual dat a from 1949 and 1973, est imat es out put elast icity wit h respect t o public capit al around 0.06, which imply ° t o be equal t o 0.01. Du¤y-Deno and Ebert s(1991) est imat e similar and slight er higher values using dat a for 5 met ropolit an areas of t he U.S. The same is t rue in Canning and Fay(1993) - who used a variety of cross-count ry dat a bases - and Ba¤es and Shah(1993) - who worked wit h OECD and developing count ry dat a.
Aschauer(1989) est imat ed much larger values t hat imply gamma around 0.30. He used, however, t he OLS met hod, which may have biased his re-sult s because of endogeneity of variables. The met hod used, as point ed out by Gramlich(1994), also has a problem of common t rends between t he in-frast ruct ure series and t he out put series employed. Moreover, t he rat e of return on public capit al implied by t hese est imat es lies above t hat of privat e capit al, a very implausible result . Munnel(1990) …nds values of t he same order of magnit ude for some U.S. regions and uses similar met hods. For t he U.S. st at es, however, her est imat es imply gammas between 0.01 and 0.07, depending on t he public capit al series used. Ai and Cassou (1995) use t he GMM met hod t o est imat e Euler equat ions of a dynamic model and t he im-plied gamma in t his case is 0.15. On t he ot her hand, Holt z-Eakin(1992) and Hult en and Schwab(1992) found no evidence of public capit al a¤ect ing product ivity4.
Given t he variety of magnit udes est imat ed, several values for t he param-et er gamma were used, alt hough our int uit ion and most est imat es indicat es t hat values between zero and 0.02 are t he most reasonable ones. In our ex-periment s we used gamma values from zero (no ext ernal e¤ect ) t o 0.05. The
4T his list is by no means complet e, t he empirical lit erat ure on t he subject is quit e large.
depreciat ion rat e of infrast ruct ure capit al ( ±g) is set t o 0.025 per quart er,
following again Baxt er and K ing(1993).
5
R esult s
5.1
L ong Ter m A l locat i ons
The behavior of t hese economies is very sensit ive t o changes t o gamma and t o t he t ax st ruct ure used t o …nance public invest ment . In general, t he higher gamma, t he st ronger t he case for public provision of infrast ruct ure. On t he ot her hand, t he more dist ort ing is public …nancing, t he great er will be t he gains from privat izat ion.
For any given gamma, st eady st at e ut ility increases init ially wit h ¿, reaches a maximum at some¿¤, and t hen monot onically decreases as¿
con-t inues con-t o increase . T his is so because, for values below¿¤, t he posit ive e¤ect
of infrast ruct ure on product ivity outweigh t he negat ive impact of t axat ion on ret urns, so t hat privat e capit al, out put , consumpt ion and ut ility levels increase wit h t ax rat es. For t ax rat es large enough ( ¿ > ¿¤), t he negat ive
e¤ect of t axat ion dominat es.
The opt imal t ax rat e increases wit h gamma. For gamma equal t o zero (no ext ernality), 0.025 and 0.05, ¿¤ is 0.05, 0.08 and 0.10, respect ively, and
it increases t o 0.13 and 0.15 for economies wit h gamma equal t o 0.075 and 0.10, respect ively. In t he case of large ext ernality e¤ect ,° = 0:3, for inst ance, t he opt imal t ax rat e is 0.35, which implies t hat opt imal public sect or share
(¿¤(rtkt+ wtht)=Yt) is 0.33, considerably larger than t he act ual public sector
share. On t he ot her hand, for gamma between zero and 10 per cent , t he opt imal public sect or share is smaller t han t he observed share.
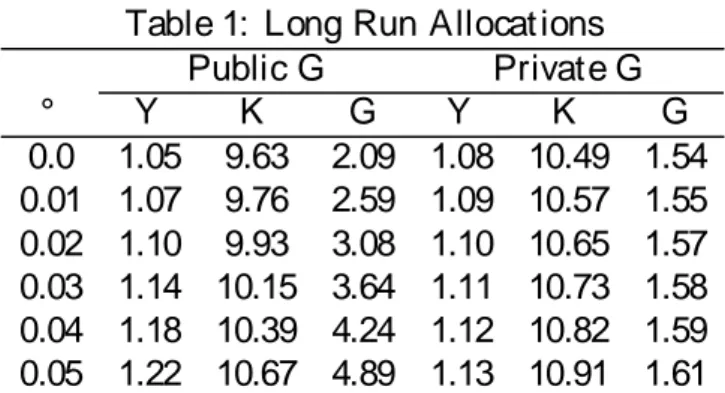
Table 1: Long Run Allocat ions Public G Private G
° Y K G Y K G
0.0 1.05 9.63 2.09 1.08 10.49 1.54 0.01 1.07 9.76 2.59 1.09 10.57 1.55 0.02 1.10 9.93 3.08 1.10 10.65 1.57 0.03 1.14 10.15 3.64 1.11 10.73 1.58 0.04 1.18 10.39 4.24 1.12 10.82 1.59 0.05 1.22 10.67 4.89 1.13 10.91 1.61
Not e t hat t he e¤ect of changes in gamma is much st ronger in t he model wit h public provision of infrast ruct ure. While G, K and Y increase at most 4,6% when gamma goes from zero t o 0.05, in t he economy wit h privat e G, K increases 11%, Y 16% and G more t han doubled it s value in t he model wit h public infrast ruct ure. The reason for t his result , of course, is t he fact t hat in t he last model t he posit ive ext ernality due t o G is t aken int o account but not in t he economy wit h privat e infrast ruct ure. In t he last case, t he provision of type G capit al is a funct ion of it s (privat e) marginal product , which depends direct ly on phi, but not on gamma, as can be seen in expression 13. This fact also explains why t here is always a relat ive under-invest ment on G in t he model where it is privat e provided, even for small values of gamma: when it s value is 0.025, G and J are twice as large when t hey are public provided t han when t hey are privat e provided. This, of course, is t he opt imal behavior for t his economy: t here is not hing int rinsically ” bad” in t he fact t hat t he …rst economy invest s more in G t han t he second.
wit hout government but invest ment in capit al type G is much smaller, out side and in t he stat e st at e. For t his reason, as shown in t he next sect ion, in t his economy welfare is higher when infrast ruct ure is privat e rather t han public provided. Hence, as measured by welfare, t here is over-invest ment in infrast ruct ure in t he economy wit h government , for t his combinat ion of paramet ers.
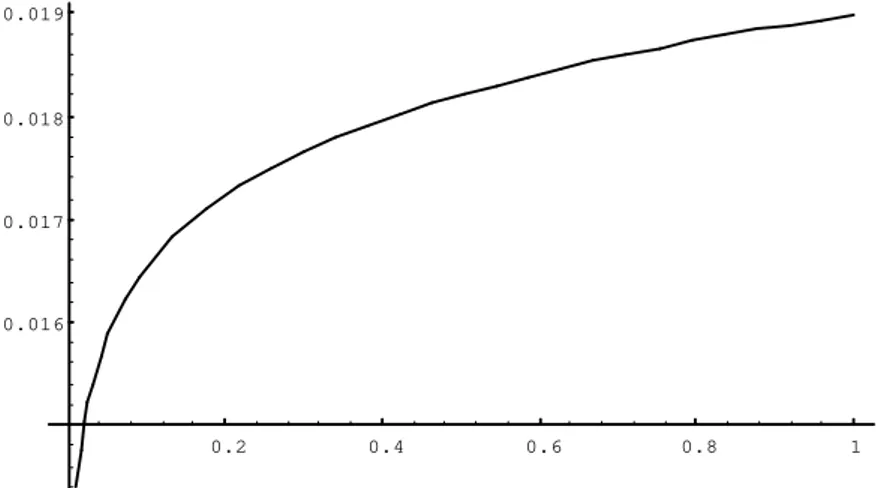
0.2 0.4 0.6 0.8 1
0.016 0.017 0.018 0.019
Figure1: Di¤erence in income levels as funct ion of input s (° = 0:01)
0.2 0.4 0.6 0.8 1
0.025 0.035 0.04 0.045
t he G st ock of economies wit h smaller gammas - when gamma is 0.30, a value in line wit h est imat es by Aschauer(1989). In t his case G is more t han twice K and 36 t imes larger t han t he st ock of public capit al of t he economy wit h gamma equal t o 0.05.. The second fact is relat ed t o t he K -G rat io. In 1990, non-milit ary public net capit al st ock was somet hing between 41% of privat e net st ock, using a broad measure, or 24%, when we only consider equipment and “ core” infrast ruct ure (highways, sewer syst em, ut ilit ies, wat er supply syst em, airport and t ransit syst em) at St at e and local government levels (Munnel(1994)). From t able 1 we could make t he point , t herefore, t hat t hese values imply gammas below 0.04 as G/ K is 0.41 when gamma is 0.04 and 0.22 when gamma is zero5. Bot h fact s reinforce our decision t o use only gamma values between zero and 0.05 in t he simulat ion exercises.
5.2
W elfar e E¤ ect s of Pr i vat i zat ion
The welfare measure used compares steady st at es and is based on t he change in consumpt ion required t o keep t he consumer as well-o¤ under t he new pol-icy (privat izat ion) as under t he original one, when infrast ruct ure was public provided. The measure of welfare loss (or gain) associat ed wit h t he new policy is obt ained by solving for x in t he following equat ion:
U = ln (C¤(1 + x)) + A ln (1¡ H¤)
In t he above expression U is st eady-st at e ut ility level under t he original policy, C¤ and H¤ are consumpt ion and hours worked associated wit h t he
new policy. Welfare changes will be expressed as a percent of steady-st at e out put ( 4 C=Y ), where 4 C ( = C¤x ) is t he t ot al change in consumpt ion
required t o rest ore an individual t o his/ her previous ut ility level.
Before invest igat ing t he result s of t he welfare exercises, a look at …gures 3 and 4 may be illust rat ive.
5Care must be t aken, however, when comparing …rst moment s; for inst ance, t he capit
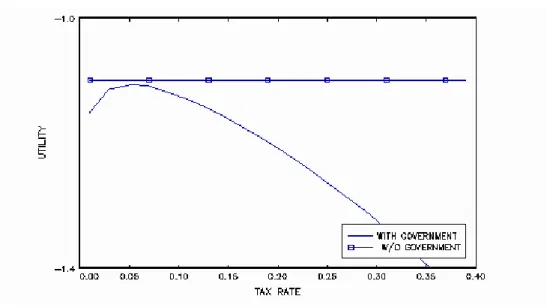
Figure 3: St eady st at e ut ility levels (° = 0:0)
Figure 4: St eady st at e ut ility levels (° = 0:03)
t his model. The ot her line represent s ut ility levels in t he economy wit h government . As already comment ed, it init ially increases wit h ¿, reaches a maximum at ¿¤ and t hen decreases when t he dist ort ionary e¤ect of t axat ion
outweigh t he product ive impact of infrast ruct ure. In …gure 3 gamma is zero and t he economy wit h public infrast ruct ure is dominat ed, in t erms of ut ility, by t he economy wit h privat e provision of infrast ruct ure, for any t ax rat e. On t he ot her hand, for gamma equal t o 0.03, t here is a t ax int erval where ut ility levels are great er in t he economy wit h government t han in the econ-omy wit hout it . Hence, in t he …rst case t here is pot ent ial for welfare gains from privat izat ion while in t he second case society may lose wit h it (if t he government behaves opt imally).
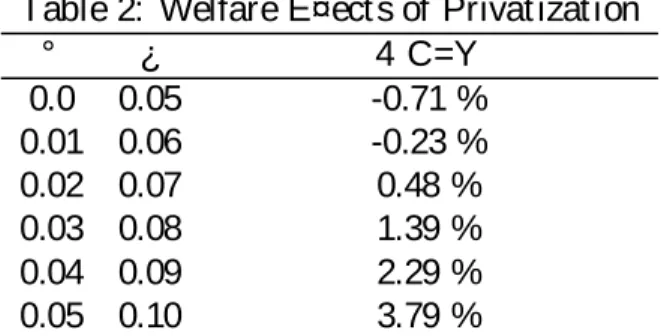
Table 2 below displays t he result of t he welfare calculat ions. In all cases t ax rat es are picked so t hat t hey maximize t he represent at ive agent ’s ut ility as explained in sect ion 2.
Table 2: Welfare E¤ect s of Privat izat ion
° ¿ 4 C=Y
0.0 0.05 -0.71 % 0.01 0.06 -0.23 % 0.02 0.07 0.48 % 0.03 0.08 1.39 % 0.04 0.09 2.29 % 0.05 0.10 3.79 %
Posit ive numbers mean a welfare cost - aft er privat izat ion, it is necessary t o give back x% of consumpt ion to agents in order t o keep t hem as well-o¤ as t hey were before privat izat ion - while negat ive numbers mean a welfare gain, as consumpt ion should decreasefor ut ilit ies t o be equalized. Hence, according t o t he model simulat ions present ed above, privat izat ion is welfare improving if t he t rue value of gamma is less t han 0.01 (as a mat t er of fact , for gamma less t han 0.014). This gain is decreasing wit h gamma, which makes sense: for small gammas t he fact t hat t he benevolent government t akes t he posit ive ext ernality due t o G int o account when picking ¿is of minor import ance when compared t o t he dist ort ion int roduced t o …nance public invest ment .
of consumpt ion, inst ead of GNP, it was calculat ed t o be 0.32%. Taking t he consumpt ion per capit a in 1994 for t he U.S. as being approximat ely 18,500 dollars, t his result implies t hat in t he long run, aft er privat izat ion, each individual would increase his/ her consumpt ion by only 59 dollars a year. So, even t hough privat izat ion is welfare improving t he gain is very small. Maximum gain occurs for economies where t he t rue gamma is zero. In t his case welfare gain as a proport ion of GNP is 0.71% and as a proport ion of consumpt ion is almost 1%. Not very large but more relevant: annual consumpt ion would increase by almost 180 dollars in t he long run.
This result , however, is very sensit ive t o t he choice of paramet ers, espe-cially gamma. If t he t rue gamma is 0.02, not far from some est imat es in t he lit erat ure - and well below Aschauer’s and Munnel’s est imat es - society loses wit h privat e provision of infrast ruct ure services. In t his case t here is a welfare loss of half percent of GNP. Of course, as gamma increases, t he loss due t o t he privat e operat ion of infrast ruct ure increases, reaching almost 4% when gamma is 0.05 ( and t he t otal e¤ect of infrast ruct ure adds up to 0.1). In summary: when we make t he best case for public operat ion of infrast ruct ure (e.g., no operat ion ine¢ ciencies, benevolent government , et c.) we may have welfare losses associat ed wit h privat izat ion, for some reasonable combinat ion of paramet ers.
Table 3: Welfare E¤ect s of Privat izat ion (capit al t ax only)
° ¿ 4 C=Y
0.00 0.10 -1.92% 0.01 0.12 -1.74% 0.02 0.14 -1.36% 0.03 0.16 -0.79% 0.04 0.18 -0.06% 0.05 0.19 0.84%
The welfare gains from privat izat ion in t his economy are much higher, as one could expect . For gamma equal t o 0.02 t he gains are now 1.36% of GNP, or 1.85% of t ot al consumpt ion, which amount s to an increase of $342 dollars in t he annual per capit a consumpt ion in t he long run. At t he same t ime, welfare losses wit h privat izat ion will only occur now for gammas above 0.041. It is also shown in t he t able t hat when gamma is 0.03, inst ead of a loss of 1.4% as in t he previous case, t here is now a gain of 0.8% of GNP. The reason for t hese result s are simple, t he gains from int ernalizing t he posit ive ext ernality are now o¤set by higher dist ort ions, so t hat you need higher ext ernality for privat izat ion not t o be welfare improving. Of course, assuming a tax st ruct ure wit h less dist ort ions (e.g., only t ax on labor income) would imply t he opposit e result s and weaken t he case for privat izat ion.
5.3
W elfar e e¤ ect s of pr i vat izat i on w it h i nvest m ent
l osses
Maybe t he most popular argument favoring privat izat ion is based on t he supposed ine¢ ciency of public companies when compared t o privat e coun-t erparcoun-t s. In one way or anocoun-t her, coun-t he idea is coun-t hacoun-t coun-t he former are nocoun-t pro…coun-t maximizing. T hey may operat e according t o some polit ical object ive (in‡a-t ion con(in‡a-t rol or pa(in‡a-t ronage), (in‡a-t hey may opera(in‡a-t e aiming (in‡a-t o maximize (in‡a-t he income of t heir employees or t hey may operat e wit h higher levels of red t ape or em-ployment . In all t hese cases operat ional cost s are well above minimizat ion level, so t hat society as a whole could gain if t hose …rms were t ransferred t o t he privat e sect or.
500%. At t he same t ime t he number of employees felt by 31%. In cert ain companies, such as t he federal railroad or t he Rio de Janeiro energy supplier, product ivity went up by almost 100% in less than two years. Hult en (1996), on t he ot her hand, …nds t hat ” ...those countries that use infrastructure in-e¢ ciently pay a growth penalty in the form of a much smaller bene…t from new infrastructure investments.” He est imat ed t hat one-quart er of t he dif-ferent ial growt h rat e between Africa and East Asia could be at t ribut ed t o t he di¤erence in e¤ect ive use of infrast ruct ure resources.
A t ent at ive and simple way of modeling t hese ine¢ ciencies is t o suppose t hat invest ment cost s are higher in t he public sect or. There is informal evi-dence t hat t his is in fact t he case, and t he reason is not necessarily corrupt ion but t he very nat ure of t he government ’s business and relat ionship wit h t he privat e sect or. In a number of count ries in Lat in America, for inst ance, pri-vat e …rms charge an over-price t o government companies as an insurance against payment delay or default risk, two common pract ices. In addit ion t o t hat , most purchases from public companies have t o be done t hrough pub-lic bids and in general t his is a long and bureaucrat ic process. T hose …rms cannot simply ask prices by phone or fax and pick t he best one, in general t here is a huge number of legal procedures t hat t ake t ime and cost money and, in fact , end up inducing collusion of suppliers. For inst ance, t he o¢ cial development bank of t he Brazilian cent ral government (BNDES) calculat ed t hat t he const ruct ion of a hydroelect ric plant t hat t hey would …nance for a public …rm had its cost cut by half aft er it was t ransferred t o privat e hands. In a ext reme case, t he cost of invest ment project s of a privat ized st eel mill in Brazil dropped t o one t hird of it s original …gures.
A simple way t o model t his fact is t o suppose t hat inst ead of (7) we now have:
J = (1¡ ¸ )(¿rtKt + ¿wtHt + ¿¼);8t; 0· ¸ Á 1 (15)
so t hat a fract ion lambda of t ax revenues is lost and only (1¡ ¸ ) is e¤ect ively invest ed. This is equivalent t o suppose t hat public invest ment is1=(1¡ ¸ )
moderat e losses, and t he result s from t able 2 (lambda equal t o zero ) are reproduced for t he sake of comparison:
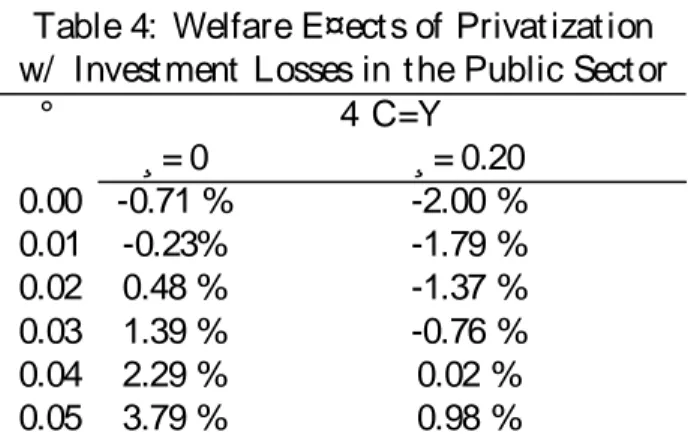
Table 4: Welfare E¤ect s of Privat izat ion w/ Invest ment Losses in t he Public Sect or
° 4 C=Y
¸= 0 ¸= 0.20 0.00 -0.71 % -2.00 % 0.01 -0.23% -1.79 % 0.02 0.48 % -1.37 % 0.03 1.39 % -0.76 % 0.04 2.29 % 0.02 % 0.05 3.79 % 0.98 %
The result s above show t hat even a moderat e invest ment loss may imply sizable di¤erences when considering privat izat ion. If invest ment in t he public sect or is 25% more cost ly t han in t he privat e sect or (¸ = 0.20) privat izat ion is welfare improving for economies wit h gamma up t o 0.039, a value in t he upper bound of most est imat es in t he lit erat ure. In t he case of gamma equal t o 0.03 a welfare loss of 1.39% of GNP is t urned int o a gain of 0.76%, i.e., a di¤erence of more t han 2% of GNP. The dist ortion int roduced by t he t ax syst em and t he high ine¢ ciency of invest ment operat ions o¤set t he gains of int ernalizing t he ext ernal e¤ect of infrast ruct ure capit al, even for high values of t he ext ernality paramet er. Moreover, t he gains are now much larger in t he int erval where privat izat ion was already welfare improving: for gamma equal t o 0.01, t he welfare gains from privat izat ion increased more t han 8 t imes.
6
P r i vat izat i on w it h Subsidy t o I nfr ast r
uc-t ur e A ccumulauc-t ion
The simulat ions showed t hat privat izat ion maybe welfare improving for a large number of economies, specially in t he presence of operat ion ine¢ ciency. Wit hout t hose, however, economies with reasonable combinat ion of param-et ers will st ill su¤er wit h privat izat ion. Could privat e operat ion of infras-t rucinfras-t ure be welfare improving for all economies wiinfras-t h appropriainfras-t e infras-t ax-subsidy schemes, as found by Devarajan et alii(1995) in an endogenous growt h envi-ronment ? Also, can we “ solve” t he under-invest ment result t hat is opt imal but maybe non-int uit ive, as one does not see infrast ruct ure stocks decreasing aft er privat izat ion? A model is construct ed below t o answer t hese quest ions. A subsidy t o t he accumulat ion of type G capit al, …nanced by proport ional t axes on t he ret urn of all fact ors, is int roduced in t he model of sect ion 3. Hence, t he subsidy scheme is done so t hat aft er privat izat ion agent s will in-t ernalize, ain-t leasin-t parin-t ially, in-t he exin-t ernal e¤ecin-t due in-t o infrasin-t rucin-t ure. As we will see, t he answer t o t he quest ions above are as follows: 1) an opt imal t ax-subsidy scheme increases t he bene…ts and the set of economies in which privat izat ion is welfare improving but it does not dominat e public provision of infrast ruct ure when gamma is large enough; 2) t here is less under-invest ment , but under public provision equilibrium G is st ill larger t han under privat e provision.
Suppose, again, t hat t ax rat es are t he same for all t he fact ors of produc-t ion and equal produc-t o¿, so t hat consumer’s budget const raint is given by
ct + it + jt = (rtkt + wtht + ½tgt) (1¡ ¿) ;8t (16)
Assume t hat t he consumer’s object ive funct ion, t he product ion funct ion and t he …rm’s problem remain t he same as before. Hence, equilibrium ex-pressions for t he fact or rewards are t he same as in model I I, t he privat ized economy. Government uses t ax revenues t o subsidize typegcapit al forma-t ion, so forma-t haforma-t iforma-t s law of moforma-t ion is now given by:
gt + 1= (1¡ ±)gt + (1 + Ã)jt
whereÃis t he subsidy rat e. It is imposed t hat t he public budget balances every period:
so t hat t he value of one of t he inst rument s of …scal policy,Ãor¿, is aut omat i-cally det ermined aft er t he ot her one is picked by t he government . Consumer’s problem in a recursive form is given by:
v(k; K ; g; G; G) = maxc;h;i
n
[ln(c) + A ln(1¡ h)] + ¯ v(k0; K0; g0; G0; G0)
o
; s:t :
c + i + j ·
³
r (K ; G; G)k + w(K ; G; G)h + ½(K ; G; G)g
´
(1¡ ¿) ;8t k0= (1¡ ±)k + i
K0= (1¡ ±)k + I
G0= (1¡ ±)G + (1 + Ã)J
g0= (1¡ ±)g + (1 + Ã)j
ÃJt = (rtKt + wtHt + ½tJt)¿
k0and g0>0 and given
It can be shown t hat , aft er some simple manipulat ions, solut ions for t his problem sat isfy t he following condit ions:
1 c =
¯
µ
µ (1¡ ¿)
³
K0 H0
´µ¡ 1³
G0 H0
´Á
G0° + (1¡ ±)
¶
c0 (17)
1 c =
¯
µ
Á(1 + Ã) (1¡ ¿)
³
K0 H0
´µ³
G0 H0
´Á¡ 1
G0° + (1¡ ±)
¶
c0 (18)
A 1¡ h =
(1¡ Á¡ µ) (1¡ ¿)
³
K0 H0
´µ³
G0 H0
´Á
G0°
c (19)
Equat ions17 and 19 are st andard Euler equat ions for capit al type K and labor, and t heir int erpret at ions follow t hose in sect ion 2. Equat ion 18 is t he Euler equat ion for capit al typeGin t he presence of subsidy. Everyt hing else const ant , it says t hat t he higher Ã, t he more t he consumer will be willing t o save and invest in t he present period. However, everyt hing else is not const ant : higher subsidies will have t o be …nanced t hrough higher t axes, which decreases t he net ret urn t o capit al and, consequent ly, savings in t he present period.
On t he one hand, t hrough t axat ion it dist ort s opt imal decisions and reduces t he ret urn of labor and of bot h capit als. On t he other hand, t he subsidy allows, at least part ially, t he int ernalizat ion of type G capit al ext ernality, which increases welfare. Tax rat es adjust in order t o balance public budget . As in sect ion 2, we are looking for a Ramsey equilibrium.
After solving t his problem t he experiment s of sect ion 5.2. were replicat ed in order t o calculat e t he welfare costs or gains of privat izat ion. Result s are present ed in t able 5 below.
Table 5:Welfare E¤ect s of Privat izat ion w/ Subsidy
° opt imal t ax rat e ( ¿¤) opt imal subsidy ( Ã) 4 C=Y
0.0 0.005 0.125 -0.815%
0.01 0.009 0.211 -0.513 % 0.02 0.013 0.287 -0.071 % 0.03 0.016 0.340 0.499 %
0.04 0.020 0.407 1.188%
0.05 0.024 0.470 1.990%
Two main di¤erences were found between t he result s of t he …rst simula-t ions and simula-t he presensimula-t ones, as one can see by comparing simula-t able 5 and simula-t able 2. First , as we could expect , for a given gamma welfare gains are bigger wit h t han wit hout subsidy, as agent s now int ernalize t he ext ernal e¤ect due t oG. This di¤erence increases wit h gamma: when gamma is zero it is only 0.1%, but it rises t o 0.28% when gamma is 0.01. T he int uit ion is simple: t he higher t he ext ernal e¤ect due t o infrast ruct ure capit al, t he more society gains by subsiding it s invest ment .
gamma is 0.04, for inst ance, t he loss from privat e provision of infrast ruct ure services is 1.18% in t he …rst case and 2.49% in t he last one. This is so be-cause t here is also t axat ion on labor and typeK capit al. Not e also t hat t he opt imum subsidy increases wit h gamma, as one might expect. Of course, if invest ment losses were also assumed, as in t he previous sect ion, t he set of economies t hat bene…t from privat izat ion would furt her increase .
Table 6 below compares allocat ions before and aft er privat izat ion. It st ill the case t hat typeG capit al and J are considerably smaller under pri-vat e t han public provision, even in t he presence of subsidy. Hence, under-invest ment in infrast ruct ure remains t he optimal act ion aft er privat izat ion and t he ext ernality is only part ially int ernalized.
Table 6: Long Run Allocat ions
Public G Privat e G w/ subsidy
° Y K G Y K G
0.00 1.05 9.63 2.09 1.09 10.51 1.74 0.01 1.07 9.76 2.59 1.11 10.62 1.89 0.02 1.10 9.93 3.08 1.22 10.74 2.02 0.03 1.14 10.15 3.64 1.14 10.87 2.15 0.04 1.18 10.39 4.24 1.16 11.02 2.28
Comparing t he result s above wit h privat e provision wit hout subsidy (t a-ble I), however, t here is an increase in t he equilibrium quant it ies of G for any gamma as t he ext ernality is now t aken int o account . Furt hermore, t his variable becomes much more sensitive t o changes in t he paramet er gamma. For inst ance, moving from economies wit h no ext ernality t o economies wit h a 0.04 ext ernality, t he long run st ock of G increases 31%. Wit hout subsidy,
7
Concl usi on and Sum m ar y
This model economy, alt hough in cert ain dimensions highly simpli…ed, does deliver some lessons and int uit ions t hat allow us to bet t er underst and t he welfare and allocat ion implicat ions of infrast ruct ure privat izat ion.
The …rst lesson, also present in Devarajan et alii(1998), is t hat priva-t izapriva-t ion can be welfare-enhancing in one counpriva-t ry and welfare-decreasing in anot her, depending on t he relat ive import ance of dist ort ionary t axat ion and t he posit ive ext ernality due t o infrast ruct ure. Our simulat ions showed t hat if we make st rong hypot heses t hat favor the case of public provision of infras-t rucinfras-t ure, such as a benevoleninfras-t governmeninfras-t maximizing individuals’ welfare, no operat ion ine¢ ciency and free supply of infrast ruct ure services t o soci-ety, privat e operation of infrast ruct ure only dominat es public operat ion if t he act ual value of t he sum of t he ext ernal and int ernal e¤ect s of public capit al is relat ively small (below 0.065). Est imat es of Rat ner(1983), Du¤y-Deno and Ebert s(1991), Canning and Fay(1993) and Ba¤es and Shah(1993) found values between 0.05 and 0.10 for t he sum of t hese coe¢ cient s. On t he ot her hand, t he simulat ions wit h only capit al income t axat ion showed t hat for a given ext ernality e¤ect , t he more dist ort ing the …nancing of public invest ment , t he higher t he bene…ts from privat izat ion.
A second conclusion is t hat t he case for privat izat ion is considerably st rengt hened when ine¢ ciencies in t he public sect or are allowed . And in-e¢ ciency is wit hout quest ion a serious problem in t he operat ion of public infrast ruct ure. For inst ance, t he World Bank(1994) est imates t hat t imely maint enance expenditures of $12 billion dollars would have saved road re-const ruct ion cost s of $45 billion in Africa in t he past decade, while informal evidence from Brazil has indicated t hat invest ment cost s could drop t o half aft er privat izat ion. Simulat ions in sect ion 5.3 showed t hat even a small over-price on invest ment considerably increases t he bene…ts of privat izat ion. And t hey would also increase t he set of economies (i.e., economies wit h larger ext ernalit ies) t hat could bene…t from privat e provision of infrast ruct ure. For inst ance, if invest ment cost s decrease by one quart er aft er privat izat ion, t hen for almost all reasonable set s of paramet ers privat e operat ion of infrast ruc-t ure would dominaruc-t e iruc-t s operaruc-t ion by ruc-t he public secruc-t or,
Second, it expands t he set of economies in which privat izat ion is welfare im-proving, even t hough it does not dominat e public provision of infrast ruct ure when gamma is large enough. Finally, t here is less under-invest ment wit h respect t o t he privat izat ion wit hout subsidy scheme, in spit e of the fact t hat under public provision equilibrium G is always larger t han under privat e provision.
R efer ences
[1] Ai, C. and S. Cassou(1995), “ A Normat ive Analysis of Public Capit al,” Applied Economics, 27, pp. 1201-1209.
[2] Aschauer, D., (1989) “ Is Public Expendit ure Product ive?,” Journal of Monet ary Economics, 23, March, pp. 177-200.
[3] Ba¤es and Shah(1993) “ Product ivity of Public Spending, Sect orial Allo-cat ion Choices, and Economic Growt h,” Policy Research Working Paper 1178, World Bank.
[4] Baxt er, M. and R. K ing, (1993) “ Fiscal Policy in General Equilibrium,” American Economic Review, 83, pp. 315 - 334.
[5] Cassou, S. and K. J. Lansing. (1998) ” Opt imal Fiscal Policy, Public Cap-it al, And T he Product ivCap-ity Slowdown,” Journal of Economic Dynamics and Cont rol, 1998, v22(6,May), pp. 911-935.
[6] Canning, D. and M. Fay(1993) “ The E¤ect of Transport at ion Networks on Economic Growt h,” manuscript , Columbia University.“
[7] Chari, V.V., L. Christ iano and P. K ehoe(1994) “ Opt imal Fiscal Policy in a Business Cycle Model, Journal of Political Economy, 102, pp. 617-652. [8] Cooley, T . F. and G. D. Hansen (1989) “ The In‡at ion Tax in a Real Business Cycle Model,” American Economic Review, 79, pp. 733 - 48. [9] Cooley, T.F. and E. Prescot t (1995). ” Economic Growt h and
[10] Devarajan, Xie and Zou(1998) “ Should Public Capit al Be Subsidized or Provided?” , Journal of Monet ary Economics, 41, pp. 319-332.
[11] Du¤y-Deno, K . and R.W. Ebert s(1991), “ Public Infrast ruct ure and Re-gional Economic Development : a Simult aneous Equat ions Approach,” Journal of Urban Economics, 30, pp. 329-43.
[12] East erly, W and S. Rebelo (1993) “ Fiscal Policy and Economic Growt h: an Empirical Invest igat ion,“ Journal of Monet ary Economics, 32, pp. 417-458.
[13] Glomm, G. and B. Ravikumar (1994) ” Public Invest ment in Infrast ruc-t ure in a Simple Growruc-t h Model,” Journal of Economic Dynamics and Cont rol, 16, pp. 1173-1187.
[14] Glomm, G. and B. Ravikumar (1997) “ Product ive Government Expen-dit ures and Long-Run Growt h,” Journal of Economic Dynamics and Cont rol, 21, pp. 183-204.
[15] Gramlich, E.M.(1994) “ Infrast ruct ure Invest ment : a Review Essay,” Journal of Economic Lit erat ure, 32, pp. 1176-1196.
[16] Hansen, G., e E. Prescot t (1995) “ Recursive Met hods for Comput ing Equilibria of Business Cycles Models,“ in Cooley. T. (org.) Front iers of Business Cycle Research, Princet on University Press.
[17] Holt z-Eakin, D. (1992), “ Public Sect or Capit al and Product ivity Puz-zle,” NBER Working Paper no. 4122.
[18] Hult en, C. (1996) “ Infrast ruct ure Capit al and Economic Growt h: How Well You Use it May Be More Import ant Than How Much You Have,” NBER Working Paper 5847.
[19] Hult en, C. and R. Schwab (1992), “ Public Capit al Format ion and t he Growt h of Regional Manufact uring Indust ries,” Nat ional Tax Journal, v.. 45, 4, pp. 121 - 143.
[21] Munnel, A.H., (1990) “ How Does Public Infrast ruct ure A¤ect Regional Economic Performance,“ New England Economic Review, Sept ember, pp. 11-32.
[22] Munnel, A.H., (1994) “ An Assessment of Trends in and Economic Im-pact s of Infrast ruct ure Invest ment ,” in Infrast ruct ure Policies for t he 1990s, OECD, pp. 21-54.
[23] Pinheiro, A.C.(1997) ” No que Deu A…nal a Privat ização?,” manuscript , BNDES.
[24] Prescot t , E. C., (1986) “ Theory Ahead of Business Cycle Measurement ,” Federal Reserve Bank of Minneapolis Quart erly Review, 10, pp. 9 - 22. [25] Prescot t , E. C., and R. Mehra(1980) “ Recursive Compet it ive Equilib-rium: the Case of Homogeneous Households,” Economet rica, 48, pp. 1356-79.
[26] Rat ner, J.(1983) ” Government Capit al and t he Product ion Funct ion for U.S. Privat e Out put ,” Economic Let t ers, 13, pp. 213-217.
[27] Turnovsky, S. J. and W. H. Fisher.(1995) ” The Composit ion Of Gov-ernment Expendit ure And It s Consequences For Macroeconomic Per-formance,” Journal of Economic Dynamics and Cont rol, v19(4), pp. 747-786.