Adv. Sci. Res., 12, 179–186, 2015 www.adv-sci-res.net/12/179/2015/ doi:10.5194/asr-12-179-2015
© Author(s) 2015. CC Attribution 3.0 License.
EMS
Ann
ual
Meeting
&
10th
European
Conf
erence
on
Applied
Climatology
(ECA
C)
Spatial patterns of European droughts under a moderate
emission scenario
J. Spinoni1, G. Naumann2, and J. Vogt3
1European Commission, Joint Research Centre, Institute for the Protection and Security of the Citizen,
Ispra, Italy
2CONICET, National Scientific Technical and Research Council, Buenos Aires, Argentina
3European Commission, Joint Research Centre, Institute for the Environment and Sustainability, Ispra, Italy
Correspondence to:J. Spinoni ([email protected])
Received: 15 January 2015 – Revised: 30 April 2015 – Accepted: 22 June 2015 – Published: 24 July 2015
Abstract. Meteorological drought is generally defined as a prolonged deficiency of precipitation and is con-sidered one of the most relevant natural hazards as the related impacts can involve many different sectors. In this study, we investigated the spatial patterns of European droughts for the periods 1981–2010, 2041–2070, and 2071–2100, focusing on the projections under a moderate emissions scenario. To do that, we used the outputs
of the KNMI-RACMO2 model, which belongs to the A1B family and whose spatial resolution is 0.25◦×0.25◦.
By means of monthly precipitation and potential evapotranspiration (PET), we computed the Standardized Pre-cipitation Index (SPI) and the Standardized PrePre-cipitation Evapotranspiration Index (SPEI) at the 12-month ac-cumulation scale. Thereafter, we separately obtained drought frequency, duration, severity, and intensity for the whole of Europe, excluding Iceland. According to both indicators, the spatial drought patterns are projected to follow what recently characterized Europe: southern Europe, who experienced many severe drought events in the last decades, is likely to be involved by longer, more frequent, severe, and intense droughts in the near fu-ture (2041–2070) and even more in the far fufu-ture (2071–2100). This tendency is more evident using the SPEI, which also depends on temperature and consequently reflects the expected warming that will be highest for the Mediterranean area in Europe. On the other side, less severe and fewer drought events are likely to occur in northern Europe. This tendency is more evident using the SPI, because the precipitation increase is projected to outbalance the temperature (and PET) rise in particular in Scandinavia. Regarding the mid-latitudes, the SPEI-based analyses point at more frequent drought events, while the SPI-SPEI-based ones point at less frequent events in these regions.
1 Introduction
Drought is a slowly developing natural hazard which can af-fect large areas and populations, can propagate through the full hydrological cycle, and may have both immediate con-sequences as well as long-term economic and environmental impacts (Vogt et al., 2011; Vogt and Somma, 2000). Drought is a temporary condition that can result in irreversible dam-ages to ecosystems and can take place in almost all climates, not only in areas prone to land degradation (Winslow et al., 2011).
Due to its complex evolution and onset, there is no single definition of drought, and the scientific literature usually
triggered by high temperatures, low relative humidity, strong and desiccating winds, etc. (Zampieri et al., 2009). The im-pacts of meteorological and hydrological drought events in-volve a wide variety of sectors, e.g. agriculture (Ciais et al., 2005), soil (Hirschi et al., 2011), ecology (McDaniels et al., 1997), and energy (Hightower and Pierce, 2008).
At the global level, recent climate change seems to have caused only little increase in drought (Dai, 2011; Sheffield et al., 2012; Spinoni et al., 2014; Trenberth et al., 2014). However, at the regional level some areas experienced a re-markable increase in drought frequency and severity over the last decades, for example in the Carpathian region (Spinoni et al., 2013), southern Europe (van der Schrier et al., 2013; Beguería et al., 2014; Spinoni et al., 2015a), and in partic-ular the Mediterranean region (Briffa et al., 2009; Hoerling et al., 2012). According to the latest report of the Intergov-ernmental Panel on Climate Change (IPCC, 2014), global warming will generally drive the dry regions to drier con-ditions and the wet ones to wetter concon-ditions. This can be ap-plied to Europe as a whole, as southern Europe is projected to get drier and northern Europe to get wetter (Spinoni et al., 2015a). Though there is indeed a general tendency towards a drier world (Sherwood and Fu, 2014), at the global level the
paradigm the dry gets drier, and the wet gets wettershould
be handled with care (Greve et al., 2014).
This study has been conducted in the framework of the GAP-PESETA project, the follow-up of the Joint Research Centre’s PESETA II project, whose main goal was to gain insights into the patterns of climate change impacts in Eu-rope and was focused on many topics (agriculture, energy, floods, forest fires, etc.) but provided only preliminary infor-mation regarding drought, i.e. about streamflow drought only (Ciscar et al., 2014). We dealt with spatial drought patterns from 1950 to 2100, investigating in particular the evolution of drought events under a moderate emissions scenario (fam-ily A1B, see IPCC, 2000) in the near future (period: 2041– 2070) and in the far future (2071–2100) compared with the recent past (1981–2010). The examined area is Europe, in-cluding European Russia, but exin-cluding Iceland, Greenland, the Azores, the Canary Islands, and Madeira. We computed two drought indicators, the Standardized Precipitation Index (SPI; McKee et al., 1993) and the Standardized Precipita-tion EvapotranspiraPrecipita-tion Index (SPEI; Vicente-Serrano et al., 2010), at the monthly scale for every grid point (spatial
reso-lution: 0.25◦
×0.25◦) belonging to the examined area. Such
indicators have been used to calculate the frequency, dura-tion, severity, and intensity of drought events on the same grid.
This study has three main goals: firstly, it aims at pro-viding new insights about future droughts in Europe at a spatial resolution higher than most of the existing studies,
which usually analyze data at 0.5◦×0.5◦ or 1◦×1◦
res-olution, or focus on smaller regions (see, e.g. Blenkinsop and Fowler, 2007); secondly, it focuses on drought events, differently than most of the publications, which usually
fo-cus on drought-related climate indicators (see, e.g. Heinrich and Gobiet, 2012); thirdly, it aims at evaluating whether and where a potential evapotranspiration (PET) increase will be the leading factor for drought and, on the other side, whether and where the drought trends will be driven by precipitation. In this study, we did not consider potential human-induced changes in future drought patterns, because meteorological droughts do not directly depend on human activities, as other types of droughts do, e.g. the hydrological drought (Wanders and Yada, 2015).
After the introduction, Sect. 2 deals with data and meth-ods: we describe the data inputs and the quality checks, we motivate the choice of the indicators and their computation algorithms, and we define the drought variables. Section 3 deals with results and discussions: we present figures about the change of frequency, duration, severity, and intensity of drought events in Europe between the near (and far) future and the recent past. Section 3 also focuses on the debate about which will be the most important meteorological driver for future droughts in Europe. Section 4 briefly summarizes the main findings and anticipates possible future develop-ments.
2 Data and methods
2.1 Scenario model, input variables, and study region
The PESETA II project based its projections on the outputs of the version 2.1 of the KNMI regional atmospheric climate model RACMO (van Meijgaard et al., 2008), consequently we chose such model for our analyses. The RACMO2 is pro-vided by the Royal Meteorological Institute of the Nether-lands, its driving global circulation model (GCM) is the ECHAM5-RT3, and it belongs to the A1B scenario family. The special report on the emissions scenarios published by the IPCC in 2000 (IPCC, 2000) divides them into four main groups: A1, A2, B1, and B2. The A1 family describes a fu-ture world of very rapid economic growth, global population that peaks in the 2050s and declines thereafter, and the rapid introduction of new and more efficient technologies. This category is further subdivided into categories which corre-spond to different directions of technological change in the energy system: fossil intensive energy sources (A1FI), non-fossil energy sources (A1T), and balance across all sources (A1B). The A1B scenario foresees moderate but increasing
emissions of carbon dioxide (CO2) and methane (CH4) until
the 2050s, followed by a slow decrease. Nitrous oxide (N2O)
emissions are projected to be stable through the whole of the
century, and the sulfur dioxide (SO2) emissions are projected
it seems to slightly overestimate the emissions and the rise of temperature.
From the RACMO2 model, we directly obtained monthly precipitation, and we derived PET using the FAO-56 Penman–Monteith algorithm (Allen et al., 1998), from January 1950 to December 2100 (spatial resolution of
0.25◦×0.25◦). The selected area is Europe, but we excluded
the small atlantic islands (Madera, the Azores, and the Ca-nary Islands) and Iceland, for a few grid points there showed suspect precipitation data in the 2000s according to the quality-checks and the homogenization tests performed with the Multiple Analysis of Series for Homogenization software (MASH, version 3.03, Szentimrey, 1999).
The choice of the algorithm to derive PET is a key point regarding the computation of drought variables (van der Schrier et al., 2011; Trenberth et al., 2014). We chose the Penman–Monteith equation because the outputs of the RACMO2 model include the input variables needed, i.e. tem-perature, relative humidity, solar radiation, and wind speed. Other common formulations are based on mean tempera-ture (Thornthwaite; Thornthwaite, 1948) or on minimum and maximum temperature (Hargreaves and Samani, 1982; Allen et al., 1998). Recently, contradictory opinions emerged about the validity of such simplified formulations: Sheffield et al. (2012) pointed at the overestimation of drought trends based on temperature-only-based PET estimations, while Dai (2011) and van der Schrier et al. (2011) affirmed that the choice of the PET formulation does not remarkably af-fect drought indicators such as the PDSI (Palmer, 1965) and the sc-PDSI (Wells et al., 2004) in Europe. However, keeping
in mind that we usedpotentialand notactual
evapotranspira-tion (AET) and that this could bias the results in soil moisture stressed areas (Brutsaert and Parlange, 1998), we discarded the temperature-only-based PET models as they may influ-ence too much the projections of drought events due to the projected temperature rise in the A1B scenario, especially in the far future.
2.2 Drought indicators, events, and derived variables
The monthly precipitation and PET series – from 1950 to 2100 – have been used to compute the Standardized Precip-itation Index (SPI: McKee et al., 1993), which depends on precipitation, and the Standardized Precipitation Evapotran-spiration Index (SPEI, Vicente-Serrano et al., 2010), which depends on the difference between precipitation and PET. We chose the SPI for it is probably the most applied drought in-dicator at the European level (e.g. Lloyd-Hughes and Saun-ders et al., 2002), but considering that the scenarios describe a warming future (IPCC, 2014), we assumed that it is impor-tant to consider also one indicator that directly or indirectly depends on temperature; thus we included the SPEI that is nowadays frequently applied in Europe (e.g. Vicente-Serrano et al., 2014) in our analyses.
We computed the SPI and the SPEI at the 12-month scale, and we fitted the cumulated precipitation with the Gamma distribution (Thom, 1958) for the SPI and the cumulated dif-ference between precipitation and PET with the log-logistic distribution (Shoukri et al., 1988) for the SPEI, following the approaches suggested by the authors who first presented such indicators, being also aware that different distributions could best fit the SPI and the SPEI in Europe, depending on the lo-cal climate features (Stagge et al., 2014, 2015). Dealing with standardized indicators, the length of the record used (Wu et al., 2005) and the choice of the baseline period (Guttman, 1999) are key issues: we used all the available data in the period 1950–2100 to fit the distributions. If a shorter period (e.g. 30-year interval) is chosen as the baseline for an indi-cator computed over a 151-year period and the selected pe-riod is characterized by frequent and severe drought events, this will influence the computation of the indicator and the other periods are bound to be characterized by less frequent and severe drought events. Because we were not interested in the absolute number of drought events (and their duration and severity) in a certain period, but we aimed at studying whether the drought events will be longer, more severe, fre-quent, or intense in the future compared to the recent past, the entire baseline ensures more robust comparisons between different periods.
This study focuses on the drought events, not on the in-dicators, and we separately analyzed them according to the SPI and the SPEI. Using the monthly series of the indicators at a grid point level, we followed Guerrero-Salazar and Yev-jevich (1975) and McKee et al. (1993) to define the events. In this study, a drought event takes place every time the
indi-cator falls below−1 for at least 2 consecutive months, and it
ends when the indicator rises above 0. For a given period, the drought frequency is therefore the number of drought events. The duration of a drought event refers to the number of months of the event, its severity to the integral area of the event (the sum of the indicator values below zero, in absolute values, during the occurrence of the event), and its intensity to the ratio between severity and duration. We computed the frequency and the average duration, severity, and intensity of the drought events over 30-year periods: recent past (1981– 2010), near future (2041–2070), and far future (2071–2100). The results are presented as comparisons between recent past and, respectively, near (Fig. 1) and far future (Fig. 2).
3 Results and Discussion
3.1 Drought patterns in the near future (2041–2070)
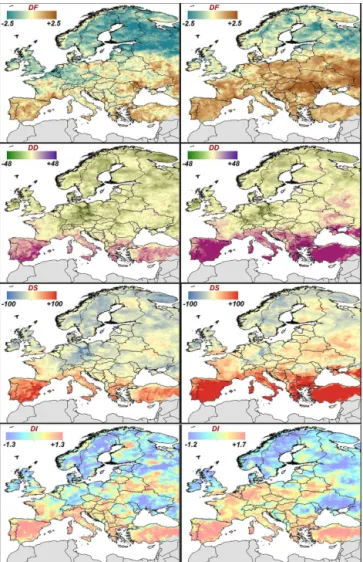
Figure 1.Comparisons between near future and recent past for the frequency (DF), duration (DD), severity (DS), and intensity (DI) of drought events, according to the SPI-12 (left panel) and the SPEI-12 (right panel). All the values are expressed per decade.
According to the SPI, the drought events are projected to be more frequent in the near future (2041–2070) than in the recent past (1981–2010) in the Mediterranean region, in the Balkans, along the Black Sea coast and in general in southern Europe. On the contrary, Scandinavia (but not southern Swe-den) and the Baltic republics are projected to be involved by fewer drought events. According to the SPEI, the gradient be-tween northern and southern Europe is remarkable and also the European mid-latitudes are projected to be involved by more frequent droughts (up to 2.3 more events per decade).
Regarding the duration and according to the SPI, the drought events are projected to be longer in the near future than in the recent past in Spain, the French Riviera, Sicily and Sardinia, Greece, and Turkey, and shorter in Northern Ireland, central Europe, and Scandinavia. According to the SPEI, they will be longer in the entire Mediterranean re-gion and the Balkans, and shorter in the same rere-gions high-lighted by the SPI. According to both the indicators, the
Figure 2.Comparisons between far future and recent past for the frequency (DF), duration (DD), severity (DS), and intensity (DI) of drought events, according to the SPI-12 (left panel) and the SPEI-12 (right panel). All the values are expressed per decade.
drought events are projected to follow, on average, the same spatial patterns regarding the severity and the duration. In-stead, the spatial patterns of the drought intensity are less ho-mogeneous. The average intensity is projected to be higher in central Spain, north-eastern France, northern Italy, the Carpathian region, the Balkans, Belarus, Greece, and Turkey. On the contrary, it is projected to be lower especially in Scan-dinavia and Ukraine.
(SPEI) frequent and intense events depending on the indica-tor, shorter and less severe events for both indicators.
A more detailed description of the varying importance of precipitation deficit vs. temperature extremes in a chang-ing climate goes beyond the scopes of this paper. However, the authors more thoroughly discussed on that in Spinoni et al. (2015a, b) and the reader can also find more details on other recent publications, such as Paulo et al. (2012); Vicente-Serrano et al. (2014); Kingston et al. (2015).
3.2 Drought patterns in the far future (2071–2100)
We repeated the analyses discussed in Sect. 3.1, this time for the far future (2071–2100) compared with the recent past (1981–2010), see Fig. 2. According to the SPI, southern Eu-rope is projected to be involved in more frequent droughts in the far future than in the recent past, and this higher fre-quency will be more evident according to the SPEI. Northern Europe will be hit by fewer droughts for both the indicators, while central Europe shows different patterns: no particular changes for the SPI, excluding a frequency decrease for Ger-many vs. more drought events reaching up to latitudes corre-sponding to Denmark for the SPEI. To summarize, it seems that the PET increase will be the driver for drought frequency increase in the far future as well as in the near future for most of Europe, excluding Scandinavia and northern Russia.
From Fig. 2 we can notice that, according to the SPI, the Mediterranean region – and southern Europe in general – are expected to be hit by longer, more severe, and intense droughts in the far future. Such increasing tendencies are even more pronounced for duration and severity in Spain, Greece, and Turkey, according to the SPEI. Instead, the de-crease in northern European regions is lower in absolute val-ues. If we compare the far future with the near future (not shown), the drought duration and severity increase in the far future compared to the near future is relevant only in Spain according to the SPI, while it is relevant in every part of
Eu-rope below 45◦N of Latitude according to the SPEI. Once
again, it seems that the global warming tendency will cause the increase of drought length and severity at the end of the century, even under a moderate emissions scenario.
The intensity of the drought events is projected to increase for both the indicators in the far future in southern Europe and Belarus, and to decrease in Irealand, Scotland, Scandi-navia, Ukraine, and Russia. Germany again shows contradic-tory patterns: according to the SPI, fewer, shorter, less severe, and less intense drought events will occur, while according to the SPEI the droughts will be more frequent and intense, but also shorter.
We underline that the results discussed in this chapter and in the previous one have been derived from indicators based on 12-month accumulation, i.e. a whole year, conse-quently the seasonal effects are lost as well as the seasonality of precipitation and evapotranspiration. To overcome such a shortage of data, we plan performing new analyses based on
Figure 3.Country tendencies towards drier or wetter near and far future, according to the SPI-12 (left panel) and the SPEI-12 (right panel).
shorter accumulation periods (SPI-3 and SPEI-3), in order to study the seasonal spatial drought patterns which may be different from annual patterns in some parts of Europe, both during the current and future climate.
3.3 Projected drought patterns at a country scale
To provide a general picture of the future European drought tendencies, we analyzed the complete monthly records of the indicators from 1950 to 2100. We averaged them at a country level, and we compared their values for the three periods al-ready investigated in the previous chapters. Because this part is based on country averages and European Russia is not a country, we excluded it from the analyses.
Figure 3 shows that the southern European countries are projected to be drier in the near future than in the recent past. In particular, the SPEI indicator projects drier condi-tions than the SPI indicators for the Mediterranean countries, the Balkans, and Turkey. According to the SPI, the central and northern European countries are projected to be wetter in the near future, in particular the Baltic republics and Fin-land. In general, in the far future a more extreme shift to-wards drier conditions for southern and eastern Europe can be seen, in particular according to the SPEI, and a more ex-treme shift towards a wetter central and northern Europe can be seen, in particular according to the SPI. In the last decades of the current century such shifts are projected to be extreme also by the SPI, especially regarding the shifts towards wetter conditions, but also towards drier conditions for the Iberian Peninsula and Greece.
et al., 2009; Hannaford et al., 2011; Hoerling et al., 2012; Spinoni et al., 2015a). Such spatial patterns are projected to continue – and increase in magnitude – until the end of the century, as also discussed by, e.g. Burke et al. (2006), Blenk-insop and Fowler (2007), and Warren et al. (2009) using dif-ferent drought indicators and moderate emission scenarios. In particular, compared to our findings, Warren et al. (2009) presented similar results (drought variables tend to increase in southern and eastern Europe, and decrease in northern Eu-rope) by using SPI-5 and SPI-12 projected in 2050–2098 under different emission scenarios; the only remarkable dif-ferences involve Romania, where a more pronounced ten-dency towards longer drought events was found by Warren et al. (2009).
4 Conclusions
In this study we investigated the tendency of drought events in Europe until 2100 under a moderate emissions scenario, the KNMI-RACMO2. To do that, we based our analyses on two drought indicators, the SPI and the SPEI, computed at a 12-month scale. Regarding the drought events, we defined four quantities (frequency, duration, severity, and intensity), and we compared the recent past (1981–2010) vs. the near (2041–2070) and the far future (2071–2100). The spatial
drought patterns have been analyzed both at 0.25◦
×0.25◦
and at the country scale.
We looked for the answers to a few questions: are the drought events likely to become more frequent in the future? Will they be longer? Will they be more severe and intense? Southern Europe, that already experienced a drying trend in the second part of the 20th century (see, e.g. IPCC, 2014), is projected to be affected by more frequent, severe, intense, and longer drought events in the near future and even more in the far future. The drying trend is driven by the combina-tion of PET increase and precipitacombina-tion decrease. Oppositely, northern Europe, the area that experienced a trend toward wetness from the 1970s onwards (IPCC, 2014), is projected to be involved by fewer and less intense droughts, mainly due to the projected precipitation increase.
The results of this study should be considered as a pre-liminary step towards more detailed analyses regarding the projections of European drought events. Many different as-pects could be introduced to refine the methodologies and the outputs. Among them we plan to study seasonal droughts, adding new indicators, using other models belonging to the A1B (see Meehl et al., 2005, for a summary) and different scenario families, performing tests to compute the statistical error intervals of the climate projections, and coupling the drought information with other climate extremes.
Acknowledgements. We would like to thank the two anonymous referees for their precious suggestions which helped improving the manuscript.
Edited by: O. Einar Tveito
Reviewed by: two anonymous referees
References
Allen, R. G., Pereira, L. S., Raes, D., and Smith, M.: Crop evapotranspiration-Guidelines for computing crop water require-ments, FAO Irrigation and drainage paper, 56, FAO, Rome, 15 pp., 1998.
Beguería, S., Vicente-Serrano, S. M., Reig, F., and Latorre, B.: Stan-dardized precipitation evapotranspiration index (SPEI) revisited: parameter fitting, evapotranspiration models, tools, datasets and drought monitoring, Int. J. Climatol., 34, 3001–3023, 2014. Blenkinsop, S. and Fowler, H. J.: Changes in European drought
characteristics projected by the PRUDENCE regional climate models, Int. J. Climatol., 27, 1595–1610, 2007.
Briffa, K. R., van Der Schrier, G., and Jones, P. D.: Wet and dry summers in Europe since 1750: evidence of increasing drought, Int. J. Climatol., 29, 1894–1905, 2009.
Brutsaert, W. and Parlange, M. B.: Hydrologic cycle explains the evaporation paradox, Natur, 396, 30–30, 1998.
Burke, E. J., Brown, S. J., and Christidis, N.: Modeling the recent evolution of global drought and projections for the twenty-first century with the Hadley Centre climate model, J. Hydrometeo-rol., 7, 1113–1125, 2006.
Ciais, P., Reichstein, M., Viovy, N., Granier, A., Ogée, J., Allard, V., Aubinet, M., Buchmann, N., Bernhofer, C., Carrara, A., Cheval-lier, F., De Noblet, N., Friend, A. D., Friedlingestein, P., Grün-wald, T., Heinesch, B., Keronen, P., Knohl, A., Krinner, G., Lous-tau, D., Manca, G., Matteucci, G., Miglietta, F., Ourcival, J. M., Papale, D., Pilegaard, K., Rambal, S., Seufert, G., Soussana, J. F., Sanz, M. J., Schulze, E. D., Vesala, T., and Valentini, R.: Europe-wide reduction in primary productivity caused by the heat and drought in 2003, Nature, 437, 529–533, 2005.
Ciscar, J. C., Feyen, L., Soria, A., Lavalle, C., Raes, F., Perry, M., Nemry, F., Demirel, H., Rozsai, M., Dosio, A., Donatelli, M., Sri-vastava, A., Fumagalli, D., Niemeyer, S., Shrestha, S., Ciaian, P., Himics, M., Van Doorslaer, B., Barrios, S., Ibáñez, N., Forzieri, G., Rojas, R., Bianchi, A., Dowling, P., Camia, A., Libertà, G., San Miguel, J., de Rigo, D., Caudullo, G., Barredo, J.-I., Paci, D., Pycroft, J., Saveyn, B., Van Regemorter, D., Revesz, T., Vandyck, T., Vrontisi, Z., Baranzelli, C., Vandecasteele, I., Batista e Silva, F., and Ibarreta, D.: Climate Impacts in Europe. The JRC Pe-seta II Project, JRC-IPTS Working Paper JRC8701, Institute for Prospective and Technological Studies, Joint Research Centre, Ispra, Italy, 2014.
Dai, A.: Drought under global warming: a review, Wiley Interdisci-plinary Reviews: Climate Change, 2, 45–65, 2011.
Greve, P., Orlowsky, B., Mueller, B., Sheffield, J., Reichstein, M., and Seneviratne, S. I.: Global assessment of trends in wetting and drying over land, Nat. Geosci., 7, 716–721, 2014.
Guerrero-Salazar, P. and Yevjevich, V.: Analysis of drought charac-teristics by the theory of runs, Fort Collins, Colorado: Colorado State University, Hydrology Papers, 80, 1–44, 1975.
Guttman, N. B.: Accepting the standardized precipitation index: a calculation algorithm, J. Am. Water Resour. As., 35, 311–322, 1999.
Eu-ropean drought using regional indicators of precipitation and streamflow deficit, Hydrol. Process., 25, 1146–1162, 2011. Hargreaves, G. H. and Samani, Z. A.: Estimating potential
evapo-transpiration, J. Irr. Drain. Div.-ASCE, 108, 225–230, 1982. Heinrich, G. and Gobiet, A: The future of dry and wet spells in
Europe: A comprehensive study based on the ENSEMBLES re-gional climate models, Int. J. Climatol., 32, 1951–1970, 2012. Hightower, M. and Pierce, S. A.: The energy challenge, Nature, 452,
285–286, 2008.
Hirschi, M., Seneviratne, S. I., Alexandrov, V., Boberg, F., Boroneant, C., Christensen, O. B., Formayer, H., Orlowsky, B., and Stepanek, P.: Observational evidence for soil-moisture im-pact on hot extremes in southeastern Europe, Nat. Geosci., 4, 17–21, 2011.
Hoerling, M., Eischeid, J., Perlwitz, J., Quan, X., Zhang, T., and Pegion, P.: On the increased frequency of Mediterranean drought, J. Climate, 25, 2146–2161, 2012.
Kingston, D. G., Stagge, J. H., Tallaksen, L. M., and Hannah, D. M.: European-Scale Drought: Understanding Connections between Atmospheric Circulation and Meteorological Drought Indices, J. Climate, 28, 505–516, 2015.
IPCC: IPCC Special Report on Emissions Scenarios. A Special Re-port of IPCC WG III, Cambridge University Press, Cambridge UK and New York, NY, 599 pp., 2000.
IPCC: Summary for policymakers, in: Climate Change 2014: Im-pacts, Adaptation, and Vulnerability. Part A: Global and Sectoral Aspects. Contribution of Working Group II to the Fifth Assess-ment Report of the IntergovernAssess-mental Panel on Climate Change, edited by: Field, C. B., Barros, V. R., Dokken, D. J., Mach, K. J., Mastrandrea, M. D., Bilir, T. E., Chatterjee, M., Ebi, K. L., Estrada, Y. O., Genova, R. C., Girma, B., Kissel, E. S., Levy, A. N., MacCracken, S., Mastrandrea, P. R., and White, L. L., Cam-bridge University Press, CamCam-bridge, United Kingdom and New York, NY, USA, 1–32, 2014.
Lloyd-Hughes, B. and Saunders, M. A.: A drought climatology for Europe, Int. J. Climatol., 22, 1571–1592, 2002.
McDaniels, T. L., Axelrod, L. J., Cavanagh, N. S., and Slovic, P.: Perception of ecological risk to water environments, Risk Anal-ysis, 17, 341–352, 1997.
McKee, T. B., Doeskin, N. J., and Kleist, J.: The relationship of drought frequency and duration to time scales, in: Proceedings of the 8th Conference on Applied Climatology, American Mete-orological Society, Boston, MA, 179–184, 1993.
Meehl, G. A., Arblaster, J. M., and Tebaldi, C.: Understand-ing future patterns of increased precipitation intensity in cli-mate model simulations, Geophys. Res. Lett., 32, L18719, doi:10.1029/2005GL023680, 2005.
Mishra, A. K. and Singh, V. P.: A review of drought concepts, J. Hydrol., 391, 202–216, 2010.
Mishra, A. K. and Singh, V. P.: Drought modeling – A review, J. Hydrol., 403, 157–175, 2011.
Palmer, W. C.: Meteorological drought, U.S. Weather Bureau Re-search Paper, 45, 58 pp., 1965.
Paulo, A. A., Rosa, R. D., and Pereira, L. S.: Climate trends and be-haviour of drought indices based on precipitation and evapotran-spiration in Portugal, Nat. Hazards Earth Syst. Sci., 12, 1481– 1491, doi:10.5194/nhess-12-1481-2012, 2012.
Sheffield, J., Wood, E. F., and Roderick, M. L.: Little change in global drought over the past 60 years, Nature, 491, 435–438, 2012.
Sherwood, S. and Fu, Q.: A Drier Future?, Science, 343, 737–739, 2014.
Shoukri, M. M., Mian, I. U. H., and Tracy, D. S.: Sampling proper-ties of estimators of the log-logistic distribution with application to Canadian precipitation data, Can. J. Stat., 16, 223–236, 1988. Spinoni, J., Antofie, T., Barbosa, P., Bihari, Z., Lakatos, M., Szalai, S., Szentimrey, T., and Vogt, J.: An overview of drought events in the Carpathian Region in 1961–2010, Adv. Sci. Res., 10, 21–32, doi:10.5194/asr-10-21-2013, 2013.
Spinoni, J., Naumann, G., Carrao, H., Barbosa, P., and Vogt, J. V.: World drought frequency, duration, and severity for 1951–2010, Int. J. Climat., 34, 2792–2804, 2014.
Spinoni, J., Naumann, G., Vogt, J., and Barbosa, P.: European drought climatologies and trends based on a multi-indicator ap-proach, Global Planet. Change, 127, 50–57, 2015a.
Spinoni, J., Naumann, G., Vogt, J. V., and Barbosa, P.: The biggest drought events in Europe from 1950 to 2012, Journal of Hydrology: Regional Studies, 3, 509–524, doi:10.1016/j.ejrh.2015.01.001, 2015b.
Stagge, J. H., Tallaksen, L. M., Xu, C. Y., and van Lanen, H. A. J.: Standardized precipitation-evapotranspiration index (SPEI): Sensitivity to potential evapotranspiration model and parameters, Proceedings of FRIEND-Water 2014, IAHS Red Book No. 363, Montpellier, France, 367–373, 2014.
Stagge, J. H., Tallaksen, L. M., Gudmundsson, L., van Loon, A. F., and Stahl, K.: Candidate distributions for climatological drought indices (SPI and SPEI), Int. J. Climatol., doi:10.1002/joc.4267, in press, 2015.
Szentimrey, T.: Multiple analysis of series for homogenization (MASH), Proceedings of the Second Seminar for Homogeniza-tion of Surface Climatological Data, Budapest, Hungary, WMO & WCDMP No. 41, 27–46, 1999.
Thom, H. C.: A note on the gamma distribution, Mon. Weather Rev., 86, 117–122, 1958.
Thornthwaite, C. W.: An approach toward a rational classification of climate, Geogr. Rev., 38, 55–94, 1948.
Trenberth, K. E., Dai, A., van der Schrier, G., Jones, P. D., Barichivich, J., Briffa, K. R., and Sheffield, J.: Global warming and changes in drought, Nature Climate Change, 4, 17–22, 2014. van der Schrier, G., Jones, P. D., and Briffa, K. R.: The sensitivity of the PDSI to the Thornthwaite and Penman-Monteith param-eterizations for potential evapotranspiration, J. Geophys. Res.-Atmos., 116, doi:10.1029/2010JD015001, 2011.
van der Schrier, G., Barichivich, J., Briffa, K. R., and Jones, P. D.: A scPDSI-based global dataset of dry and wet spells for 1901– 2009, J. Geophyis. Res., 118, 4025–4048, 2013.
van Meijgaard, E., van Ulft, L. H., van de Berg, W. J., Bosveld, F. C., van den Hurk, B. J. J. M., Lenderink, G., and Siebesma, A. P.: The KNMI regional atmospheric climate model RACMO version 2.1, Technical Report TR-302, Koninklijk Nederlands Meteorol-ogisch Instituut, De Bilt, The Netherlands, 50 pp., 2008. Vicente-Serrano, S. M., Beguería, S., and López-Moreno, J. I.: A
Vicente-Serrano, S. M., Lopez-Moreno, J. I., Beguería, S., Lorenzo-Lacruz, J., Sanchez-Lorenzo, A., García-Ruiz, J. M., Azorin-Molina, C., Moran-Tejeda, E., Revuelto, J., Trigo, R., Coelho, F., and Espejo, F.: Evidence of increasing drought severity caused by temperature rise in southern Europe, Environ. Res. Lett., 9, 044001, doi:10.1088/1748-9326/9/4/044001, 2014.
Vicente-Serrano, S. M., van der Schrier, G., Beguería, S., Azorin-Molina, C., and Lopez-Moreno, J. I.: Contribution of precipita-tion and reference evapotranspiraprecipita-tion to drought indices under different climates, J. Hydrol., 526, 42–54, 2015.
Vogt, J. and Somma, F. (Eds.): Drought and drought mitigation in Europe, Kluwer, Dordrecht, 325 pp., 2000.
Vogt, J. V., Safriel, U., Von Maltitz, G., Sokona, Y., Zougmore, R., Bastin, G., and Hill, J.: Monitoring and assessment of land degradation and desertification: Towards new conceptual and in-tegrated approaches, Land Degrad. Dev., 22, 150–165, 2011. Wanders, N. and Yada, Y.: Human and climate impacts on the 21th
century hydrological drought, J. Hydrol., 526, 208–220, 2015.
Warren, R., Yu, R., Osborn, T., and de la Nava Santos, S.: Future European drought regimes under mitigated and un-mitigated cli-mate change, IOP Conf. Ser.: Earth Environ. Sci., 6, 292012, doi:10.1088/1755-1307/6/29/292012, 2009.
Wells, N., Goddard, S., and Hayes, M. J.: A self-calibrating Palmer drought severity index, J. Climate, 17, 2335–2351, 2004. Winslow, M. D., Vogt, J. V., Thomas, R. J., Sommer, S., Martius, C.,
and Akhtar-Schuster, M.: Science for improving the monitoring and assessment of dryland degradation, Land Degrad. Dev., 22, 145–149, 2011.
Wu, H., Hayes, M. J., Wilhite, D. A., and Svoboda, M. D.: The effect of the length of record on the standardized precipitation index calculation, Int. J. Climatol., 25, 505–520, 2005.