and Oxidative Stress: Correlation and Bladder Cancer
Diagnostic Potential
Maturada Patchsung1., Chanchai Boonla1., Passakorn Amnattrakul2, Thasinas Dissayabutra1,
Apiwat Mutirangura3, Piyaratana Tosukhowong1*
1Department of Biochemistry, Faculty of Medicine, Chulalongkorn University, Bangkok, Thailand,2Department of Surgery, Faculty of Medicine, Chulalongkorn University, Bangkok, Thailand,3Department of Anatomy, Faculty of Medicine, Chulalongkorn University, Bangkok, Thailand
Abstract
Although, increased oxidative stress and hypomethylation of long interspersed nuclear element-1 (LINE-1) associate with bladder cancer (BCa) development, the relationship between these alterations is unknown. We evaluated the oxidative stress and hypomethylation of the LINE-1 in 61 BCa patients and 45 normal individuals. To measure the methylation levels and to differentiate the LINE-1 loci into hypermethylated, partially methylated and hypomethylated, peripheral blood cells, urinary exfoliated cells and cancerous tissues were evaluated by combined bisulfite restriction analysis PCR. The urinary total antioxidant status (TAS) and plasma protein carbonyl content were determined. The LINE-1 methylation levels and patterns, especially hypomethylated loci, in the blood and urine cells of the BCa patients were different from the levels and patterns in the healthy controls. The urinary TAS was decreased, whereas the plasma protein carbonyl content was increased in the BCa patients relative to the controls. A positive correlation between the methylation of LINE-1 in the blood-derived DNA and urinary TAS was found in both the BCa and control groups. The urinary hypomethylated LINE-1 loci and the plasma protein carbonyl content provided the best diagnostic potential for BCa prediction. Based on post-diagnostic samples, the combination test improved the diagnostic power to a sensitivity of 96% and a specificity of 96%. In conclusion, decreased LINE-1 methylation is associated with increased oxidative stress both in healthy and BCa subjects across the various tissue types, implying a dose-response association. Increases in the LINE-1 hypomethylation levels and the number of hypomethylated loci in both the blood- and urine-derived cells and increase in the oxidative stress were found in the BCa patients. The combination test of the urinary hypomethylated LINE-1 loci and the plasma protein carbonyl content may be useful for BCa screening and monitoring of treatment.
Citation:Patchsung M, Boonla C, Amnattrakul P, Dissayabutra T, Mutirangura A, et al. (2012) Long Interspersed Nuclear Element-1 Hypomethylation and Oxidative Stress: Correlation and Bladder Cancer Diagnostic Potential. PLoS ONE 7(5): e37009. doi:10.1371/journal.pone.0037009
Editor:Kin Mang Lau, The Chinese University of Hong Kong, Hong Kong
ReceivedDecember 13, 2011;AcceptedApril 11, 2012;PublishedMay 15, 2012
Copyright:ß2012 Patchsung et al. This is an open-access article distributed under the terms of the Creative Commons Attribution License, which permits unrestricted use, distribution, and reproduction in any medium, provided the original author and source are credited.
Funding:This work was supported by Ratchadapisake Sompote Fund, Chulalongkorn University (to PT), by the Biochemistry and Molecular Biology of Metabolic Diseases Research Unit and by the Higher Education Research Promotion and National Research University Project of Thailand, Office of the Higher Education Commission and the Ratchadaphiseksomphot Endowment Fund (HR 1162A). AM is supported by Research Chair Grant 2011, National Science and Technology Development Agency (NSTDA), Thailand, and the Four Seasons Hotel Bangkok’s 4th Cancer Care charity fun run in coordination with the Thai Red Cross Society and Center of Excellence in Molecular Genetics of Cancer and Human Diseases, Chulalongkorn University. The funders had no role in study design, data collection and analysis, decision to publish, or preparation of the manuscript.
Competing Interests:The authors have declared that no competing interests exist.
* E-mail: [email protected]
.These authors contributed equally to this work.
Introduction
Carcinogenesis of the urinary bladder is complex because both genetic mutations and epigenetic alterations play important roles. Furthermore, inflammation and oxidative stress critically contrib-ute to development of bladder cancer (BCa) [1–3]. Various lines of evidence report an increased oxidative stress in patients with BCa [3–6]. Oxidative stress is a condition of the excessive production of reactive oxygen species (ROS) and/or a reduction of antioxidants. ROS directly damages the cellular DNA and promotes tumor development not only through genetic mutations but also through epigenetic alterations [7]. Common epigenetic alterations in human cancers include global hypomethylation and regional (site-specific CpG island promoter) hypermethylation of the tumor suppressor genes [8,9]. Hypomethylation of the cancer genome
occurs on the repetitive sequences and retrotransposable elements [10], which accelerates the genomic instability [10–13] and alters gene expression [14]. The best characterized and most abundant retrotransposon in the mammalian genome is the long interspersed nuclear element-1 (LINE-1 or L1), and it is known that LINE-1 hypomethylation is associated with many malignancies [15,16].
cancer [15]. Choi et al. used bisulfite-PCR pyrosequencing and showed an obvious hypomethylation of LINE-1 in bladder tumor tissues relative to the adjacent normal tissues [19]. The reduction of 5-methylcytosine levels in leukocyte DNA was shown in Spanish patients with bladder cancer relative to the matched controls [20]. Recently, the hypomethylation of LINE-1 in peripheral blood cells was associated with an increased risk for bladder cancer, especially in women [21]. Among nonsmoking Chinese, similar result that LINE-1 hypomethylation in lymphocytes was associated with increased risk for bladder cancer was demonstrated [22]. Pre-viously, the methylation of LINE-1 in urinary exfoliated cells and its implication in bladder cancer has not been investigated. Even though LINE-1 hypomethylation and increased oxidative stress are well recognized in BCa patients, the association between these two phenomena has not been explored.
To date, the most commonly used techniques for measuring LINE-1 methylation level are pyrosequencing and COBRA PCR. These two methods had have similar efficacy in the detection of methylation levels and have limited margins of error [23]. The pyrosequencing of LINE-1 detects a few more CpG dinucleotides, usually three CpGs, [24] than the COBRA PCR detects (usually two CpGs). However, the LINE-1 methylation of each locus is not homogenous [23,25], which can influence expression and stability of the genome in cis [16]. Consequently, the LINE-1 methylation levels do not precisely represent the biological roles of the epigenomic modification [16]. To improve LINE-1 methylation evaluation, in addition to overall methylation level, we used COBRA PCR of LINE-1 to classify the genome-wide LINE-1 loci into four groups, mCmC (hypermethylated), uCuC (hypomethy-lated), mCuC and uCmC (partial methylated), and calculate the percentages of each group (Fig. 1) [26]. Of note, certain LINE-1 methylation assays have a positive methylation control base which can be use to determine the efficacy of the bisulfite treatment.
To evaluate the association between oxidative stress and LINE-1 hypomethylation, we determined the methylation levels of LINE-1 in the blood and urine cells obtained from the BCa patients and from the healthy individuals. Oxidative stress, indicated by the urinary total antioxidant status (TAS) and plasma protein carbonyl content, was compared between the two groups. The association of the LINE-1 methylation levels with the oxidative stress status was evaluated, and the usefulness of LINE-1 hypomethylation detection in the urinary exfoliated cells and the overall oxidative stress as markers for BCa diagnosis was assessed.
Materials and Methods
Participants
Sixty-one patients with BCa that were admitted to the King Chulalongkorn Memorial Hospital, Bangkok, Thailand between 2009 and 2010 were recruited for the study. All of the patients had histological proof of a superficial transitional cell carcinoma. Any BCa patients that presented with a muscle invasive phenotype were excluded from this study. Age- and gender-matched healthy individuals (n = 45) were used as controls. The controls were selected from members of the healthy elderly community at Lumpini Park, Bangkok, where they came everyday to do exercise. The healthy condition was confirmed by direct interview and their annual medical check-up to ensure that there was no history of urinary disorders and any malignancies. All subjects voluntarily participated in the study. The study protocol was reviewed and approved by the Ethics Committee of the Faculty of Medicine, Chulalongkorn University, Bangkok, Thailand. Written informed consents were obtained from all participants.
Specimen collection and DNA extraction
Heparinized blood and midstream spot morning urine (between 8:00 am and 12:00 pm) were collected from all participants. The blood samples were centrifuged to collect the plasma and buffy coat. The plasma samples were kept at280uC until testing. The buffy coat samples were immediately subjected to DNA extraction. To isolate the urinary exfoliated cells, 50 ml of the urine samples was centrifuged at 4,000 rpm for 20 min at 4uC. The cell pellet was collected and stored in RNA stabilizer (QIAGEN, Germany) at280uC until analysis. Of the 61 BCa patients, 14 had available cancerous tissues, which were obtained during the operation of transurethral resection, immediately stored in RNA stabilizer and kept at280uC for the LINE-1 measurement. Due to low amount of nucleated cells in urines, especially in healthy urines, DNAs from urinary exfoliated cells were successfully extracted from 30 BCa patients and 14 healthy controls. The DNA was extracted from peripheral blood buffy coats, urinary exfoliated cells and cancerous tissues using the High Pure PCR Template Preparation Kit (Roche Diagnostics, Indianapolis, USA). The incomplete specimen collection was considered as a weakness of the study. In BCA group, the blood, urinary exfoliated cells and cancerous tissues were accounted for 61 (100%), 30 (49.18%) and 14 (22.95%), respectively. Fourteen BCa patients (22.95%) had all types of specimens for analysis. In healthy control group, 45 (100%) blood and 14 (31.11%) urinary exfoliated cells samples were analyzed. Fourteen control subjects (31.11%) had both specimens for analysis. The power to detect the correlation observed for an n = 14 was calculated using the G*Power 3.1.3 software [27], and the output displayed the power of 0.66 (inputs: two-tails, effect size = 0.56,a= 0.05, total sample size = 14).
LINE-1 methylation by COBRA PCR
In brief, genomic DNAs (250 ng) derived from blood, urine and cancerous tissue samples were treated with sodium bisulfite as previously described [15]. The bisulfite-treated DNA was sub-jected to 35 cycles of PCR with LINE-1-F (59-CCGT AAG
GGGTTAGGGAGTTTTT-39) and LINE-1-R (59
-RTAAAACCCTCCRAACCAAAT ATAAA-39) primers with an annealing temperature of 50uC to generate 160 bp PCR amplicons. The amplicons were further digested withTaqI (2 U) (sticky end) and TasI (2 U) (sticky end) in NEB3 buffer (MBI Fermentas, Glen Burnie, MD) at 65uC overnight. The digested products were then electrophoresed in an 8% nondenaturing polyacrylamide gel and subsequently stained with SYBR green. The experiment was performed in duplicate.
(hypomethylated loci) was calculated from the followed equation: B/(((C2D+B)/2)+A+D)6100. ThemCuC (partial methylated loci) was computed from the equation: A/(((C2D+B)/2)+A+D)6100. The mCmC (hypermethylated loci) was computed from the equation: ((C2D+B)/2)/(((C2D+B)/2)+D+A)6100. The CV of the LINE-1 methylation levels in blood, urinary exfoliated cells and cancerous tissues DNAs were 7.31% (range: 2.33–12.91%), 7.64% (range: 2.50–13.17%) and 8.00% (range: 3.56–10.54%), respectively. DNA from HeLa cells was used as a control to normalize the inter-assay methylation variation for all of the experiments (Fig. 1F). The percent of LINE-1 methylation detected in HeLa DNAs was 28.59%, and this value was used for normalization between the runs. The mean of LINE-1 methylation in HeLa DNAs was 27.7462.33%, and the between-run CV was 8.41%.
Total antioxidant status (TAS)
The 2, 2-diphenyl-1-picryl-hydrazyl (DPPH) reduction assay was performed to determine the TAS in urine samples. Briefly, a urine sample (20mL) was added to of 400mL of 10 mM phosphate buffered saline (PBS, pH 7.4) and 400mL of freshly prepared 0.1 mM DPPH in methanol. The reaction tubes were incubated at room temperature for 20 min in the dark. The optical density (OD) at 520 nm was measured. The antioxidant capacity of the sample was calculated based on the % inhibition of DPPH radicals using the following equation: % inhibition =
(OD-blank2ODsample/ODblank)6100. L-ascorbic acid (vitamin C) was used at concentrations of 0.25, 0.5 and 1 mM to generate a standard curve (% inhibition vs. concentration). The TAS value of the urine sample was expressed as the vitamin C equivalent antioxidant capacity (VCEAC mM). All experiments were done in
Figure 1. The methylation patterns of LINE-1 detected by COBRA PCR.A: The detecting 59UTR of the LINE-1 sequence contains two CpG dinucleotide loci, and the PCR amplicon size of LINE-1 is 160 bp. B: There are 4 possible methylation patterns of the LINE-1 sequence (one cell contains two alleles). The solid stars represent methylated cytosines and the hollow stars represent unmethylated cytosines. C: COBRA LINE-1 separated the detecting region into four products:mCmC,uCuC,mCuC anduCmC. D: After the bisulfite treatment, the unmethylatated cytosine residues are converted to uracil, but the methylated cytosine residues are unaltered. This leads to retention or loss of CpG containing restriction enzyme sites, respectively. E: The PCR products are digested with TaqI (recognition sequence: TCGA) and TasI (recognition sequence: AATT) restriction enzymes. A TaqI positive digest yields two 80-bp DNA fragments, while a TasI positive digest yields a 62- and a 98-bp fragment. F: Representative gel image for COBRA LINE-1 assay. Lanes 1–2: DNAs from BCa patients, Lanes 3–5: DNAs from healthy controls, Lane 6: DNA from HeLa cells as positive control and normalizing sample, Lane 7: negative (N) control, Lane 8: 25 bp markers.
duplicate. The CV for urinary TAS determination was 7.81% (range: 1.02–14.59%).
Protein carbonyl determination
The protein carbonyl content was used as an indicator of protein oxidation by ROS in plasma. A plasma sample was diluted (1:20) with PBS (10 mM, pH 7.4) and then centrifuged at 10,000 rpm for 10 min. The plasma supernatant (250mL) was added to 1 mL of 10 mM 2,4-dinitrophenylhydrazine (DNPH) in 2N HCl. For a reagent blank control, 1 mL of 2N HCl was added to 250mL of the plasma supernatant. The mixtures were incubated at room temperature in the dark for 45 min and were vortexed at 10-min intervals. Then, 1.2 mL of 20% cold trichloroacetic acid was added and incubated for 10 min on ice; this was followed by centrifugation at 3,000 rpm for 15 min to collect the protein pellets. The pellets were washed three times with 2.5 mL of ethanol/ethyl acetate (1:1, v/v) each to remove non-reacted DNPH. The washed pellets containing 2,4-dinitro-phenylhydrazone were resuspended in 6 M guanidine hydrochlo-ride/0.5 M potassium phosphate monobasic, pH 2.5, at 37uC for 15 min with vortexing. The absorbance at 375 nm was measured using the corresponding reagent blank for a zero setting. The extinction coefficient for the 2,4-dinitrophenylhydrazone at 375 nm is 22,000 M21cm21 and the protein carbonyl concen-tration (nMol/mL) was calculated as the absorbance x 45.45 [29]. The content of protein carbonyl in the plasma was expressed per mg of total proteins (measured by the dye-binding method). The CV for determination of plasma protein carbonyl content was 8.43% (range: 2.72–13.80%).
Statistical analysis
The data with normal distribution were presented as the mean 6standard deviation, and the data with skewed distribution were presented as median (interquartile range, IQR). For comparisons between two independent groups, the independent sample t-test was used for normally distributed data, and the Mann-Whitney test was used for skewed data. Pearson’s correlation test was used to assess the correlation between continuous variables. A receiver operating characteristic (ROC) analysis was performed to test the ability of the COBRA LINE-1 methylation test to differentiate BCa subjects from healthy subjects. An area under the ROC curve (AUC) of 1.0 indicates perfect accuracy, whereas an AUC of 0.5 indicates that the test lacks discriminatory power. A cutoff value was selected for computing the diagnostic values. SPSS version 17.0 (SSPS Inc., Chicago, IL) and STATA version 8.0 (StataCorp, College Station, Texas) were used for all calculations. A P value,0.05 was considered statistically significant.
Results
The BCa patients (n = 61) were between 42 and 89 years of age (65.11612.16 years) and consisted of 52 (85.25%) males and 9 (14.75%) females. In the control group, there were 45 healthy subjects between 46 and 81 years of age (61.00613.25 years); this group had 37 (82.22%) males and 8 (17.78%) females. Mean body mass index (BMI) of the patient and control groups were 22.2463.71 and 23.1562.45 (kg/m2), respectively. The sex distribution, age and BMI between the two groups were not significantly different.
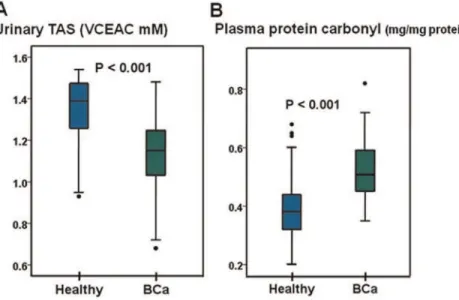
The methylation level of LINE-1 was measured in DNA derived from peripheral blood, urinary exfoliated cells and cancerous tissues. The percentage of LINE-1 methylation in the peripheral blood cells from the BCa patients was significantly lower than that of the healthy controls (P = 0.001) (Fig. 2A). Likewise, the LINE-1
methylation levels in the urinary exfoliated cells from the BCa patients were significantly lower than those of the healthy controls (P = 0.044) (Fig. 2B). The LINE-1 methylation levels in the BCa cancerous tissues were significantly lower than those in the urinary exfoliated cells of the BCa (P = 0.038) and healthy (P = 0.001) subjects (Fig. 2B). The percentage ofuCuC loci in the peripheral blood cells and urinary exfoliated cells of the BCa patients was significantly greater than the controls (P = 0.013 and ,0.001, respectively) (Fig. 2C and 2D). The number ofmCuC loci from the urinary exfoliated cells of the BCa patients was significantly lower than that of the controls (P = 0.006), but the levels ofmCuC loci in the peripheral blood cells from the BCa and healthy groups were not different (P = 0.133) (Figure S1). These data confirmed the presence of LINE-1 hypomethylation in bladder cancer and showed similar results to those previously reported for oral cancer [26] that demonstrated the specificity ofuCuC loci to cancer DNA. The determinations of the urinary TAS and plasma protein carbonyl content were performed in both healthy and BCa groups. A significant reduction in the urinary TAS level in the BCA patients relative to the healthy controls was observed (P,0.001) (Fig. 3A). The plasma protein carbonyl content in the BCa patients was significantly higher than that in healthy controls (P,0.001) (Fig. 3B). Our findings indicated an increase in the oxidative stress in the BCa patients.
In the BCa patients, we found a strong, positive and linear correlation between the urinary TAS and LINE-1 methylation in circulating blood cells (regression coefficient = 8.017) (r = 0.618, P,0.001) (Fig. 4A). Moreover, a significant positive correlation between the urinary TAS and cancerous tissue LINE-1 methyl-ation levels was observed (regression coefficient = 5.519) (r = 0.567, P = 0.034) (Fig. 4B). Interestingly, we also found a positive correlation between the urinary TAS and the level of LINE-1 methylation in the peripheral blood cells of the healthy individuals (regression coefficient = 8.937) (r = 0.469, P = 0.001) (Fig. 4C). The correlations between urinary TAS and the other patterns of LINE-1 methylation (mCmC, uCuC, uCmC and mCuC) were evaluated (Figure S2). The significant inverse correlations between urinary TAS and the uCuC levels in BCa peripheral blood cells (r =20.440, P = 0.001), BCa cancerous tissues (r =20.440, P = 0.001) and peripheral blood cells of healthy controls (r =20.315, P = 0.035) were observed.
Using one-way ANOVA test, significant differences of LINE-1 methylation levels in blood, urine and cancerous tissue DNAs were not observed among BCa patients with different smoking status (non-smokers, current smokers and quitted smokers) (P = 0.477, 0.711 and 0.964, respectively). Likewise, levels of urinary TAS and plasma protein carbonyl content among the different smoking status were not significantly different (P = 0.053 and 0.093, respectively). Urinary TAS (P = 0.055 for healthy, P = 0.879 for BCa) and plasma protein carbonyl content (P = 0.634 for healthy, P = 0.072 for BCa) were not significantly different between males and females both in healthy and BCa groups. However, positive correlation between urinary TAS and age in healthy group (r = 0.374, P = 0.011) and negative correlation between plasma protein carbonyl content and BMI in BCa group (r =20.261, P = 0.044) were revealed.
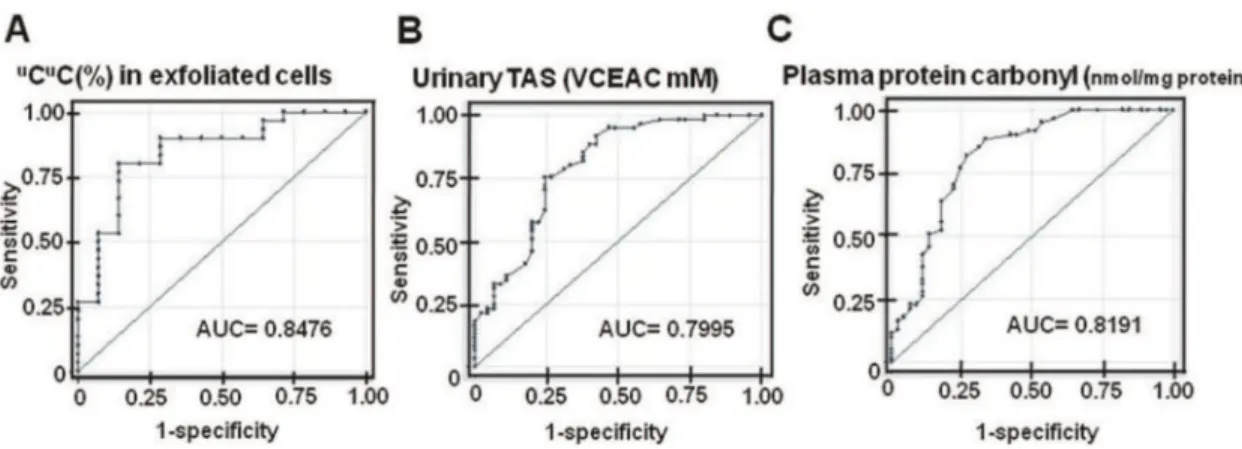
81.82%, respectively. The AUC values of the % methylation in both the blood (0.684) and the urine (0.691) cells were lower than that of urinaryuCuC (Figure S3). Thus, the determination ofuCuC in the urinary exfoliated cells provided the highest diagnostic potential relative to the other forms of methylation.
The ROC curves of the urinary TAS and plasma protein carbonyl content were also generated. The urinary TAS had an AUC of 0.800 (95% CI: 0.711–0.888) and had sensitivity,
specificity and accuracy of 88.52%, 60.00%, and 76.42%, respectively, at a cutoff of 1.32 VCEAC mM (Table 1 and Fig. 5B). An AUC value for the plasma protein carbonyl content was 0.819 (95% CI: 0.733–0.905), and its sensitivity, specificity and accuracy, at a cutoff of 0.44 nMol/mg of protein, were 81.97%, 73.33% and 78.30%, respectively (Table 1 and Fig. 5C). We further evaluated whether the combination ofuCuC in the urinary exfoliated cells and the plasma protein carbonyl content
Figure 2. The LINE-1 methylation and uCuC levels compared between the BCa and healthy groups. A: The percentage of LINE-1 methylation levels in the peripheral blood DNA from BCa patients (n = 61) was significantly lower than that from the healthy controls (n = 45). B: The LINE-1 methylation levels in the DNA derived from the urinary exfoliated cells from BCa patients (n = 30) were significantly decreased relative to those from the healthy controls (n = 14). The LINE-1 methylation levels in the cancerous tissues (n = 14) were significantly lower than the LINE-1 methylation levels in the urinary exfoliated cells from both BCa and healthy subjects. C: TheuCuC levels in the peripheral blood DNA from BCa patients were significantly higher than those from the healthy controls. D: TheuCuC levels in the urinary exfoliated cells of BCa patients were significantly increased compared to those from the healthy controls. The cancerous tissueuCuC levels were not significantly different from theuCuC levels from the BCa urinary exfoliated cells (P = 0.721), but they were significantly higher than those from the urinary exfoliated cells of healthy controls.
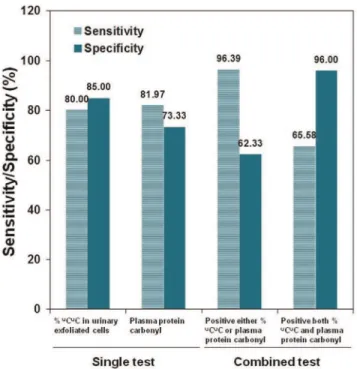
would improve the diagnostic potential for BCa. The test criteria revealed that two positive results showed a higher specificity (96.00% with sensitivity of 65.58%) and a higher sensitivity (96.39% with specificity of 62.33%) when at least one marker was positive (Fig. 6).
Discussion
The loss of DNA methylation in the LINE-1 elements is suggested to be a cardinal event in cancer development because it promotes genomic instability and alters gene expression [12–16]. The mechanism that causes this loss of DNA methylation is unknown. The evaluation of the correlation of LINE-1 methyl-ation levels between several loci suggested that the LINE-1
hypomethylation mechanism is generalized [23]. The timing of DNA methylation and bladder cancer is not yet clear. Rather, it has been shown to be a biomarker in post-diagnostic sample analyses, however, this relationship has not been shown in using pre-diagnostic samples, and it is not yet clear whether the lower methylation observed was caused by the carcinogenic process itself [30]. In the present study, we demonstrated here for the first time a significant positive correlation between LINE-1 hypomethylation and oxidative stress not only in cancer patients but also in healthy individuals. Therefore, oxidative stress may be one of the causes or consequences of LINE-1 hypomethylation.
Currently, to our knowledge, there is no biochemical mecha-nism that implies how LINE-1 hypomethylation can produce ROS. However, the mechanism of how oxidative stress reduces
Figure 3. The oxidative stress biomarkers in patients with BCa.A: The level of urinary TAS in the BCa patients was significantly lower than that in the healthy controls. B: The level of the plasma protein carbonyl content in the BCa patients was significantly greater than that from the healthy controls.
doi:10.1371/journal.pone.0037009.g003
Figure 4. A univariate correlation analysis between the levels of urinary TAS and LINE-1 methylation.A: The urinary TAS was linearly correlated with the 1 methylation levels in the peripheral blood cells of the BCa patients. B: The urinary TAS was linearly correlated with the LINE-1 methylation levels in the cancerous tissue obtained from the BCa patients. C: In the healthy group, the urinary TAS was also linearly correlated with the LINE-1 methylation levels in the peripheral blood cells. b: regression coefficient, r: Pearson’s correlation coefficient. The displayed P values are from the Pearson’s correlation test.
doi:10.1371/journal.pone.0037009.g004
DNA methylation has been proposed [31], and the oxidative stress-induced DNA methylation change appears to be temporal [32,33]. Oxidized DNA lesions that are induced by ROS, such as 8-OHdG (in CpG dinucleotides), can strongly inhibit the methylation by a DNA methyltransferase at the adjacent C residues [34]. Additionally, an unfixed 8-OHdG may introduce a G-T transversion resulting in the loss of CpG dinucleotides [35]. Additionally, in an oxidative stress condition, the resynthesis of glutathione (GSH) in response to GSH depletion through the methionine cycle in one-carbon metabolism pathway is increased. This pathway requires S-adenosylmethionine (SAM) for synthe-sizing the homocysteine to be used for the GSH synthesis, leading to a decreased availability of SAM for DNA methylation [36]. The agents and conditions that induce GSH depletion have been demonstrated to impair DNA methylation [37,38]. Therefore, oxidative stress is thought to alter the methylation of DNA, which leads to changes in the gene expression that could contribute to tumor development [7]. In addition to decreased availability of SAM, depletion of methyl pool in folate-deficient models has been shown to cause DNA hypomethylation [39,40].
The LINE-1 methylation levels have been studied in several sources of DNA to improve cancer diagnosis. Unfortunately, there are tissue specific methylation levels and that these differ depending upon the methylation biomarker used to measure methylation [15]. In clinical specimens both cancerous and normal cells are usually coexisted, which means that based only on the LINE-1 methylation levels cancer DNA cannot be
effectively detected when the DNA sources are contaminated with DNA from various types of normal cells. For detection of noninvasive BCa by DNA examination, blood and urine are the common sources of DNA. Although cancer cells are present in both sources, the contamination with various types of normal cells is usually inevitable. Previously, we tested the DNA from both an oral rinse and from the white blood cells of patients with oral cancer and found that the percentage of hypomethylated loci or u
CuC was more specific to the cancer DNA than the overall LINE-1 methylation levels [26,4LINE-1]. Moreover, the LINE-LINE-1 methylation levels between the cell types (oral epithelial and blood cells) were different because of the number of partial LINE-1 methylation loci. Here, we showed similar data in BCa; the number of LINE-1 hypomethylated loci in urinary exfoliated cells is a better tumor marker than the overall LINE-1 methylation level.
The increase in oxidative stress in BCa is well recognized and is believed to be critically involved in urothelial carcinogenesis [3–6]. The study results support this association; there still need to be experiments or analyses conducted using pre-diagnostic samples to confirm the temporality of the association observed here. The plasma protein carbonyl content was increased in the patients with BCa relative to the levels in the healthy controls [42]. The total antioxidant activity measured in the plasma of urothelial bladder carcinoma patients was lower than that in healthy controls [43]. In this study, we used the urinary TAS to reflect the overall antioxidant capacity in the body because the urinary TAS is a well-accepted marker for estimating the total antioxidants in biological
Figure 5. The ROC curves ofuCuC determination, the urinary TAS and the plasma protein carbonyl content.A: The %uCuC in the urinary exfoliated cells. B: The urinary TAS. C: The plasma protein carbonyl content. The determination ofuCuC in the urinary exfoliated cells had the highest AUC, which suggests the highest diagnostic potential.
doi:10.1371/journal.pone.0037009.g005
Table 1.The ROC analysis and diagnostic values of the measurements of the LINE-1 methylation anduCuC levels as well as oxidative stress biomarkers.
Samples Measurements AUC Cutoff Sensitivity (%) Specificity (%) Accuracy (%)
Peripheral blood cells Methylation (%) 0.684 42.87 96.67 40.00 72.38
uCuC (%) 0.641 34.64 50.00 77.78 61.90
Urinary exfoliated cells Methylation (%) 0.691 42.15 100.00 21.43 75.00
uCuC (%) 0.848 38.43 80.00 85.00 81.82
Urine TAS (VCEAC mM) 0.800 1.32 88.52 60.00 76.42
Plasma Protein carbonyl 0.820 0.44 81.97 73.33 78.30
(nMol/mg proteins)
fluids [44]. Based on our findings, we conclude that the patients with BCa had an increase in oxidative stress. When combined with the LINE-1 hypomethylation levels, we hypothesize that the deprivation of antioxidants or an increase in oxidative stress may influence the global hypomethylation that promotes carcinogen-esis.
The ROC analysis revealed the promising diagnostic potential of the measurements for the plasma protein carbonyl content and the LINE-1 hypomethylated loci in urinary exfoliated cells. The combination of these two tests increased the sensitivity and specificity of the diagnostic values to 96%. This association needs to be evaluated in pre-diagnostic samples. To date, there is no biomarker that can replace the need for cystoscopy, and the discovery of a new BCa biomarker is still a challenge for the field [45]. Although many urinary biomarkers have been reported to detect BCa with high sensitivity, their specificity is much lower than the urine cytology (95–100%) [45,46]. A meta-analysis reported that the sensitivity of urine cytology is only 34% [47]. Thus, a novel, noninvasive test with a high sensitivity and specificity that is comparable to that of urine cytology is required. Relative to the previously reported biomarkers for detecting BCa [45–48], the current combination tests have shown to have a diagnostic potential in the pre-diagnostic samples.
In conclusion, we found a positive correlation between the LINE-1 hypomethylation of urine exfoliative cells and the oxidative stress in both normal individuals and BCa patients.
ROS is hypothesized to be one of the candidate mechanisms that can reduce LINE-1 methylation. Moreover, the ROS generation and LINE-1 methylation levels and patterns in the blood, urinary exfoliated cells and cancer cells from patients were significantly changed relative to healthy controls. The combined information from these two tests demonstrated a very high sensitivity and specificity for BCa diagnosis, however, it needs to be confirmed using pre-diagnostic samples, prior to implementation in cancer diagnosis. Further studies of global hypomethylation and ROS will not only improve our knowledge of carcinogenic mechanisms but will also improve our management of the disease.
Statement of translational relevance
Patients with bladder cancer have increased oxidative stress and LINE-1 hypomethylation relative to healthy controls. LINE-1 hypomethylation is correlated with an increased ROS generation in both normal and cancer subjects, indicating a reverse associ-ation between LINE1 methylassoci-ation and oxidative stress. LINE-1 hypomethylation is known to promote genome instability, alter gene expression and contribute to tumor progression. Thus, the treatment that effectively reduces the oxidative stress in the patients may attenuate the LINE-1 hypomethylation and de-celerate the progression of the tumor. Until now, there has been no noninvasive biomarker for detecting a bladder tumor that can replace the need for cystoscopy. Based on pre-diagnostic samples, the determination of the hypomethylated loci of LINE-1 in urinary exfoliated cells combined with the plasma protein carbonyl content show high sensitivity and specificity for bladder cancer prediction. This combination test may be clinically useful for bladder cancer diagnosis and monitoring of treatment thus reducing the frequency of invasive cystoscopic procedures. However, the test should be performed in pre-diagnostic samples before the actual diagnostic power of the test can be evaluated.
Supporting Information
Figure S1 Comparison of partial methylation loci of LINE-1 in blood and urinary exfoliated cells as well as cancerous tissues of bladder cancer patients and healthy controls.
(DOC)
Figure S2 Correlations between urinary TAS and LINE-1 methylation patterns (mCmC,uCuC,uCmC andmCuC) in peripheral blood cells (A–D and I–L) and cancerous tissues (E–H) of the patients with BCa (A–H) and healthy controls (I–L).
(DOC)
Figure S3 ROC curves of various forms of LINE-1 methylation in blood and urine cells.
(DOC)
Author Contributions
Conceived and designed the experiments: PT CB AM. Performed the experiments: MP CB TD. Analyzed the data: CB MP. Contributed reagents/materials/analysis tools: PT AM CB. Wrote the paper: CB MP AM. Patient recruitment and specimen collection: PA PT MP. Read revised manuscript for typing errors: TD PT AM CB. Read revised manuscript and comments: AM CB PT TD.
References
1. Kawai K, Yamamoto M, Kameyama S, Kawamata H, Rademaker A, et al. (1993) Enhancement of rat urinary bladder tumorigenesis by lipopolysaccharide-induced inflammation. Cancer Res 53: 5172–5175.
2. Michaud DS (2007) Chronic inflammation and bladder cancer. Urol Oncol 25: 260–268.
Figure 6. The sensitivity and specificity of the combined test of %uCuC in the urinary exfoliated cells and the plasma protein carbonyl content. An increased sensitivity (96.39%) was achieved when either the %uCuC in urinary exfoliated cells or the plasma protein carbonyl content was positive. Additionally, an increased specificity (96.00%) of the test was achieved when at least one of both markers was positive.
doi:10.1371/journal.pone.0037009.g006
3. Opanuraks J, Boonla C, Saelim C, Kittikowit W, Sumpatanukul P, et al. (2010) Elevated urinary total sialic acid and increased oxidative stress in patients with bladder cancer. Asian Biomedicine 4: 703–710.
4. Akcay T, Saygili I, Andican G, Yalcin V (2003) Increased formation of 8-hydroxy-29-deoxyguanosine in peripheral blood leukocytes in bladder cancer. Urol Int 71: 271–274.
5. Salim EI, Morimura K, Menesi A, El-Lity M, Fukushima S, et al. (2008) Elevated oxidative stress and DNA damage and repair levels in urinary bladder carcinomas associated with schistosomiasis. Int J Cancer 123: 601–608. 6. Soini Y, Haapasaari KM, Vaarala MH, Turpeenniemi-Hujanen T, Karja V, et
al. (2011) 8-hydroxydeguanosine and nitrotyrosine are prognostic factors in urinary bladder carcinoma. Int J Clin Exp Pathol 4: 267–275.
7. Wachsman JT (1997) DNA methylation and the association between genetic and epigenetic changes: relation to carcinogenesis. Mutat Res 375: 1–8. 8. Esteller M (2008) Epigenetics in cancer. N Engl J Med 358: 1148–1159. 9. Rodriguez-Paredes M, Esteller M (2011) Cancer epigenetics reaches mainstream
oncology. Nat Med 17: 330–339.
10. Wilson AS, Power BE, Molloy PL (2007) DNA hypomethylation and human diseases. Biochim Biophys Acta 1775: 138–162.
11. Hatziapostolou M, Iliopoulos D (2011) Epigenetic aberrations during oncogen-esis. Cell Mol Life Sci 68: 1681–1702.
12. Pornthanakasem W, Kongruttanachok N, Phuangphairoj C, Suyarnsestakorn C, Sanghangthum T, et al. (2008) LINE-1 methylation status of endogenous DNA double-strand breaks. Nucleic acids research 36: 3667–3675.
13. Kongruttanachok N, Phuangphairoj C, Thongnak A, Ponyeam W, Rattanatanyong P, et al. (2010) Replication independent DNA double-strand break retention may prevent genomic instability. Molecular cancer 9: 70. 14. Aporntewan C, Phokaew C, Piriyapongsa J, Ngamphiw C, Ittiwut C, et al.
(2011) Hypomethylation of intragenic LINE-1 represses transcription in cancer cells through AGO2. PloS one 6: e17934.
15. Chalitchagorn K, Shuangshoti S, Hourpai N, Kongruttanachok N, Tangkijvanich P, et al. (2004) Distinctive pattern of LINE-1 methylation level in normal tissues and the association with carcinogenesis. Oncogene 23: 8841–8846.
16. Kitkumthorn N, Mutirangura A (2011) Long interspersed nuclear element-1 hypomethylation in cancer: biology and clinical applications. Clin Epigenet doi:10.1007/s13148-13011-10032-13148.
17. Florl AR, Lower R, Schmitz-Drager BJ, Schulz WA (1999) DNA methylation and expression of LINE-1 and HERV-K provirus sequences in urothelial and renal cell carcinomas. Br J Cancer 80: 1312–1321.
18. Jurgens B, Schmitz-Drager BJ, Schulz WA (1996) Hypomethylation of L1 LINE sequences prevailing in human urothelial carcinoma. Cancer Res 56: 5698–5703.
19. Choi SH, Worswick S, Byun HM, Shear T, Soussa JC, et al. (2009) Changes in DNA methylation of tandem DNA repeats are different from interspersed repeats in cancer. Int J Cancer 125: 723–729.
20. Moore LE, Pfeiffer RM, Poscablo C, Real FX, Kogevinas M, et al. (2008) Genomic DNA hypomethylation as a biomarker for bladder cancer suscepti-bility in the Spanish Bladder Cancer Study: a case-control study. Lancet Oncol 9: 359–366.
21. Wilhelm CS, Kelsey KT, Butler R, Plaza S, Gagne L, et al. (2010) Implications of LINE1 methylation for bladder cancer risk in women. Clin Cancer Res 16: 1682–1689.
22. Cash HL, Tao L, Yuan JM, Marsit CJ, Houseman EA, et al. (2012) LINE-1 hypomethylation is associated with bladder cancer risk among nonsmoking Chinese. Int J Cancer 130: 1151–1159.
23. Phokaew C, Kowudtitham S, Subbalekha K, Shuangshoti S, Mutirangura A (2008) LINE-1 methylation patterns of different loci in normal and cancerous cells. Nucleic acids research 36: 5704–5712.
24. Baba Y, Huttenhower C, Nosho K, Tanaka N, Shima K, et al. (2010) Epigenomic diversity of colorectal cancer indicated by LINE-1 methylation in a database of 869 tumors. Molecular cancer 9: 125.
25. Singer H, Walier M, Nusgen N, Meesters C, Schreiner F, et al. (2012) Methylation of L1Hs promoters is lower on the inactive X, has a tendency of
being higher on autosomes in smaller genomes and shows inter-individual variability at some loci. Human molecular genetics 21: 219–235.
26. Pobsook T, Subbalekha K, Sannikorn P, Mutirangura A (2011) Improved measurement of LINE-1 sequence methylation for cancer detection. Clin Chim Acta 412: 314–321.
27. Faul F, Erdfelder E, Buchner A, Lang AG (2009) Statistical power analyses using G*Power 3.1: tests for correlation and regression analyses. Behavior research methods 41: 1149–1160.
28. Kitkumthorn N, Tuangsintanakul T, Rattanatanyong P, Tiwawech D, Mutirangura A LINE-1 methylation in the peripheral blood mononuclear cells of cancer patients. Clin Chim Acta. 2012 Feb 1. http://dx.doi.org/10.1016/j. cca.2012.01.024.
29. Castegna A, Drake J, Pocernich C, Butterfield DA (2003) Protein Carbonyl Levels—An Assessment of Protein Oxidation. Methods in Biological Oxidative Stress. In: Hensley K, Floyd RA, editors: Humana Press. pp 161–168. 30. Nelson HH, Marsit CJ, Kelsey KT (2011) Global methylation in exposure
biology and translational medical science. Environmental health perspectives 119: 1528–1533.
31. Franco R, Schoneveld O, Georgakilas AG, Panayiotidis MI (2008) Oxidative stress, DNA methylation and carcinogenesis. Cancer Lett 266: 6–11. 32. Campos AC, Molognoni F, Melo FH, Galdieri LC, Carneiro CR, et al. (2007)
Oxidative stress modulates DNA methylation during melanocyte anchorage blockade associated with malignant transformation. Neoplasia 9: 1111–1121. 33. Hartnett L, Egan LJ (2012) Inflammation, DNA methylation and
colitis-associated cancer. Carcinogenesis.
34. Weitzman SA, Turk PW, Milkowski DH, Kozlowski K (1994) Free radical adducts induce alterations in DNA cytosine methylation. Proceedings of the National Academy of Sciences of the United States of America 91: 1261–1264. 35. Kuchino Y, Mori F, Kasai H, Inoue H, Iwai S, et al. (1987) Misreading of DNA templates containing 8-hydroxydeoxyguanosine at the modified base and at adjacent residues. Nature 327: 77–79.
36. Hitchler MJ, Domann FE (2007) An epigenetic perspective on the free radical theory of development. Free radical biology & medicine 43: 1023–1036. 37. Lertratanangkoon K, Orkiszewski RS, Scimeca JM (1996) Methyl-donor
deficiency due to chemically induced glutathione depletion. Cancer research 56: 995–1005.
38. Lertratanangkoon K, Wu CJ, Savaraj N, Thomas ML (1997) Alterations of DNA methylation by glutathione depletion. Cancer letters 120: 149–156. 39. Miller JW, Borowsky AD, Marple TC, McGoldrick ET, Dillard-Telm L, et al.
(2008) Folate, DNA methylation, and mouse models of breast tumorigenesis. Nutrition reviews 66 Suppl 1: S59–64.
40. Miller JW, Nadeau MR, Smith J, Smith D, Selhub J (1994) Folate-deficiency-induced homocysteinaemia in rats: disruption of S-adenosylmethionine’s co-ordinate regulation of homocysteine metabolism. The Biochemical journal 298 ( Pt 2): 415–419.
41. Subbalekha K, Pimkhaokham A, Pavasant P, Chindavijak S, Phokaew C, et al. (2009) Detection of LINE-1s hypomethylation in oral rinses of oral squamous cell carcinoma patients. Oral oncology 45: 184–191.
42. Yilmaz IA, Akcay T, Cakatay U, Telci A, Ataus S, et al. (2003) Relation between bladder cancer and protein oxidation. Int Urol Nephrol 35: 345–350. 43. Badjatia N, Satyam A, Singh P, Seth A, Sharma A (2010) Altered antioxidant
status and lipid peroxidation in Indian patients with urothelial bladder carcinoma. Urol Oncol 28: 360–367.
44. Bartosz G (2003) Total antioxidant capacity. Advances in clinical chemistry 37: 219–292.
45. Dey P (2004) Urinary markers of bladder carcinoma. Clinica chimica acta; international journal of clinical chemistry 340: 57–65.
46. Vrooman OP, Witjes JA (2008) Urinary markers in bladder cancer. European urology 53: 909–916.
47. Mitra AP, Cote RJ (2010) Molecular screening for bladder cancer: progress and potential. Nat Rev Urol 7: 11–20.