Crisis-Like Behavior in China's Stock Market
and Its Interpretation
Fangli Fan1,2, Jianbo Gao1,3*, Shuhong Liang2
1Institute of Complexity Science and Big Data Technology, Guangxi University, Nanning, Guangxi, P. R. China,2Business School, Guangxi University, Nanning, Guangxi, P. R. China,3PMB Intelligence LLC, Sunnyvale, United States of America
Abstract
In order for China to play a bigger, more positive role in the world, it is important for China to have a healthy capital market. This perception motivates us to examine the health of Chi-na's capital market, especially the severity of the overall loss of the listed companies in China and the effects of accounting irregularities on the losses. We show the overall loss of the listed companies was very severe, in particular, crisis-like behavior emerged in the fourth quarter of 2002, 2004, 2005, and 2008. We further observe that loss in the fourth quarter was much greater than the average loss of the first three quarters in the same year. The most straightforward interpretation of this loss pattern is that companies underreported losses in the first three quarters, to boost their stock values in most time of the year. Howev-er, in the fourth quartHowev-er, accounting balance of the whole year dictated that the reported loss in the fourth quarter had to be much greater than the actual loss. Fortunately, such irregular-ity has been greatly reduced, thanks to the accounting reforms in China in 2007.
Introduction
As the world's second largest economy, China has been playing an ever increasing role in the world's politics, economics, culture, foreign policy, international trade, military, among others. In particular, China has played a critical role in helping the rest of the world to recover from the recent gigantic Financial Crisis. To the great benefit of China and the world, it is critical for China to have a healthy market economy. One important component of the market economy is the capital markets.
As is well-known, the level of development of capital markets is closely related to the degree of economic development of a country. Healthy capital markets can provide an effective fi-nancing platform for the enterprise. Through an IPO fifi-nancing, listed companies can develop better and faster. In economically developed countries, the earnings of a large number of listed companies often can well reflect the economy of the country. However, in developing econo-mies, the capital market is yet to evolve to be perfect, and the weight of listed companies in the national economy is small, therefore, the status of their development cannot fully reflect the macroeconomy of the country [1]. However, recent studies have shown that as the economy
OPEN ACCESS
Citation:Fan F, Gao J, Liang S (2015) Crisis-Like Behavior in China's Stock Market and Its Interpretation. PLoS ONE 10(2): e0117209. doi:10.1371/journal.pone.0117209
Academic Editor:Alejandro Raul Hernandez Montoya, Universidad Veracruzana, MEXICO
Received:September 16, 2014
Accepted:December 21, 2014
Published:February 6, 2015
Copyright:© 2015 Fan et al. This is an open access article distributed under the terms of theCreative Commons Attribution License, which permits unrestricted use, distribution, and reproduction in any medium, provided the original author and source are credited.
Data Availability Statement:We examined 2468 Chinese A-share listed companies’income data. These data are downloaded from the Wind database (http://www.wind.com.cn/).
Funding:The authors received no specific funding for this work. Co-author Prof. Gao is employed by PMB Intelligence. PMB Intelligence LLC did have a role in the study design, data collection and analysis, decision to publish, or preparation of the manuscript. The specific role of this author is articulated in the
‘author contributions’section.
continues to develop, there is not only a correlation between the macroeconomy and capital markets, but that the influence of capital markets on macroeconomy is increasing [2]. There-fore, study of the earnings of listed companies in a developing economy can still help under-stand the economy of the country. Based on this rationale, many researchers have devoted their attention to the study of the earnings of the Chinese A-share listed companies. So far, published researches have focused on accounting cheating [3], tunneling behavior [4,5], profit manipulation [6], and identification of these abnormal behaviors [7]. These studies are largely qualitative; albeit some of them have studied certain specific factors underlying a phenomenon, they have ignored some of the more fundamental issues, such as how severe is the overall loss of the listed companies? are the losses of the listed companies abnormal? is the accounting practice associated with these losses consistent with established norms? do the losses harm the interests of investors? Further accompanying these issues are (1) are the abnormal behaviors decreasing? and (2) is China's capital market becoming healthier?
An extreme case of loss is generated by financial crises. In the past three decades, the world has seen many countries experiencing financial crises with different degrees of severity. Espe-cially costly is the 2008 global financial crisis, which has affected essentially all the industrial-ized countries, as well as a large number of developing economies. The grave cost of the crisis has pushed early warning system (EWS) models for predicting and mitigating severity of future crises into the spotlight.
Existing EWS models include the leading indicator approach [8], the discrete-dependent-variable approach based on logit and probit models [9,10], structural equation model [11], and network-based models [12,13]. The results obtained so far are mixed, however. For example, the loss of information using a binary variable in the leading indicator approach is questionable [14–16]. After carefully examining the Multiple-Indicator Multiple Cause (MIMIC) model of Goldberger [11], Rose and Spiegel [17] in particular, have concluded that few of the character-istics suggested as potential causes of the crisis actually help predict the intensity and severity of the crisis across countries. The best indicators for the 2008 crisis include asset price inflation, rising leverage, large sustained current account deficits, and a slowing trajectory of economic growth [18]. Overall, however, economists have not had a particularly good track record at pre-dicting the timing of crises [17]. This has motivated us to develop an entropy-based indicator of financial crisis [19,20].
To gain insights into the numerous important questions we have posed about the health of China's capital markets, we examine the behaviors of companies listed in China's A-share mar-ket. While a company's activity is characterized by many variables, the most important one has to be the earning, or the profit. Therefore, we will apply the entropy approach of Gao et al. [19,
20] to examine the earnings of thousands of Chinese A-share listed companies.
Materials and Methods
1 Data
We examine 2468 Chinese A-share listed companies' profit data. These data are downloaded from the Wind database (http://www.wind.com.cn/). These companies are divided into 12 sectors including AFLF (agriculture, forestry, livestock, and fishery), Construction, Culture, Electricity, Extractive, Financial, Information Technology (IT), Manufacturing, Real estate, Retail, Services, and Transportation.
Due to absence of accounting audit in Q1-Q3 in China, it is generally thought that yearly total profit data are more meaningful than quarterly profits. To best reveal the working mecha-nism of accounting and other irregularities, we will focus on quarterly profits in this work. By computing entropies for positive and negative profits of companies in different sectors at
different times, we show that there exist economic recession or financial crisis-like behaviors in many sectors of China's economy. Such behaviors exclusively occurred in the fourth quarter of a number of years. Accompanying this were the abnormally low Q4's earnings. Such behaviors were clearly not consistent with a good capital market. Fortunately, such irregularity has been greatly reduced, thanks to accounting reforms in China in 2007.
2 Shannon entropy
The stability or strength of an profit cluster may be quantified by its entropy, given that the sec-ond law of thermodynamics can be equivalently restated as saying that the most stable configu-ration is the one with the highest entropy [21]. For the negative and positive profit clusters considered here, the Shannon entropy is a pertinent measure, and for discrete probabilities is given by [22]:
H¼ XPilogPi; ð1Þ
wherePiare the probabilities that the positive or negative profits will fall within a prescribed
bini(where a bin is an interval offixed length). We shall take 2 as the base of the logarithm so
that the unit of the entropy is the bit. Note that when all the probabilities are equal, Shannon entropy attains its largest value; such a situation may be associated with the discretization of a uniform distribution.
3 Distributional analysis
When examining the distribution of losses due to financial crises, Gao et al. [19,20] have found that the most pertinent distribution is the heavy-tailed distribution, which includes the celebrated Pareto-law as a special case:
PðXxÞ:x a
;x! 1 ð2Þ
whereαis a parameter. When 0<α<2, the distribution has infinite variance, and when
0<α1, the mean is also infinite [23]. This is the distribution that we will focus on in the
later discussions.
Results
1 Crisis-like behavior in China's capital market
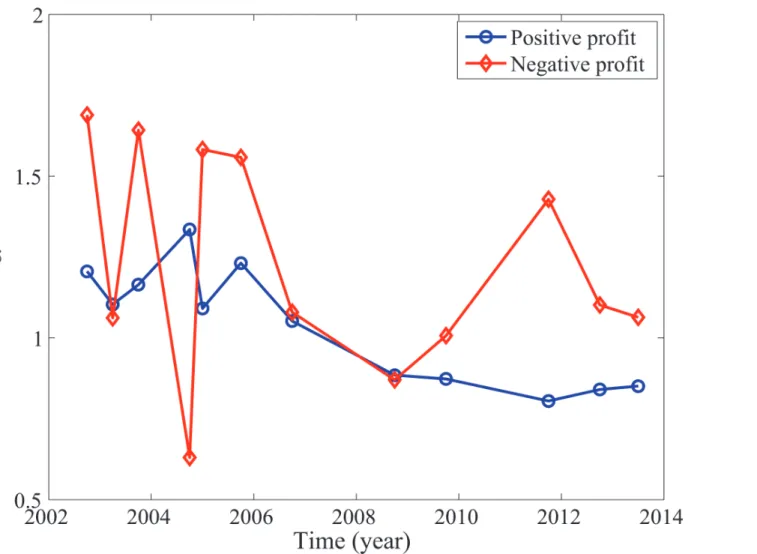
The rationale behind the entropy formulation lies in considering the relative strength of the two clusters formed by companies with positive and negative profits. It has been found that in normal economic times [20], the entropy for the negative profit cluster will be close to zero. Near or during recessions and crises, the entropy for the negative profit cluster will be compa-rable to or even larger than that for the positive profit cluster, signifying that the negative profit cluster is more stable or stronger than the positive profit cluster. Such situations can be clearly seen in China's earnings data, as shown inFig. 1(A). In particular, we observe 4 crisis-like times inFig. 1(A). One is at Q4 of 2008. This is clearly caused by the 2008 global financial crisis. Three others occurred in Q4 of 2002, 2004, and 2005.
presented inFig. 1(A). We surmise that the upward trend in the entropy curves is related to the rapid growth of Chinese stock market, as well as China's GDP. To check our idea, we have shown inFig. 1(B,C)the variation of the sum of the positive and negative profits and GDP with time (all in logarithmic scale). As expected, these curves have well-defined upward trends. In particular, the global linear trend inFig. 1(C)has a slope almost the same as that of the en-tropy curve for the positive profits shown inFig. 1(A). Therefore, the upward trends in the en-tropy curves are indeed at least partly due to the rapid growth of China's economy and stock market.
More insights into the crisis-like behavior can be gained by examining companies in their respective sectors, an approach suggestive of an anatomy of an economy [19]. For the data ana-lyzed here, the results are shown inFig. 2. We observe that the sectors of culture, real estate, and manufacturing have all exhibited crisis-like behavior, with manufacturing being the worst. The situations for other sectors are clearly worse before 2007 than after 2007, albeit they did not show crisis-like behavior.
Fig 1. Entropy for the positive (blue) and negative (red) profits, and temporal variation of the sum of all positive (blue) and negative (red) profits, and GDP.
It is important to note that in the years when crisis-like behavior was not observed, Q4 was always the worst, i.e., the red curves always show a local maximum at Q4.
To appreciate better the severity of the losses, we have examined the complementary cumu-lative distribution function (CCDF) of both the losses and the profits. Examples for a number of quarters are shown inFig. 3. While it is not surprising that positive profits follow a Pareto law, we have observed that negative profits may also follow a Pareto law, with a well-definedα,
whose values, together with those for the positive profits are shown inFig. 4. Often due to
Fig 2. Entropy for the positive (blue) and negative (red) profits of companies listed in 6 sectors of Chinese A-share stock market.
limited scaling region for the CCDF of negative profits, the estimatedαvalues there may not
reflect the "heaviness" of the CCDF of negative profits. To be consistent with entropy values, when the CCDF curve for the negative profit is basically on top of that for the positive profits, we have to say that the CCDF for the negative profits is heavier than that for positive profits. This is precisely why the Q4 of 2002, 2004, 2005, and 2008 are the problematic times—here,
the CCDF for the losses are indeed on top of those for the positive profits, so do the entropy values.
Fig 3. Examples of complementary cumulative distribution functions (CCDFs) in 12 different quarters.
2 Main cause of the crisis-like behavior
Why were there crisis-like behaviors among the companies that are listed in the China's stock market? The main part of the answer has much to do with accounting irregularity, noticing that in China, accounting is only audited at the end of the year, or Q4, but not in Q1-Q3. This paves the way for companies to report profits totally inconsistent with their actual earnings in Q1-Q3. In particular, to boost their stock value, a company with losses tends to report less loss in Q1-Q3, while a company with positive profit may choose to report better than actual earn-ings in Q1-Q3. In both cases, Q4 earning has to be much lower than the actual one, if the total yearly profit is to reflect the actual earning. This consideration highlights why recession or cri-sis-like behavior in China exclusively occurred in Q4 of a number of years.
To quantify the above scenarios, let us consider earnings of the 4 quarters in a particular year. Let us denote them byPi;i¼1; ;4. Let us denote the mean and the standard deviation
ofPi;i¼1;2;3byPand STD, respectively. We then consider the variable
Ratio¼ ðP P4Þ=STD ð3Þ
IfPi;i¼1; ;4are drawn from a single Gaussian distribution, then it is well known that
when the tail is 1, 2, and 3-standard deviations away from the mean, the tail probabilities are
Fig 4. Parameterαfor positive (blue) and negative (red) profits corresponding toFig. 3.
32%, 5%, and 0.3%, respectively.Ratiodefined inEquation 3is half of the tail probability with
its value equaling 1, 2, and 3, respectively. AlbeitPi;i¼1; ;4may not truly follow a
Gauss-ian distribution, it nevertheless will be instructive to consider the abundance of companies withRatioexceeding certain threshold value. This abundance can be quantified by the
percent-age of companies withRationthesholdin the corresponding negative and positive profit
cluster. The result for the negative profit case is shown inFig. 5. We observe that this percent-age is quite significant. In particular, the curves inFig. 5do not change much before 2007, for differentthresholdvalues. Since the threshold value can be as high as 8 while the percentage is
still above 0.6, we can confidently conclude that widespread accounting irregularity had existed in China, especially before 2007 and for companies with losses, even thoughPi;i¼1; ;4
may not follow Gaussian distribution at all. This interpretation also naturally explains why Q4 is always the worst, as we have remarked earlier.
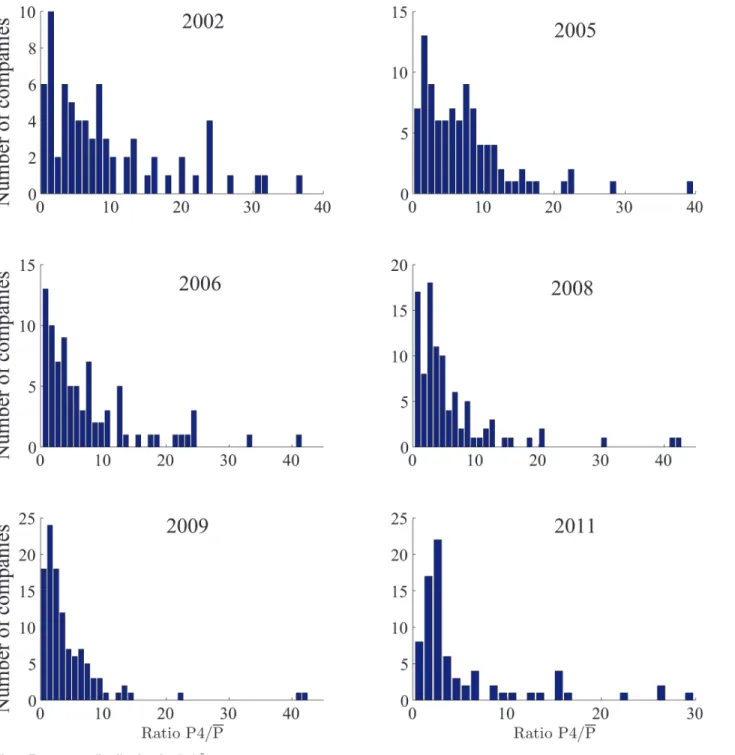
To better see how much greater the loss in Q4 is compared with the other 3 quarters of the same year, it is instructive to evaluate the distribution ofP4=P. Examples for 6 years are shown
inFig. 6. We observe that sometimes the reported loss in Q4 can be several tens of times that of the average loss in the first three quarters. The abnormal loss in Q4 in these and other years highlights that a number of listed companies may have engaged in profit manipulation. Indeed, a number of scenarios for profit manipulation and accounting cheating in China have been identified [24–26].
3 Is "big bath" a prominent factor?
To explain the abnormal Q4 loss, a number of researchers in China (see for example, [27]) have suggested that a phenomenon, called "big bath", may be a prominent factor. By "big bath", it was thought that companies with losses did not engage in profit manipulation; rather, they tended to take a "big bath", i.e., to deliberately take a huge loss in Q4 so that they can turn into profits next year. Those researchers further argued that the more losses a company had to shoulder, the more likely it would take a "big bath".
To evaluate how significant this phenomenon could be, it suffices to examine the raw earn-ings data of a number of companies.Fig. 7shows data for six more or less arbitrarily chosen companies with losses. Had the "big bath" been a main factor, we should have observed impres-sive earnings in the years following huge Q4 losses. However, only in one year, i.e., inFig. 7(B), had this been observed once. In all other times and for all the companies, no impressive earn-ings had been observed following the abnormal Q4 losses. Therefore, we have to conclude that "big bath" could at best be a secondary factor, if it was a factor at all.
Discussion
To shed light on how healthy China's capital market is, we have examined earnings of thou-sands of companies listed in China's stock market. We have shown there exist economic reces-sion or financial crisis-like behaviors in many sectors of China's economy, especially before 2007. Such behaviors exclusively occurred in the fourth quarter of a number of years. Accom-panying this were the abnormally low Q4's earnings. We have identified that the latter is a vivid manifestation of widespread accounting irregularity in China before 2007—to boost
Fig 5. Percentage of companies with Q4 earnings satisfyingðP―
P4Þ=STDthreshold.
A few significant features highly suggest that China has been trying to converge to a market economy. One feature is related to the large impact of the 2008 global financial crisis on China's economy. The crisis-like behavior in Q4 of 2008 suggests that China's economy has been close-ly tied with global economy. This clearclose-ly will accelerate the rate for China to converge to a mar-ket economy. The second feature is related to the Pareto-distributed profits. Since Pareto-law is a universal law for wealth distribution, the ubiquitous Pareto-law in China's earnings data sug-gests that China's economy is no longer very different from other more developed countries. The third feature is still related to the Pareto-law, but for the negative profit cluster. Observing
Fig 6. Frequency distribution forP4=P
―
.
widespread losses in all these years, we have to conclude that China's economy is far from effi-cient. Much effort has to be made for further development.
Author Contributions
Conceived and designed the experiments: JG. Performed the experiments: FF. Analyzed the data: FF JG. Contributed reagents/materials/analysis tools: FF JG. Wrote the paper: FF JG SL. Provided professional knowledge: SL.
Fig 7. Examples of earnings data for companies with losses.The timing of local minima corresponds to Q4.
References
1. Ma J, Guan W (2006) An empirical analysis of the relationship between the Chinese stock market and macroeconomy.Research on Financial and Economic Issues 8:71–76.
2. Peng HD, Zhou XC (2012) An empirical analysis of the relationship between the Chinese securities market and macroeconomy.Fiscal and financial1:70–75.
3. Yan CL (2004) An analysis of the accounting cheating of listed companies.Management World4:111–
117.
4. Johnson S, Porta R La, Lopez-de-Silanes F, Shleifer A (2000) Tunneling.American Economic Review 90:22–27.
5. Zhang XJ, Guo L (2007) Earnings management and tunneling behavior of controlling large shareholder evidence from rights issue companies.Nankai Economic Studies6:76–94.
6. Li YP, Li RS (2005) Is accounting surplus robustness? or profit manipulation? empirical evidence from China listed companies.China Accounting and Finance Review9:1–56.
7. Li YX, Gao R (2007) Based on bayes discriminant to research the recognition model of China listed companies profit manipulation.Forecasting 3:56–60.
8. Kaminsky GL, Lizondo S, Reinhart CM (1998) Leading Indicators of Currency Crises. IMF Staff Papers 45(1): 1–48.
9. Maddala GS (1986)Limited-dependent and Qualitative Variables in Econometrics, Econometric Socie-ty Monographs, Cambridge UniversiSocie-ty Press, 414 p.
10. Bussiere M, Fratzscher M (2006) Towards a new early warning system of financial crises. Journal of In-ternational Money and Finance 25(6):953–973.
11. Goldberger AS (1972) Structural Equation Methods in the Social Sciences.Econometrica40:979–1002. 12. Niemiraa MP, Saaty TL (2004) An Analytic Network Process model for financial-crisis forecasting.
Inter-national Journal of Forecasting 20(4):573–587.
13. Ozkan-Gunay EN, Ozkan M (2007) Prediction of bank failures in emerging financial markets: an ANN approach.The Journal of Risk Finance8(5):465–480.
14. Berg A, Pattillo C (1999) Are Currency Crises Predictable? A Test. IMF Staff Papers 46(2):107–38. 15. Berg A, Pattillo C (1999) AnPredicting Currency Crises: The Indicators Approach and an Alternative.
Journal of International Money and Finance 18:561–86.
16. Berg A, Borensztein E, Patillo C (2004) Assessing Early Warning Systems: How Have They Worked in Practice? IMF Working Paper 4:1–45.
17. Rose AK, Spiegel MM (2012) Cross-Country Causes and Consequences of the 2008 Crisis: Early Warning. CEPR Discussion Paper 24(1):1–16.
18. Reinhart CM, Rogoff KS (2008) Is the 2007 US sub-prime financial crisis so different? An international historical comparison.American Economic Review98:339–344.
19. Gao JB, Hu J (2014) Financial crisis, Omori's law, and negative entropy flow.International Review of Fi-nancial Analysis33:79–86.
20. Gao JB, Hu J, Mao X, Zhou M, Gurbaxani B, et al. (2011) Entropies of negative profits, Pareto-distribut-ed loss, and financial crises.PLoS ONE 6(10):1–6.
21. Feynman RP (1964)The Feynman Lectures on Physics. United States: Addison-Wesley. PMID: 24547381
22. Cover TM, Thomas JA (1991)Elements of Information Theory. New York: Wiley-Blackwell. 776p. PMID:25144101
23. Gao JB, Cao YH, Tung WW, Hu J (2007)Multiscale Analysis of Complex Time Series—Integration of
Chaos and Random Fractal Theory,and Beyond. Hoboken: Wiley-Blackwell. pp.38–40,51. doi:10.
1624/105812407X244958PMID:19065723
24. Yang GM (2007)"Receivable amounts" and the false profits of listed companies.Friends of Accounting 6:25–26.
25. Xu WJ (2009) Impact of non-recurring gains and losses on the financial performance of listed compa-nies—an analysis based on 2007 annual report of listed companies in the Shanghai market.Journal of Central University of Finance & Economics3:31–97. doi:10.1136/bmjopen-2014-005657PMID:
25573520
26. Zhang X (2010) Earnings management by the listed companies with losses—an analysis based on the
reported data in the fourth quarter report.Finance & Economics6:33–41.