Hoda M. O. Mokhtar
Faculty of Computers and Information, Cairo University Cairo, Egypt
ABSTRACT
Transportation is the driving force of any country. Today we are facing an explosion in the number of motor vehicles that affects our daily routines. Intelligent transportation systems (ITS) aim to provide efficient tools that solve traffic problems. Predicting route congestions during different day periods can help drivers choose better routes for their trips. In this paper we propose “HITS” a traffic control system that integrates moving object database techniques [30, 28] along with data warehousing techniques [15]. Our system uses historical traffic information to answer queries about moving objects on road network, and to analyze historical traffic conditions to enhance future traffic related decisions.
Keywords
Intelligent transportation systems, spatio-temporal data warehouses, moving object databases.
1. INTRODUCTION
Moving object databases (MOD) are among the recent research directions that emerged to fulfill the requirements of many potential applications. In general moving objects are defined as objects that change their location and/or extent (shape) over time [30, 28]. Moving objects are classified into 2 main categories: moving points as cars, buses, planes, mobile users, etc., and moving regions as forest fires, and hurricanes, etc. Today, with the rapid developments in wireless communication devices and positioning technologies (e.g. Global Positioning Systems (GPSs)), acquiring huge amounts of location data is possible. MOD emerged as a solution to provide efficient management, storage, modeling, and querying for the large amount of continuously changing location information that can no longer be handled with traditional database systems. A wide spectrum of location-based services including: m-commerce, intelligent transportation systems, smart parking, and many others became possible with the development of MOD applications.
surface transportation networks [3]. Transportation is considered the driving force for any country. Maintaining a safe, smooth, and secure road network is the key for improving the mobility and quality of citizens’ life. During the last years more attention was directed towards traffic safety. During 2008 there was 43,017 fatal crashes on Roadway, USA [2], this triggered the need for Intelligent Transportation Systems (ITS). ITS is an emerging application that is currently being applied and investigated by many countries [3].
On the other hand, efficient decision making is an important step in building an efficient traffic control system. Data warehousing techniques are among the techniques that were proposed to enhance and accelerate decision making in an environment full of historical data. The term ‘data warehouse’ originated recently, and it rapidly became recognized by the community. According to Inmon in [15], a data warehouse is defined as a subject-oriented, integrated, time-variant, non-volatile collection of data that helps and supports the decision making process. Data warehouses employ the multidimensional model approach to view informational data using data cubes [6]. In general, a multidimensional model is usually implemented using either a de-normalized star schema or a normalized snow-flake schema. In this paper we will employ the star schema model with a central fact table and a number of dimension tables. In general, the fact table is the main component that includes all the history stored in the data warehouse along with the measures needed for decision making. The dimension tables are then linked with the fact table through foreign-key to primary-key relationship. Although normalized snowflake schema is another possible choice, the required overhead resulting from the “join” operations imposed by this model, makes it not an optimal solution in our case. The main function of data warehouses is to enable On-Line Analytical Processing (OLAP) operations including mainly aggregation (roll-up), and de-aggregation (drill-down) of information along one or more dimensions, as well as, selection and projection (slicing and dicing) on the data cube dimensions, and finally pivoting.
Inspired by the importance of efficient decision making along with the role of MOD in building an intelligent transportation system, we integrate both fields to develop an efficient traffic control system. Our proposed system employs historical vehicles motion patterns to answer a wide range of traffic related queries. Different moving object queries including nearest neighbor queries, range queries, along with different aggregate queries as number of moving objects in a certain region during a given time period (either in the past or the future) are all possible queries that can be efficiently answered with our proposed system.
The main contributions of the paper are:
• Integrating data warehousing and OLAP techniques together with moving object databases.
• Proposing a multi-dimensional model (star-schema) for moving objects (spatio-temporal objects) that captures a number of traffic related measures (facts) in its fact table.
The remainder of the paper is organized as follows: Section 2 presents a brief survey of related work. Section 3 describes the technical components of the system. Sections 4, 5 present samples of the queries answered by the system. Section 6 concludes and proposes possible future work.
2. RELATED WORK
With the tremendous increase in the availability of location information, and the continuous and rapid advances in positioning systems (specially Global Positioning Systems (GPSs)), moving object databases MOD were proposed to present solutions for efficient management, storage, indexing, and querying location information. Moving objects are classified into 2 main classes: moving points and moving regions. Several research work investigated different issues in MOD. Modeling moving objects was studied in several work including [11, 29, 26] where discrete, continuous, and constraint models were proposed. Indexing MOD was also the focus of many papers including [24, 25, 5, 16]. In those papers various index structures with different features were presented to enhance query processing. Also, querying MOD is still an open research direction where efficient query processing techniques and algorithms are proposed along with the investigation of a wide range of moving object related queries including range queries, nearest neighbor and reverse nearest neighbor queries, skyline queries, etc. [19, 8, 14, 4].
Along with the research in MOD, data warehouses also received considerable attention from the research community due to their vital role as a decision making support tool. Data warehouses were first introduced in [15] as an integrated, historical, subject-oriented, and time-variant collection of data for supporting decision making. Spatial data warehouses were first developed to support geographical based businesses. Spatial data warehouses gained their importance due to the fact that approximately 80% of large corporation databases have geographical information contained in them [12].
Driven by the importance of spatial data warehouses, several research work studied this area. In [13], a technique was proposed to minimize the cells that need to be merged or processed for answering a spatial-based query. In [31], the authors studied the problem of detecting boundaries of a set of merged cells, an efficient technique was proposed.
3. HISTORICAL INTELLIGENT TRANSPORTATION SYSTEM
(HITS)
In this paper we focus on moving points and more specifically on moving points on road networks. The motion of a moving point is usually expressed by its trajectory that represents the path that the object follows during its motion over time. In this paper we model a moving object trajectory as a sequence of discrete locations over time.
Definition: A moving object trajectory is an ordered sequence of quadruples
< (id1, x1, y1, t1), (id2, x2, y2, t2),…, (idn, xn, yn, tn) >, where (xi, yi) represents the 2-dimensional position of the
moving object at time instant ti. Such that ti<ti+1∀1 i n. And, idiis an object identifier.
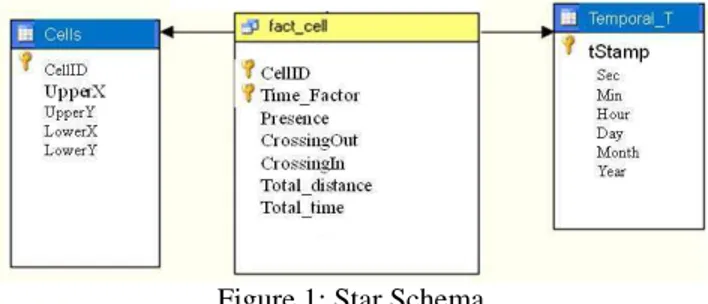
The trajectory data warehouse is then built on top of the above framework. The proposed multidimensional model will abstract from the identity of the moving objects, since we are interested in studying global properties of a set of such objects, like the number of objects in a spatial cell, or the total distance traveled by such objects inside a cell, rather than querying about a specific object. The famous star schema paradigm is employed as our multidimensional model [15]. The schema consists of the fact table that contains foreign keys for the dimension tables along with the facts (measures) that we will evaluate. The base cuboids are composed of the spatio-temporal cells, consisting of regions and time intervals that we are interested in. For simplicity, we will use a regular subdivision of space so that aggregation operators will be easier to define and understand. The model is simply defined by a star schema, typical for data warehouse models. The two dimensions of our data warehouse are: the spatial dimension (cell dimension), and the temporal dimension T. Figure 1 presents the cube design generated in Microsoft’s Analysis Services.
Figure 1: Star Schema
The cell dimension has 4 members (attributes) namely: minX, maxX, minY, and maxY.
attributes. A time hierarchy ranging from seconds to years is allowed. This hierarchy allows a wider range of traffic queries that consider different time instances and periods. Before feeding the data into our trajectory data warehouse and constructing the cube, the data is prepared to be analyzed and aggregated. This pre-processing is done in the Extract- Transform-Load (ETL) process that is common in data warehousing. The ETL is a crucial phase for preparing the trajectories for computing the measures.
Our ETL process is similar to the one proposed in [17] and is implemented using .NET framework (in C# language). Our trajectory rep-processing phase proceeds as follows:
1. First, the trajectory is reconstructed from its sampled data. In this step, different trajectory segments (motions) are identified.
2. Next, linear interpolation is used to construct a continuous piece-wise linear trajectory from the discrete samples. Linear interpolation is employed because it is simple and provides fair approximation. This interpolation step is employed to identify objects that cross in/out map cells to speed-up future computations.
3. Finally, data is loaded into the data warehouse. After completing the pre-processing stage, the MOD trajectories are now ready for further analysis and querying. In addition, information regarding cells visited by different trajectories is also available for use.
4. QUERYING HITS
Once the ETL stage is done, the data is ready for analysis. In this paper we will consider measures presence, total distance, total travel time, CrossingIn, and CrossingOut [18]. The first measure is the (approximate) count of the different distinct objects present in a spatial cell during a time instant or a time interval. The second measure is the sum of the (approximate) distances covered by the objects inside a cell during a time interval. The third measure computes the total time taken by all objects traveling in a cell. The last 2 measures calculate the number of objects that cross cell borders either entering or leaving a cell respectively. The different measures are calculated through the execution of a number of SQL (or possibly MDX) queries as follows. (Note: The variables like @t1, @t2 can be changed to any value to test the query)
1. Calculating the presence measure
SELECT DISTINCT SUM(presence) AS PresenceTotal, upperX, lowerX, upperY,lowery FROM Fact Cell
WHERE (Time Factor BETWEEN @t1 AND @t2) AND (Cell ID = @Cell ID) GROUP BY upperX, lowerX, upperY, lowery
2. Calculating the total traveled distance
SELECT DISTINCT SUM(Total distance) AS DistanceTotal, Cell ID FROM Fact Cell
3. Calculating the CrossingIn measure
SELECT DISTINCT SUM(crossingIn) AS crossingInTotal, upperX, lowerX, upperY,lowerY FROM Fact Cell
WHERE (Time Factor BETWEEN @t1 AND @t2) AND (Cell ID = @Cell ID) GROUP BY upperX, lowerX, upperY, lowery
4. Calculating the CrossingOut measure
SELECT DISTINCT SUM(crossingOut) AS crossingOutTotal, upperX, lowerX, upperY,lowerY FROM Fact Cell
WHERE (Time Factor BETWEEN @t1 AND @t2) AND (Cell ID = @Cell ID) GROUP BY upperX, lowerX, upperY, lowerY
In addition to the calculated measures, the HITS system also allows other moving object related queries to be computed. K-NEAREST NEIGHBOR (k-NN) and RANGE queries are both traffic related queries. Queries like: Q1: “Retrieve the objects that where in Central Square between 4:00pm and 7:00 yesterday.” Q2: “Retrieve the police cars that where near accident #Acc2 that occurred last Thursday at 9:00am.” Along with other similar queries are all necessary queries that request specific objects to be retrieved from the data warehouse. However, such queries are not very common in the data warehouse environment as their answer is not a result of an OLAP operation (i.e. aggregation, slicing, dicing, etc.) yet those queries are still crucial for developing an efficient ITS system. Therefore, the ability to compute those queries upon request is provided without being computed in the fact table as regular measures.
The SQL statements used for implementing those queries are as follows:
1. Computing the k-NN query
For this query we retrieve from the data warehouse the objects that where within a certain distance (Dist) from a query object during a given time interval.
SELECT DISTINCT objID, X, Y, T, cellid FROM Trajectory
WHERE (T BETWEEN @t1 AND @t2) AND (SQRT(POWER(@X - X, 2) + POWER(@Y - Y, 2)) 6 @Dist) AND(cellid = @cellid) AND (objID 6= @objID)
ORDER BY cellid
2. Computing range query For this query we retrieve from the data warehouse the objects existed in a certain grid cell during a given time interval.
SELECT DISTINCT objID, cellid FROM Trajectory
WHERE (T BETWEEN @t1 AND @t2) AND (cellid = @cellid) ORDER BY cellid
total distance measure provided in the fact table along with average speed of each object as an object attribute; computing the average time is feasible.
5. HITS SYSTEM OVERVIEW
In this paper, we consider data of moving objects generated using the Brinkoff generator [32]. The Brinkoff generator is commonly used for generating realistic moving objects. Using the generator, we generated about 33,000 two dimensional trajectories of vehicles on road network.
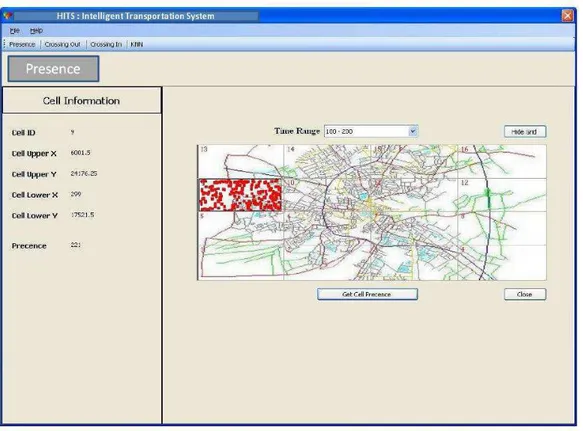
The following figures present snapshots of HITS execution. Initially the system loads the spatial map of interest, then the map is divided into a 4x4 grid (the granularity of the grid is a user defined parameter). Once the grid is defined, cell borders are computed and stored in the data warehouse. The user is allowed to show/hide the grid cell. Showing the grid cells enables the user to select a specific cell for his queries.
Figure 2: Presence Measure Computation
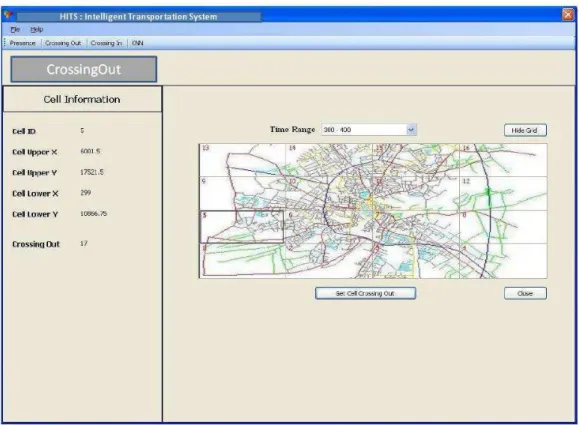
Figure 3: Crossing Out Measure Computation
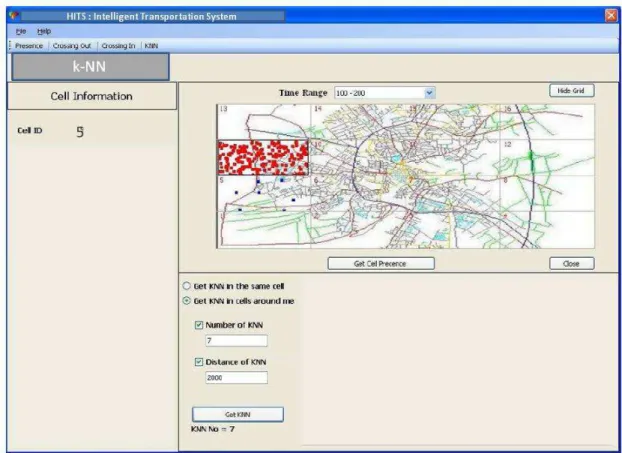
Figure 4: k-NN Query Computation
REFERENCES
[1] http://www.heavyreading.com/details.aspsku id=2212&skuitem itemid=1102. [2] http://www-fars.nhtsa.dot.gov/Crashes/CrashesLocation .aspx, December 2008. [3] http://www.infoexport.gc.ca/iei/ieiSmartViewer.jsp =5714&sitid=90, February 2009.
[4] Bin Yang 0002, Hua Lu, and Christian S. Jensen. Probabilistic threshold k nearest neighbor queries over moving objects in symbolic indoor space. In EDBT, pages 335–346, 2010.
[5] P.K. Agarwal, L. Arge, and J. Erickson. Indexing moving points. In 19th ACM Symposium on Principles of Database Systems, pages 175–186, 2000.
[6] Sameet Agarwal, Rakesh Agrawal, Prasad Deshpande, Ashish Gupta, Jeffrey F. Naughton, Raghu Ramakrishnan, and Sunita Sarawagi. On the computation of multidimensional aggregates. In VLDB ’96: Proceedings of the 22th International Conference on Very Large Data Bases, pages 506–521, San Francisco, CA, USA, 1996. Morgan Kaufmann Publishers Inc.
[9] S. Bimonte, A. Tchounikine, and M. Miquel. Towards a spatial multidimensional model. In DOLAP ’05: Proceedings of the 8th ACM international workshop on Data warehousing and OLAP, pages 39–46, New York.
[10] M.-L. Damiani and S. Spaccapietra. Spatial data warehouse modelling. Processing and Managing Complex Data for Decision Support, pages 12–27, 2006.
[11] M. Erwig, R. H. Guting, M. Schneider, and M. Vazirgiannis. Spatio-temporal data types: an approach to modeling and querying moving objects in databases. GeoInformatica, 3(3):269–296, 1999.
[12] Michael L. Gonzales. Seeking spatial intelligence. Intelligentent Enterprise, 3(2), Jan. 2000.
[13] Jiawei Han, Nebojsa Stefanovic, and Krzysztof Koperski. Selective materialization: An efficient method for spatial data cube construction. In PAKDD ’98: Proceedings of the Second Pacific-Asia Conference on Research and Developmentin Knowledge Discovery and Data Mining, pages 144–158, London, UK, 1998. Springer-Verlag.
[14] Zhiyong Huang, Hua Lu, Beng Chin Ooi, and Anthony K.H. Tung. Continuous skyline queries for moving objects. IEEE Transactions on Knowledge and Data Engineering, 18:1645–1658, 2006.
[15] W. H. Inmon. Building the Data Warehouse,3rd Edition. John Wiley & Sons, Inc., New York, USA, 2002.
[16] G. Kollios, D. Gunopulos, and V. J. Tsotras. On indexing mobile objects. In Proc. ACM Symp. on Principles of Database Systems, pages 261–272, 1999.
[17] G. Marketos, E. Frentzos, I Ntoutsi, N. Pelekis, A. Raffaeta, and Y. Theodoridis. Building real world trajectory warehouses. In Proc. 7th International ACM SIGMOD Workshop on Data Engineering for Wireless and Mobile Access (MobiDE’08), Vancouver, Canada, June 2008.
[18] H. M. O. Mokhtar and G. Mahmoud. Querying trajectory data warehouses. DBKDA: The 1st International Conference on Advances in Databases, Knowledge, and Data Applications, pages 101–107, March 2009.
[19] Hoda M. O. Mokhtar and Jianwen Su. Universal trajectory queries for moving object databases. In
IEEE IntC˙onfo˙n Mobile Data Management (MDM’04), pages 133–144, Berkeley, California, January 19 – 22, 2004.
[20] S. Orlando, R. Orsini, A. Raffaet, A. Roncato, and C. Silvestr. Trajectory data warehouses: Design issues and use cases. In Fifteenth Italian Symposium on Advanced Database Systems SEBD, pages 208– 219, Italy, June 2007.
[21] S. Orlando, R. Orsini, A. Raffaet, C. Silvestr, and A. Roncato. Trajectory data warehouses: Design and implementation issues. Journal of Computing Science and Engineering, 1(2):240–261, 2007.
[22] T. Pedersen and N. Tryfona. Pre-aggregation in spatial data warehouses. In LNCS, editor, SSTD, volume 2121, pages 460–480, 2001.
[23] N. Pelekis, A. Raffaet, M.L. Damiani, C. Vangenot, G. Marketos, E. Frentzos, I Ntoutsi, and Y. Theodoridis. Towards Trajectory Data Warehouses, Springer, 2007.
[24] D. Pfoser, C. Jensen, and Y. Theodoridis. Novel approaches to the indexing of moving object trajectories. In Proc. Int. Conf. on Very Large Data Bases, pages 395–406, 2000.
[25] S. Saltenis, C.S. Jensen, S.T. Leutenegger, and M.A. Lopez. Indexing the positions of continuously moving objects. In Proc. ACM SIGMOD Int. Conf. on Management of Data, page 331, 2000.
[26] A. P. Sistla, O. Wolfson, S. Chamberlain, and S. Dao. Modeling and querying moving objects. In
Proc. Int. Conf. on Data Engineering, pages 422–432, 1997.
[27] Nebojsa Stefanovic, Jiawei Han, and Krzysztof Koperski. Object-based selective materialization for efficient implementation of spatial data cubes. IEEE Transactionson Knowledge and Data Engineering, 12(6):938–958, 2000.
[28] O.Wolfson, S. Chamberlain, S. Dao, and L. Jiang. Location management in moving objects databases. In Proc. the Second International Workshop on Satellite- Based Information Services (WOSBIS’97), Budapest, Hungary, October 1997.
[30] O. Wolfson, B. Xu, S. Chamberlain, and L. Jiang. Moving objects databases: issues and solutions. In
Proc. Int. Conf. on Statistical and Scientific Database Management, pages 111–122, 1998.
[31] Xiaofang Zhou, David Truffet, and Jiawei Han. Efficient polygon amalgamation methods for spatial OLAP and spatial data mining. In SSD ’99: Proceedings of the 6th International Symposium on Advances in Spatial Databases, pages 167–187, London, UK, 1999. Springer-Verlag.
[32] T. Brinkhoff, Generating traffic data, IEEE Computer Society Technical Committee on Data Engineering,19–25, 2003.
Authors
Hoda M. O. Mokhtar