Arterial Pressure Variation as a Biomarker of
Preload Dependency in Spontaneously
Breathing Subjects
–
A Proof of Principle
Anne-Sophie G. T. Bronzwaer1,4, Dagmar M. Ouweneel2,4, Wim J. Stok3,4, Berend E. Westerhof4,5, Johannes J. van Lieshout1,3,4,6*
1Department of Internal Medicine, Academic Medical Center, Amsterdam, the Netherlands,2AMC Heart Center, Academic Medical Center, Amsterdam, the Netherlands,3Department of Anatomy, Embryology and Physiology, Academic Medical Center, Amsterdam, the Netherlands,4Laboratory for Clinical
Cardiovascular Physiology, Center for Heart Failure Research, Academic Medical Center, Amsterdam, the Netherlands,5Edwards Lifesciences BMEYE, Amsterdam, the Netherlands,6MRC/Arthritis Research UK Centre for Musculoskeletal Ageing Research, Queen's Medical Centre, School of Life Sciences, University of Nottingham Medical School, Nottingham, United Kingdom
Abstract
Objective
Pulse (PPV) and systolic pressure variation (SPV) quantify variations in arterial pressure related to heart-lung interactions and have been introduced as biomarkers of preload depen-dency to guide fluid treatment in mechanically ventilated patients. However, respiratory intra-thoracic pressure changes during spontaneous breathing are considered too small to affect preload and stroke volume sufficiently for the detection by PPV and/or SPV. This study addressed the effects of paced breathing and/or an external respiratory resistance on PPV and SPV in detecting preload dependency in spontaneously breathing subjects.
Methods
In 10 healthy subjects, hemodynamic and respiratory parameters were evaluated during progressive central hypovolemia (head-up tilt). Breathing conditions were varied by manipu-lating breathing frequency and respiratory resistance. Subjects responding with a reduction in stroke volume index15% were classified as having developed preload dependency. The ability for PPV and SPV to predict preload dependency was expressed by the area under the ROC curve (AUC).
Results
A breathing frequency at 6/min increased the PPV (16±5% vs. 10±3%, p<0.001) and SPV (9±3% vs. 5±2%, p<0.001) which was further enhanced by an expiratory resistance (PPV: 19±3%, p = 0.025 and SPV: 10±2%, p = 0.047). These respiratory modifications, compared to free breathing, enhanced the predictive value of PPV with higher accuracy (AUC: 0.92 vs. 0.46).
a11111
OPEN ACCESS
Citation:Bronzwaer A-SGT, Ouweneel DM, Stok WJ, Westerhof BE, van Lieshout JJ (2015) Arterial Pressure Variation as a Biomarker of Preload Dependency in Spontaneously Breathing Subjects–
A Proof of Principle. PLoS ONE 10(9): e0137364. doi:10.1371/journal.pone.0137364
Editor:Luciano Cesar Pontes Azevedo, Hospital Sirio-Libanes, BRAZIL
Received:May 27, 2015
Accepted:August 15, 2015
Published:September 3, 2015
Copyright:© 2015 Bronzwaer et al. This is an open access article distributed under the terms of the Creative Commons Attribution License, which permits unrestricted use, distribution, and reproduction in any medium, provided the original author and source are credited.
Data Availability Statement:All relevant data are within the paper.
Conclusion
Under conditions of progressive central hypovolemia, the application of an external respira-tory resistance at a breathing frequency of 6/min enhanced PPV and SPV and is worth fur-ther study for detection of preload dependency from arterial pressure variations in non-ventilated subjects.
Introduction
In anesthesiology and intensive care medicine, fluid administration is the cornerstone of treat-ment for hypovolemia but the detection of a clinically relevant blood volume deficit remains dif-ficult [1,2]. Only 40–70% of critically ill patients respond to fluid administration with a
clinically significant increase in stroke volume (SV) and cardiac output (CO) [3]. The substan-tial number of patients not responding to fluid therapy calls for physiological markers capable to predict preload dependency or fluid responsiveness—that is, responding to fluid
administra-tion by increasing SV (and CO) [4,5]. Assessment of preload dependency would enable identifi-cation of those patients who would benefit from volume expansion whereas avoiding fluid overload [5,6]. To this end, variations in arterial pressure, like systolic (SPV) and pulse pressure variation (PPV) have been proposed as biomarkers of central hypovolemia and with that pre-load dependency [3,5,7,8]. These dynamic indices are based on respiration-induced changes in venous return [9,10] and associated variations in left ventricular preload transferred to arterial pressure. Although it has been demonstrated in previous studies that these indices are of clinical value, their application remains limited to patients who are mechanically ventilated with high tidal volumes [7,11–13]. In contrast, in spontaneously breathing critically ill patients, both PPV
and SPV were not accurate in predicting fluid responsiveness by insufficient sensitivity (63% and 47%, respectively) [14]. Similarly, in mechanically ventilated patients with spontaneous breathing movements, PPV does not identify responders to fluid administration [15].
Mechanical ventilation induces considerable cyclic changes in intra-thoracic pressure affect-ing left ventricular preload. In contrast, duraffect-ing spontaneous breathaffect-ing the magnitude of respi-ratory induced preload alterations is considered as being too small and variable between consecutive breaths [16,17] and therefore unable to detect variations in blood pressure and left ventricular SV [14,18].
This study tested the hypothesis that in spontaneously breathing subjects, paced breathing at a set frequency with augmented breathing resistance enhances the magnitude and pre-dictive value of PPV and SPV. We therefore set out to quantify the separate and combined effects of paced breathing and an external respiratory resistance on arterial pressure variations in detecting preload dependency.
Methods
Subjects
Eleven healthy volunteers (4 male), age 25 (22–30) years, height 176 (163–183) cm and weight
68 (52–72) kg, with no history of fainting and/or cardiac arrhythmia and not taking
cardiovas-cular medication participated in this study. The subjects abstained from heavy physical exercise and caffeinated beverages 4 hours prior to the experiment. The study was approved by the Medical Ethics Committee from the Academic Medical Center (Amsterdam, the Netherlands) and written informed consent was obtained prior to the experiment.
Experimental protocol
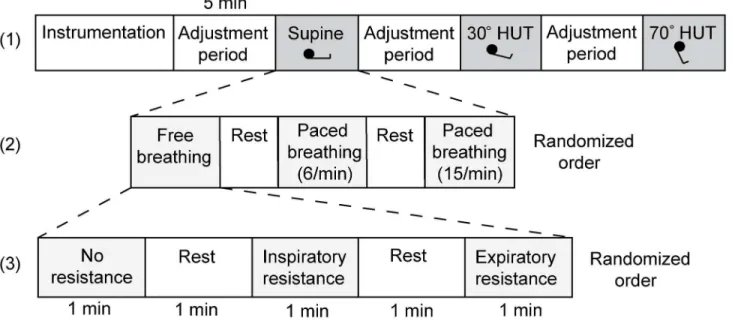
Measurements were performed with subjects positioned on a custom built computer controlled tilt table which minimizes confounding muscle tensing and vestibular stimulation [19]. In healthy humans the horizontal position provides for an 'optimal' central blood volume [20,21] and therefore resting supine measurements represent normovolemic conditions whereas 30° (gravitational load 0.5 G) and 70° (0.9 G) passive head-up tilt (HUT) induces central hypovole-mia [22,23]. Following stepwise elevation of body angle, that body position was maintained for 5 minutes at respectively 30° and 70° to allow for hemodynamic adaptation. For each body position at the end of the stabilization periods, the volunteers performed nine frequency and resistance paradigms of breathing in a randomized order (Fig 1): free breathing, metronome paced breathing at 6/min and at 15/min, each without an external respiratory resistor, with an inspiratory resistor and with an expiratory resistor (7.5 cmH2O threshold resistor; ResqGARD, Advanced Circulatory Systems, Inc., Eden Prairie, MN). The 1 minute breathing periods were alternated with 1 minute of free breathing.
Measurements
Blood pressure (BP) was continuously measured using a non-invasive volume clamp method (Nexfin, Edwards Lifesciences BMEYE, Amsterdam, the Netherlands). Left ventricular SV was estimated by a pulse contour method (Nexfin CO-trek, Edwards Lifesciences BMEYE, Amster-dam, the Netherlands) [24,25] and CO was SV times heart rate (HR). SV index (SVI) was the ratio of SV and body surface area [26]. SPV and PPV were calculated from the BP signal:
100 Amax Amin ðAmaxþAminÞ=2
ð1Þ
with Amax/minequal to, respectively, systolic arterial pressure (SAP) and pulse pressure (PP; SAP minus diastolic arterial pressure (DAP)). PPV and SPV were calculated for each breath and averaged over 5 consecutive breaths.
Airway flow and pressure were measured using an Alveotest flowmeter (Jaeger, Würzburg, Germany), tidal volume (TV) was the integral of airway flow (expressed in mL per kg predicted body weight) and end-tidal CO2(PetCO2) was measured by capnography (Tonocap, Datex-Ohmeda, Madison, USA). Signals were visually inspected for artefacts and 60-second intervals were used for offline analysis (Matlab R2007b, Mathworks Inc. MA, USA).
Statistical analysis
Data were analysed (Sigmaplot 11.0, Systat Software Inc., USA) and presented as mean ± SD. The hemodynamic effects of HUT and different breathing conditions were assessed using One Way Repeated Measures ANOVA with pairwise multiple comparisons (Holm-Sidak). To detect a relative difference20% in PPV and SPV in response to changing breathing condi-tions, a sample size of 10 subjects was required (power 0.9; probability of type I error 0.05; two-sided significance level).
Subjects were assigned to two groups according to the percentage of the reduction in SVI following 30° HUT with reference to the supine value. A 15% increase in response to fluid administration is considered clinically relevant according to previously published data [14,15]. In this study, subjects with a postural reduction in SVI15% following 30° HUT were classified as preload dependent. The ability for PPV and SPV to predict preload dependency was
Hanley and McNeil method [27] and compared using a Z-test. A p-value0.05 was consid-ered to indicate a statistically significant difference.
Results
All subjects completed the protocol. The data from 1 subject was excluded from analysis due to cardiac arrhythmia. As a result 10 subjects entered final analysis. With 30° HUT, 4 out of 10 subjects became preload dependent (ΔSVI15%). Increasing the gravitational load to 70° HUT, 4 other subjects become preload dependent while 2 subjects were still preload indepen-dent (ΔSVI<15%).
Hemodynamic and respiratory response to central hypovolemia
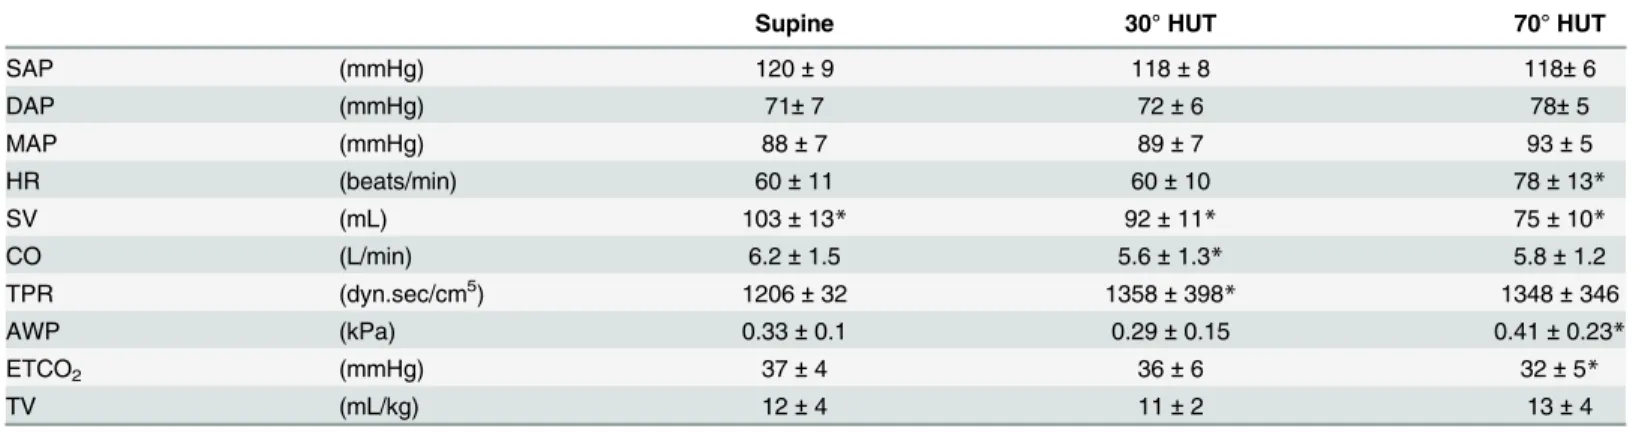
The hemodynamic and respiratory response to graded central hypovolemia during free breath-ing without an external respiratory resistance is given inTable 1. PPV and SPV did not change from the supine position to 30° HUT and only SPV increased from 30 to 70° HUT (95±102%, p = 0.002;Table 2andFig 2A).
Breathing frequency
No change in hemodynamic parameters or airway pressure was observed during paced (6 or 15 breaths/min) vs. free breathing (11±3 breaths/min) when subjects were in the supine position. A paced breathing frequency of 6/min but not 15/min increased tidal volume (20±5 vs. 12±4 mL/kg, p<0.001), PPV (16±5 vs.10±3%, p<0.05) and SPV (9±3 vs. 5±2%, p<0.05;Table 2)
In response to central hypovolemia, 6/min paced breathing increased SPV from supine to 30° HUT (9±3 vs. 11±2% p<0.05). From 30 to 70° HUT, PPV and SPV increased during both 6/min and 15/min paced breathing (PPV: 32±12 vs. 18±5% (p<0.001) and 21±11 vs. 10±2%
Fig 1. Experimental protocol.After instrumentation the measurements started with the subject in the supine position, followed by 30 and 70° head-up tilt with a 5 minute adjustment period in between (layer 1). Each test run encompasses three breathing conditions (layer 2, here only shown for the supine position) with and without an respiratory resistance (layer 3, here only shown for free breathing). The order of the breathing frequency and use of a respiratory resistance was randomized.
(p = 0.001); SPV: 19±6 vs. 11±2% (p<0.05) and 10±4 vs. 6±1% (p<0.001), respectively), see
Fig 2D and 2G.
Respiratory resistance
In the supine position, adding either an inspiratory or expiratory respiratory resistance did not affect hemodynamic parameters or tidal volume whereas an increase was demonstrated in air-way pressure (0.96±0.18 and 0.98±0.23 kPa vs. 0.33±0.16 kPa (p<0.001), respectively) and PPV / SPV (15±4 and 15±5 vs.10±3% (p<0.001) / 8±2 and 8±3 vs. 5±2% (p<0.001), respec-tively;Table 2). The application of either an inspiratory or expiratory resistance did not change PPV and SPV from supine to 30° HUT and only for an inspiratory resistance from 30 to 70° (PPV: 26±11 vs. 17±4%, p = 0.005 and SPV: 15±5 vs. 10±2%, p = 0.001), seeFig 2B and 2C.
Breathing frequency & respiratory resistance
In the supine position, a combination of paced breathing at 6/min together with either an inspi-ratory or expiinspi-ratory resistance further enlarged PPV (20±3 and 19±3 vs. 10±3% (p<0.001), respectively) and SPV (11±3 and 10±2 vs. 5±2% (p<0.001), respectively) compared to free breathing without an external respiratory resistance (Table 2andFig 3). In response to graded central hypovolemia, a 6/min paced breathing frequency together with an expiratory resistance increased PPV and SPV from 0 to 30° and from 30 to 70° HUT (19±3 to 28±4% (p = 0.05) to 45 ±17% (p<0.001) and 10±2 to 17±4% (p = 0.006) to 27±9% (p<0.001), respectively), seeFig 2F.
Adding an inspiratory resistance to a 15/min paced breathing frequency only increased PPV (15±4 vs. 10±3%, p = 0.005) in the supine position with no further discrimination in response to HUT.
Predictive value of arterial pressure variations
Compared to free breathing, manipulating breathing conditions by 6/min paced breathing together with an expiratory resistance resulted in higher AUC values for PPV (0.92±0.09 vs. 0.46±0.24, p = 0.047) with no change for SPV (0.79±0.19 vs. 0.71±0.17, p = 0.74), seeFig 4. With specificity set to 83% (5-out-of-6 subjects), sensitivity increased for PPV from 50% (2-out-of-4 subjects) to 100% (4-out-(2-out-of-4 subjects) and for SPV from 50% (2-out-(2-out-of-4 subjects) to 75%
Table 1. Hemodynamic and respiratory response to head-up tilt.
Supine 30° HUT 70° HUT
SAP (mmHg) 120±9 118±8 118±6
DAP (mmHg) 71±7 72±6 78±5
MAP (mmHg) 88±7 89±7 93±5
HR (beats/min) 60±11 60±10 78±13*
SV (mL) 103±13* 92±11* 75±10*
CO (L/min) 6.2±1.5 5.6±1.3* 5.8±1.2
TPR (dyn.sec/cm5) 1206±32 1358±398
* 1348±346
AWP (kPa) 0.33±0.1 0.29±0.15 0.41±0.23*
ETCO2 (mmHg) 37±4 36±6 32±5*
TV (mL/kg) 12±4 11±2 13±4
Average response during free breathing without an external respiratory resistance. AP, arterial pressure (systolic, diastolic and mean); HR, heart rate; SV, stroke volume; CO, cardiac output; TPR, total peripheral resistance; AWP, airway pressure; ETCO2, end-tidal CO2; TV, tidal volume.
*p<0.05 compared to the previous body position.
(3-out-of-4 subjects). Compared to free breathing, 6/min paced breathing with an expiratory resistance increased corresponding cut-off values for PPV (28% vs. 15%) and SPV (17% vs. 7%).
Discussion
The present study provides insight into arterial pressure variation as biomarker of preload dependency during spontaneous breathing. First, 6/min paced breathing in combination with an external respiratory resistance enhanced the magnitude of PPV and SPV, and thereby improved their discriminative value during progressive central hypovolemia in non-ventilated subjects. Secondly, sensitivity and accuracy of PPV in predicting preload dependency increased.
The current finding that arterial pressure variations, although proven valuable in mechani-cally ventilated patients, are too small in spontaneously breathing subjects to accurately identify preload dependency [7,14,15] conformed to data by Soubrier et al. [14,15] and Heenen et al. [15] We and others suggest that the respiratory induced changes in intra-thoracic pressure are insufficient to initiate significant preload alterations [14], probably related to breath-to-breath variation in duration and tidal volume [16,17]. This is compatible with the observation in mechanically ventilated patients, where small tidal volumes and higher respiratory rates masked a preload dependence condition resulting in a lower predictive value of PPV [13,18,28–30].
The present study showed less breath-to-breath variation and an increased tidal volume as a result of paced breathing at 6/min. Consequently, slow patterned breathing enhanced both PPV and SPV which is in agreement to earlier findings [31]. Breathing against an external respiratory resistance has been proposed to enhance the respiration induced variation in intra-thoracic pressure and venous return [32,33]. We hypothesized that the use of an external respi-ratory resistance could be helpful by initiating a respirespi-ratory perturbation that should be great enough to cause significant preload alterations in order to assess its effect on arterial pressure. This would theoretically be more pronounced under circumstances of central hypovolemia. In pigs a respiratory resistor amplified PPV and SPV in response to bleeding [34] and the present study is the first, to our knowledge, to demonstrate this in spontaneously breathing humans.
Our data supports that during spontaneous breathing, enlarging intra-thoracic pressure is a prerequisite to enhance variations in arterial pressure. Paced breathing in combination with arti-ficially increasing changes in airway pressure may be of benefit as a screening tool to assess vol-ume status in perioperative care. Specifically, volvol-ume status for the postoperative patient is important, given the high incidence of orthostatic intolerance during early mobilization [35,36].
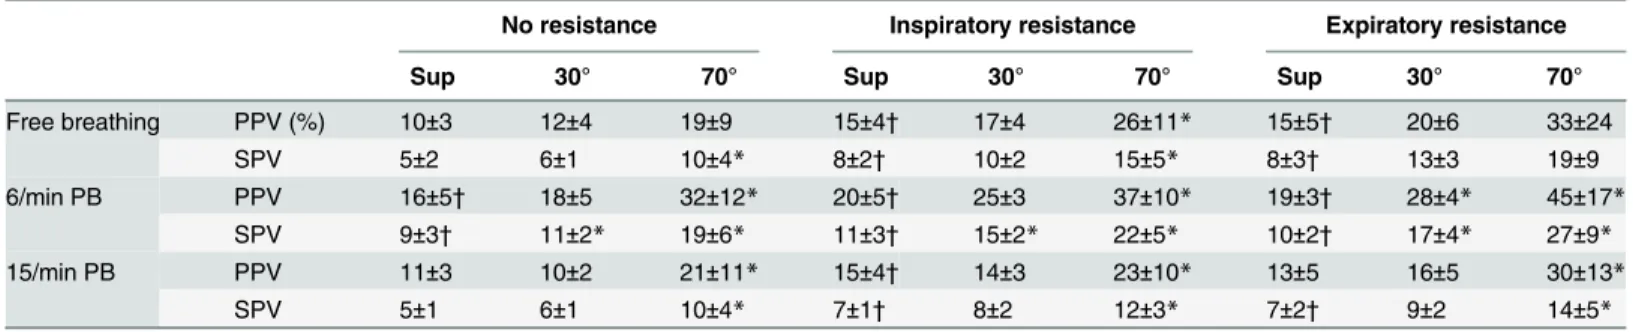
Table 2. Pulse and systolic pressure variation (PPV and SPV) for nine different breathing conditions during the supine position and 30° and 70° head-up tilt.
No resistance Inspiratory resistance Expiratory resistance
Sup 30° 70° Sup 30° 70° Sup 30° 70°
Free breathing PPV (%) 10±3 12±4 19±9 15±4† 17±4 26±11* 15±5† 20±6 33±24
SPV 5±2 6±1 10±4* 8±2† 10±2 15±5* 8±3† 13±3 19±9
6/min PB PPV 16±5† 18±5 32±12* 20±5† 25±3 37±10* 19±3† 28±4* 45±17* SPV 9±3† 11±2* 19±6* 11±3† 15±2* 22±5* 10±2† 17±4* 27±9*
15/min PB PPV 11±3 10±2 21±11* 15±4† 14±3 23±10* 13±5 16±5 30±13*
SPV 5±1 6±1 10±4* 7±1† 8±2 12±3* 7±2† 9±2 14±5*
PB, paced breathing.
*p<0.05 compared to the previous body position. †
p<0.05 compared to free breathing without a resistance in the supine position.
Fig 2. The influence of breathing frequency and respiratory resistance on pulse (PPV) and systolic pressure variation (SPV) during head-up tilt. Black dot/triangle: mean value±SD.*p<0.05 for SPV;†p<0.05 for PPV.
Limitations
Several limitations restrain us from translating the results of this study directly to patient care. First, we studied healthy young adult volunteers rather than patients with compromised car-diovascular function and therefore the results cannot be directly extrapolated to different
Fig 3. Illustration of the effect of 6/min paced breathing against an expiratory resistance for a single recumbent subject.AWF, airway flow; AWP, airway pressure; respCO2, respiratory CO2partial pressure.
patient populations. Second, the implementation of slow patterned breathing might be difficult in dyspnoeic patients or patients with altered mental state. Also, the required respiratory threshold resistance may not be optimal for critically ill subjects, although resistance levels up to 10 cmH2O are well accepted by most patients treated with continuous positive airway pres-sure (CPAP) and during breathing physiotherapy in patients pre- and postoperatively [37]. Third, although the fluctuations in both pulse as well as systolic pressure significantly increased by a combination of slow paced breathing together with an external respiratory resistance, ROC analysis confirmed improvement in discriminative value of PPV only. This is probably due to the limited number of subjects included in this study. Nevertheless, the results serve as a proof of principle and we suggest that this approach in non-ventilated subjects merits further study to evaluate its capacity in detecting hypovolemia in a perioperative setting.
In conclusion, our data confirmed the lack of predictive value of arterial pressure variations in spontaneously breathing subjects and demonstrated that paced breathing at 6/min in combination with an external respiratory resistance enhanced the magnitude and discriminative value of PPV during progressive central hypovolemia. Manipulation of breathing conditions in the assessment of hypovolemia in non-ventilated subjects is worthy of further study in a perioperative setting.
Author Contributions
Conceived and designed the experiments: DMO WJS BEW JJvL. Performed the experiments: DMO WJS. Analyzed the data: AGTB WJS BEW JJvL. Wrote the paper: AGTB JJvL. Manu-script revision: DMO WJS BEW.
Fig 4. ROC curve plots of pulse (PPV) and systolic pressure variation (SPV) during two different breathing conditions.6/min paced breathing against an expiratory resistance significantly increased the area under the ROC curve of PPV (p = 0.047).
References
1. Marik PE, Cavallazzi R, Vasu T, Hirani A. Dynamic changes in arterial waveform derived variables and fluid responsiveness in mechanically ventilated patients: a systematic review of the literature. Crit Care Med. 2009; 37(9): 2642–7. doi:10.1097/CCM.0b013e3181a590daPMID:19602972
2. Secher NH, Van Lieshout JJ. Hypovolemic shock. In: Hahn RG, editor. Clinical Fluid Therapy in the Perioperative Setting. 2 ed: Cambridge University Press; 2011. p. 166–76.
3. Michard F, Teboul JL. Predicting fluid responsiveness in ICU patients: a critical analysis of the evi-dence. Chest. 2002; 121(6): 2000–8. PMID:12065368
4. Monnet X, Teboul JL. Volume responsiveness. CurrOpinCrit Care. 2007; 13(5): 549–53.
5. Michard F, Boussat S, Chemla D, Anguel N, Mercat A, Lecarpentier Y, et al. Relation between respira-tory changes in arterial pulse pressure and fluid responsiveness in septic patients with acute circularespira-tory failure. AmJRespirCritCare Med. 2000; 162(1): 134–8.
6. Shum HP, Lee FM, Chan KC, Yan WW. Interaction between fluid balance and disease severity on patient outcome in the critically ill. Journal of critical care. 2011; 26(6): 613–9. doi:10.1016/j.jcrc.2011. 02.008PMID:21514094
7. Bendjelid K, Romand JA. Fluid responsiveness in mechanically ventilated patients: a review of indices used in intensive care. Intensive Care Med. 2003; 29(3): 352–60. PMID:12536268
8. Preisman S, Kogan S, Berkenstadt H, Perel A. Predicting fluid responsiveness in patients undergoing cardiac surgery: functional haemodynamic parameters including the Respiratory Systolic Variation Test and static preload indicators. Br J Anaesth. 2005; 95(6): 746–55. PMID:16286349
9. Pinsky MR. Heart-lung interactions. CurrOpinCrit Care. 2007; 13(5): 528–31.
10. Moreno AH, Burchell AR, Van der Woude R, Burke JH. Respiratory regulation of splanchnic and sys-temic venous return. Am J Physiol. 1967; 213: 455–65. PMID:6036333
11. Hofer CK, Cannesson M. Monitoring fluid responsiveness. Acta Anaesthesiologica Taiwanica. 2011; 49(2): 59–65. doi:10.1016/j.aat.2011.05.001PMID:21729812
12. Kim HK, Pinsky MR. Effect of tidal volume, sampling duration, and cardiac contractility on pulse pres-sure and stroke volume variation during positive-prespres-sure ventilation. Crit Care Med. 2008; 36(10): 2858–62. doi:10.1097/CCM.0b013e3181865aeaPMID:18766112
13. Lansdorp B, Lemson J, van Putten MJ, de KA, van der Hoeven JG, Pickkers P. Dynamic indices do not predict volume responsiveness in routine clinical practice. BrJ Anaesth. 2011.
14. Soubrier S, Saulnier F, Hubert H, Delour P, Lenci H, Onimus T, et al. Can dynamic indicators help the prediction of fluid responsiveness in spontaneously breathing critically ill patients? Intensive Care Med. 2007; 33(7): 1117–24. PMID:17508201
15. Heenen S, De BD, Vincent JL. How can the response to volume expansion in patients with spontane-ous respiratory movements be predicted? Crit Care. 2006; 10(4): R102. PMID:16846530
16. Priban IP. An analysis of some short-term patterns of breathing in man at rest. J Physiol. 1963; 166: 425–34. PMID:13986111
17. Lenfant C. Time-dependent variations of pulmonary gas exchange in normal man at rest. J Appl Phy-siol. 1967; 22(4): 675–84. PMID:6023180
18. De Backer D, Heenen S, Piagnerelli M, Koch M, Vincent JL. Pulse pressure variations to predict fluid responsiveness: influence of tidal volume. Intensive Care Med. 2005; 31(4): 517–23. PMID:15754196
19. Gisolf J, Akkerman EM, Schreurs AW, Strackee J, Stok WJ, Karemaker JM. Tilt table design for rapid and sinusoidal posture change with minimal vestibular stimulation. AviatSpace EnvironMed. 2004; 75 (12): 1086–91.
20. Harms MPM, van Liesthout JJ, Jenstrup M, Pott F, Secher NH. Postural effects on cardiac output and mixed venous oxygen saturation in humans. Experimental Physiology. 2003; 88(5): 611–6. PMID:12955161
21. van Lieshout JJ, Harms MP, Pott F, Jenstrup M, Secher NH. Stroke volume of the heart and thoracic fluid content during head-up and head-down tilt in humans. Acta Anaesthesiol Scand. 2005; 49(9): 1287–92. PMID:16146465
22. Matzen S, Perko G, Groth S, Friedman DB, Secher NH. Blood volume distribution during head-up tilt induced central hypovolaemia in man. Clin Physiol. 1991; 11: 411–22. PMID:1934937
23. Bronzwaer AS, Stok WJ, Westerhof BE, van Lieshout JJ. Arterial pressure variations as parameters of brain perfusion in response to central blood volume depletion and repletion. Front Physiol. 2014; 5: 157. doi:10.3389/fphys.2014.00157PMID:24795652
25. Bartels SA, Stok WJ, Bezemer R, Boksem RJ, van Goudoever J, Cherpanath TG, et al. Noninvasive cardiac output monitoring during exercise testing: Nexfin pulse contour analysis compared to an inert gas rebreathing method and respired gas analysis. J Clin Monit Comput. 2011; 25(5): 315–21. doi:10. 1007/s10877-011-9310-4PMID:22002638
26. Dubois B, DuBois EF. A formula to estimate the approximate surface area if height and weight be known. Arch Intern Med. 1916; 17: 863–71.
27. Hanley JA, McNeil BJ. The meaning and use of the area under a receiver operating characteristic (ROC) curve. Radiology. 1982; 143(1): 29–36. PMID:7063747
28. Muller L, Louart G, Bousquet PJ, Candela D, Zoric L, de La Coussaye JE, et al. The influence of the air-way driving pressure on pulsed pressure variation as a predictor of fluid responsiveness. Intensive Care Med. 2010; 36(3): 496–503. doi:10.1007/s00134-009-1686-yPMID:19847400
29. De Backer D, Taccone FS, Holsten R, Ibrahimi F, Vincent JL. Influence of respiratory rate on stroke vol-ume variation in mechanically ventilated patients. Anesthesiology. 2009; 110(5): 1092–7. doi:10.1097/ ALN.0b013e31819db2a1PMID:19352152
30. Vallee F, Richard JC, Mari A, Gallas T, Arsac E, Verlaan PS, et al. Pulse pressure variations adjusted by alveolar driving pressure to assess fluid responsiveness. Intensive Care Med. 2009; 35(6): 1004–
10. doi:10.1007/s00134-009-1478-4PMID:19347330
31. Zollei E, Bertalan V, Nemeth A, Csabi P, Laszlo I, Kaszaki J, et al. Non-invasive detection of hypovole-mia or fluid responsiveness in spontaneously breathing subjects. BMC anesthesiology. 2013; 13(1): 40. doi:10.1186/1471-2253-13-40PMID:24188480
32. Convertino VA, Ryan KL, Rickards CA, Cooke WH, Idris AH, Metzger A, et al. Inspiratory resistance maintains arterial pressure during central hypovolemia: implications for treatment of patients with severe hemorrhage. Crit Care Med. 2007; 35(4): 1145–52. PMID:17334239
33. Idris AH, Convertino VA, Ratliff DA, Doerr DF, Lurie KG, Gabrielli A, et al. Imposed power of breathing associated with use of an impedance threshold device. Respiratory care. 2007; 52(2): 177–83. PMID:
17261206
34. Dahl MK, Vistisen ST, Koefoed-Nielsen J, Larsson A. Using an expiratory resistor, arterial pulse pres-sure variations predict fluid responsiveness during spontaneous breathing: an experimental porcine study. Crit Care. 2009; 13(2): R39. doi:10.1186/cc7760PMID:19302700
35. Bundgaard-Nielsen M, Jorgensen CC, Jorgensen TB, Ruhnau B, Secher NH, Kehlet H. Orthostatic intolerance and the cardiovascular response to early postoperative mobilization. Br J Anaesth. 2009. 36. Jans O, Bundgaard-Nielsen M, Solgaard S, Johansson PI, Kehlet H. Orthostatic intolerance during
early mobilization after fast-track hip arthroplasty. BrJ Anaesth. 2012; 108(3): 436–43.