DoI: 10.2298/avb1306631o UDK: 543.42+1d(062.536):001.891.55
tHe sPectral analysis of motion – an „oPen field“ activity test eXamPle
OBRADOVIĆ Z*, PANTOVIĆ SUZANA*, ILIĆ V***, JORGOVANOVIĆ N***, ČOLIĆ MAJA*, GAJOVIĆ OLGICA*,**** STOJANOVIĆ JELICA***** and ROSIĆm*,**
*University of Kragujevac, Faculty of Medical Sciences, Kragujevac, Serbia;
**Research Center of Serbian Academy of Arts and Sciences and the University of Kragujevac, Kragujevac, Serbia;
***University of Novi Sad, Faculty of Technical Sciences, Novi Sad, Serbia; ****Division of Infective Medicine, Medical Centre of Kragujevac, Kragujevac, Serbia;
*****University of Kragujevac, Faculty of Natural Science and Mathematics, Kragujevac, Serbia
(Received 2nd may 2013)
In this work we have described the new mathematical approach, with spectral analysis of the data to evaluate position and motion in
the „„open ield““ experiments. The aim of this work is to introduce
several new parameters mathematically derived from experimental data by means of spectral analysis, and to quantitatively estimate the quality of the motion. Two original software packages (TRACKER and
POSTPROC) were used for transforming a video data to a log ile,
suitable for further computational analysis, and to perform analysis
from the log ile. As an example, results obtained from the experiments with Wistar rats in the „„open ield““ test are included.The test group of animals was treated with diazepam. Our results demonstrate that all the calculated parameters, such as movement variability, acceleration and
deceleration, were signiicantly lower in the test group compared to the control group. We believe that the application of parameters obtained by spectral analysis could be of great signiicance in assessing the
locomotion impairment in any kind of motion.
Key words: motion variability, „open ield“, spectral analysis,
speed variability
INTRoDUCTIoN
and deceleration. These parameters were not assessed until now, in behavioral experiments in animal experimental models.
The „open ield“ activity test (Giulian and Silverman 1975; Ericson et al., 1991; Koob et al., 2006) is the experimental design that is most frequently used in behavioral investigations in the animal experimental model. It represents a valid measure of both the basal locomotion and exploration activity in drug-treated, surgically, genetically or otherwise manipulated investigated subjects. The most commonly used systems for obtaining data and the data analysis in „„open ield““ tests are based on two main approaches: the IR beam-based(Koob et al., 2006) and the video ile-based systems (Lind et al., 2005; Obradović et al., 2009).
The validity and the accuracy of the results obtained in these kinds of investigations depend on the tools capable sensitive tracking, recording and analysis of the events in the experiments. In our previous work(Obradović et al., 2009) we described a new video ile-based experimental model for the behavioral investigations in animal studies. This model does not depend on speciic light and arena color conditions; neither has limitation in the experimental time duration. It also allows sequential and retrospective analysis of the motion of investigated subjects on the retroactively applied virtual grid.
This video ile-based experimental model is created by means of our two originally developed software packages named TRaCKeR and poST pRoC. The TRACKER produces the log ile from the captured video format containing comma separated values of: time, speed and estimated subject position. The poSTpRoC is applied to analyze the log iles obtained from TRACKER, and automatically calculates the following parameters: (1) average speed (va) in m/s, (2) maximal speed (vmax) in m/s, (3) total distance traveled by the animal, (S) in meters, (4) duration of the motion (Dm) in hours, (5) duration of the stillness (Ds) in hours.
all previously mentioned experimental data obtained by poSTpRoC, as well as their derived parameters, quantitatively describe the motion. However, the quality of this motion, such as the variability and the acceleration has not yet been described. Therefore, in the mathematical analysis of the motion we included the spectral analysis of motion and several parameters that could quantitatively estimate the quality of motion.
Spectral analysis is the method of decomposition of the time-changing signal to harmonic components at different frequencies. every frequency in the spectrum represents a particular variation rate of the signal in the time domain.
maTeRIal aND meTHoDS
In all described experiments the investigated subjects were 3-month-old Wistar rats of both sexes (n=20, weighted 200-300 gr.), divided in the control group (n=10), and the test group (n=10) The test group was treated with diazepam (bensedin®, galenika a.D., beograd, Serbia), 2 mg/kg of body weight, ip., 10 minutes before being placed in the arena. The control group was given saline in exactly the same manner as the test group was treated. Diazepam was used only to induce the locomotor impairment in the test group. 12h-12h dark-light conditions were achieved in the experiment. all experiments were performed according to the ethical standards recommended by eU (86/609/eeC) and local ethical Committee.
The arena used in this work was the „„open ield““ 50x70x30 cm. The camera was placed 230 cm above the arena. The rats were placed in a corner of the „„open ield““ and allowed to move freely.
The video format of the experiment was captured using the following equipment:
1. Standard or IR camera connected to a standard pC computer with 1 gHz CpU and 256mb of Ram memory.
2. pCI Tv tuner card with philips bt878 chipset for capturing the video input. 3. operating system Windows Xp.
4. Software DSCaleR for video recording (open source software, freely available for downloading at the address: http://deinterlace.sourceforge.net/.)
The software TRACKER was used to produce the log ile from the captured video format.
The software POSTPROC was applied to analyze the log iles obtained from the TRaCKeR and to calculate automatically the following parameters: The average speed (va) in m/s, the maximal speed (vmax) in m/s, total distance traveled by the animal, (S) in meters, duration of the motion (Dm) in hours, duration of stillness (Ds) in hours. In addition, poSTpRoC was used to automatically create the virtual grid, to determine the center and the periphery of the arena and to calculate the time spent in the center of the „open ield“ (Tc in seconds) and time spent at the periphery of the arena (Tp in seconds). Using experimental data (Tc, Tp, Dm, Ds) obtained by poSTpRoC, we were able to calculate two (derived) parameters we named the motion distribution (md) and the module of activity (am) by dividing adequate data as shown by the following equations:
Md =Tc / Tp. (Eq 1)
where Tc is the time that the investigated subject spent in the center of „open ield“, and Tp is the time spent on the periphery of the „open ield“.
Am = Dm / Ds (Eq 2)
for the purpose of describing the quality of motion we introduced spectral analysis of motion and parameters that are obtained by this method. as these quality describing parameters were not used in any previous work, we could not compare them with other results. The only way that we could estimate their liability is that they completely corresponded with the parameters obtained from ilming the experiment and were calculated by computer in poSTpRoC.
The spectral analysis was performed using fourier transformation (Hubbard 1973; Hui et al., 1996; Chirikjian and Wang 2003; bhaduri et al., 2010) over the signal (in this study it was the speed) in the time domain. fourier transformation of the signal was given by the expression (eq 3):
(eq 3)
where x (t) is signal, and X (f) is the spectrum of the signal x (t).
The energy of the signal components between the frequencies f1 and f2 could be calculated using the equation (eq 4):
(eq 4)
where X (f) is spectrum of the signal x (t).
The median frequency (f median) represents the frequency that divide the area under the curve of the amplitude spectrum density to two equal parts, and it can be calculated by the equation (eq 5):
(eq 5)
where X (f) is the spectrum of the signal x (t).
The median frequency corresponds to the ratio of the energy contained in the high frequency components versus the energy contained in the low frequency components. The median frequency increase when the energy of the high speed components also increase, compared to the entire signal energy. Spectral analysis of the experimental data allowed us the possibility to calculate following parameters: mv (Index of movement variability), Dm (Dynamics of movement), Sv (Index of Speed variability), av (Index of acceleration variability) and Dv (Index of Deceleration variability).
(eq 6)
where Ψv is the number of the speed changes, and t is the time duration of the experiment.
parameter Dm was chosen to represent the total dynamic of the movement that was proportional to the total kinetic energy of the subject during the experiment. This parameter could be calculated according to the expression (eq 7):
(eq 7)
where v(f) is the spectrum of the subject’s speed and fmax is the width of the spectrum v(f).
another very important aspect of movement is the acceleration and the deceleration. We described these with parameters such as: Sv, av and Dv. We suggested that the median frequency of the acceleration/deceleration spectrum represented Sv.
either the acceleration or the deceleration, a (t) can be easily calculated from the speed v (t) according to the equation (eq 8):
(eq 8)
The negative values of a (t) represent the deceleration and the positive values are considered as the acceleration.
parameter Sv corresponds to the ratio of the energy contained in the high frequency components versus the energy contained in the low frequency components and it could be calculated as the median frequency of the acceleration/ deceleration’s amplitude spectrum density as deined in the equation (Eq. 9).
(eq 9)
where a (f) represents the spectrum of the subject’s acceleration.
The av parameter represents the ratio of the high and the low frequency variations of the positive part of the acceleration/deceleration-time relation, and the Dv parameter represents the ratio of the high and the low frequency variations of the negative part of the acceleration/deceleration-time relation.
(eq 10)
(eq 11)
both the av and the Dv can be calculated from the following equation:
(eq 12)
(eq 13)
where a+(f) is the spectrum of the subject’s acceleration, and a-(f) is the spectrum of the subject’s deceleration.
Statistical analysis of data were performed using t-test where p<0.05 was considered as statistically signiicant. All data were analyzed using program SPSS 13.0.
ReSUlTS
As we stated before, POSTPROC is applied to analyze the log iles obtained from TRaCKeR, and automatically calculates the following parameters:
(1) The average speed (va) in m/s, (2) The maximal speed (vmax) in m/s,
(3) The total distance travelled by the animal, (S) in meters, (4) The duration of the motion (Dm) in hours,
(5) The duration of the stillness (Ds) in hours.
These parameters were obtained automatically by ilming the actual event during the experiment and thus can be treated as data obtained from watching and measuring the actual motion of the test and control group of animals. In Table1 the values of these parameters are shown in order to support the claim of locomotion impairment of the test group during the experiment.
To calculate the parameters including mv, Dm, Sv, av and Dv that could allow us to quantitatively estimate the quality of motion of both the control and the test groups of rats, we took the Sv advantage of applying the spectral analysis.
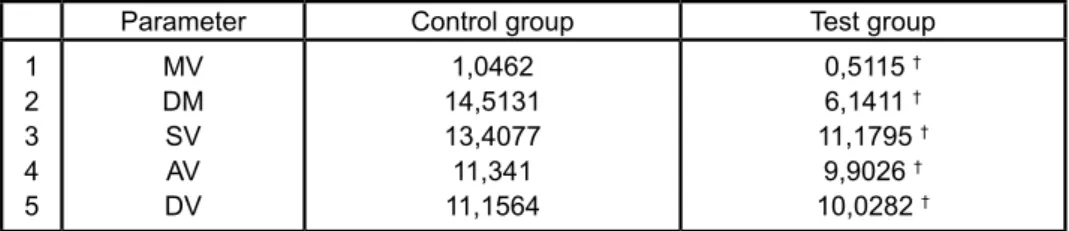
The derived parameters, obtained from spectral analysis are shown in the Table 2. our results demonstrate that all the calculated parameters were signiicantly lower in the test group compared to the control group.
parameter mv represented the motion variability, or more directly the number of the speed changes during the test time. as shown in Table 2, this parameter was nearly 50% lower in the test group compared to the control group. This result indicates that the investigated subjects that were under the inluence of the test drug were 50% less likely to change the speed of the motion.
parameter Dm represented the total dynamic of the movement and it was proportional to the total kinetic energy of the subject during the experiment. from the results shown in Table 2, it was evident that the test group spent less than 50% of the kinetic energy in comparison to the control group.
The acceleration and the deceleration were described by the parameters av and Dv, respectively and Sv. The median frequency of the acceleration/ deceleration spectrum represented Sv.
The av parameter represented the ratio of the high and low frequency variations of the positive part of the acceleration/deceleration-time relation, and
parameter Control group Test group
1 2 3 4 5 va vmax S Dm Ds 2,3877 3,3467 2446 0,2845 23,7155
0,3523 †
1,2235 †
221 †
0,1742 †
23,8258 †
*va (the average speed in m/s), vmax (the maximal speed in m/s), S (the total distance traveled by animal, in meters), Dm (the duration of the motion in hours), Ds (the duration of the stillness in hours).
† all results are analyzed after determination of normality of distribution with t – test where P value of
<0.05 was considered statistically signiicant.
Table 1. values of parameters* obtained automatically by poSTpRoC for the control and the test group
*mv (Index of movement variability), Dm (Dynamics of movement), Sv (Index of Speed variability), av (Index of acceleration variability), Dv (Index of Deceleration variability).
†all results are analyzed after determination of normality of distribution with t – test where P value of
<0.05 was considered statistically signiicant.
parameter Control group Test group
1 2 3 4 5 mv Dm Sv av Dv 1,0462 14,5131 13,4077 11,341 11,1564
0,5115 †
6,1411 †
11,1795 †
9,9026 †
10,0282 †
the Dv represented the ratio of the high and low frequency variations of the negative part of the acceleration/deceleration-time relation. as shown in Table 2, the test group had lower accelerations as well as the decelerations.
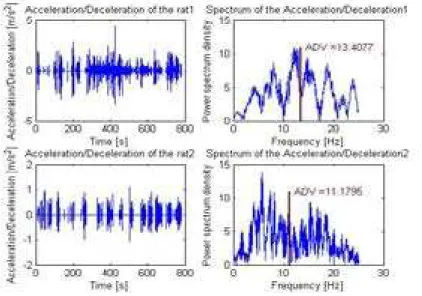
examples of spectral analysis of the motion from the experiments performed in this work are presented in figure 1 and figure 2.
on the left side of fig. 1, the speed-time relation obtained by poSTpRoC for the control rat 1 and the test rat 2 are presented. The mv parameter was calculated from this relation using equation 6 (eq 6). The maximum speed of rat 1 was 4.81 m/s, and the maximum speed of rat 2 was 1.72 m/s. The average speed calculated by poSTpRoC, for rat 1 was 0.81 m/s, and for rat 2 it was 0.32 m/s. on the right side of fig. 1, spectral analysis of the motion for rat 1 (control) and rat 2 (test) was presented. The Dm parameter was calculated from this relation as the area under the curve by means of (eq 7).
furthermore the acceleration/deceleration-time relation, av and Dv, obtained by (eq 8) for rat 1 (control) and rat 2 (test) was shown. The positive values on the left side of fig. 2 represent the acceleration and the negative values represent the deceleration relation. The Sv parameter shown on the right side of figure 1. The speed and the spectral analysis of the speed, in one control and one test
animal.
a: The speed-time relation obtained by poSTpRoC for rat 1 (control) and rat 2 (test) – mv parameter was calculated from this relation using eq 6.
fig. 2 was calculated from (eq 9) as the median frequency of spectral analysis of acceleration/deceleration for rat 1 (control) and rat 2 (test).
DISCUSSIoN
Spectral analysis has been used in medical investigations for the calculation of parameters in various medical procedures, such as eCg and emg (golden et al., 1973; Riggs et al., 1979; lolov 1985; lolov and lolov 1985; Sesay et al., 2003; Cardozo et al., 2004; liou et al., 2011). Our study, for the irst time, demonstrated that spectral analyses, could be applied to investigate locomotion.
The irst parameter that we introduced in this work was MV. This parameter represents the number of speed changes in the function of time and quantitatively describes the motion variability. Some drugs may affect only the motion variability even if the two investigated subjects may have similar both the average and the maximal speed at the same time frame of the experiment. However if one of the subjects changes movement speed more frequently than the other, it is obvious figure 2. The acceleration/deceleration relation expressed as av, Dv and Sv, and their
spectral analysis, in one control and one test animal.
a: The acceleration/deceleration-time relation obtained by (eq 8) for rat 1 (control) and rat 2 (test). The positive values represent the acceleration and negative values represent deceleration.
that its MV parameter would be signiicantly higher in comparison to the other subject. Therefore, this fact makes the MV parameter highly signiicant for the investigation of the motion activity of the subjects.
The Dm parameter (the total movement dynamics or the total kinetic energy of movement) is proportional to the distance covered by motion for the same time duration. In addition, this parameter is proportional to the average speed (va) for the same distance covered by the motion. The main advantage and the main purpose of introducing the Dm parameter is the possibility to demonstrate its changes in time. Therefore, by determination of the Dm parameter, we can estimate not only movement dynamics, but also the chronology of this event.
The other important characteristics of motion are the acceleration and the deceleration. In our study we described these variables trough Sv, av and Dv. our results showed that the subjects from the control group had longer periods of both the acceleration and the deceleration. Thus, these results suggest that the motion of the subjects from the control group was “smooth”, without sudden changes either in speed or direction. on the other hand, our results indicate that the subjects from the test group displayed abrupt changes in both in the speed and direction of the movement. The parameter mv together with Sv, av and Dv, described the motion of the subjects in the test group as the motion with few changes of speed. If these changes occurred, they happened suddenly. The speed in these subjects was mostly constant (nevertheless slower) with short periods of acceleration and deceleration. This kind of motion indicated that the mechanisms that control the locomotion of the subjects seem to be impaired.
In the test group treated with diazepam, all mathematical parameters obtained by means of spectral analysis, are signiicantly lower conirming locomotion impairment in this group of animals. a previous study (Segrt et al., 2009) investigated spontaneous motor activity (Sma) of experimental animals using the Sma test. Sma test did not quantitatively estimate the quality of motion by mathematical parameters and the activity was evaluated discontinuously (180 seconds in every 30 minutes) (Segrt et al., 2009). The advantage of our method is the continuous monitoring of the movement without time limitation and precise, mathematical quantiication of the parameters of the quality of motion.
The described spectral analysis could be applied to analyze any kind of movement, not only the whole body movement, but the simple movements of one body part. for instance, the simple movement of one limb could be analyzed in order to estimate the velocity of the movements, its variability and precision.
by using these parameters we can analyze either the whole body movement or one limb movement. also we could improve the detection of the initial motor impairment. finally, since these parameters are quantitative, the symptoms could be classiied according to their intensity.
Conclusion
The spectral analysis of motion during the „open ield“ activity test allows us the estimation of the dynamics and variability of motion, speed variability, as well as the acceleration and/or the deceleration variability.
In the test group of animals, all mathematical parameters obtained by means of spectral analysis, were signiicantly lower conirming locomotion impairment in this group of animals.
The mathematical parameters obtain by the spectral analysis could be applied to analyze various kinds of motion (from the whole body movement to simple one limb movement), which has not only scientiic but possible clinical importance, as well.
aCKNoWleDgemeNTS:
The part of this research is supported by ministry of Science in Serbia, grants III41007, oN174028.
address for correspondence: mirko Rosic, phD
Department of physiology
faculty of medical Sciences, University of Kragujevac Svetozara markovica 69
34000 Kragujevac, Serbia e-mail: [email protected]
RefeReNCeS
1. Bhaduri B, Tay CJ, Quan C,Sheppard CJR, 2010, motion detection using extended fractional fourier transform and digital speckle photography, Opt Exp, 18, 11, 11396-11405, http:// dx.doi.org/10.1364/oe.18.011396
2. Cardozo AC, Gonçalves M and Gauglitz ACF, 2004, Spectral analysis of the electromyograph of the erector spinae muscle before and after a dynamic manual load-lifting test, Braz J Med Biol Res, 37, 7, 1081-5.
3. Chirikjian GS, Wang Y, 2003, engineering applications of the motion-group fourier Transform, Mod Sign Process MSRI Publ, 46, 63-77.
4. Ericson E, Samuelsson J, Ahlenius S, 1991, photocell measurements of rat motor activity: a contribution to sensitivity and variation in behavioral observations, J Pharmacol Meth, 25, 111-22.
5. Giulian D, Silverman G, 1975, Solid-state animal detection system: its application to »open ield« activity and freezing behavior, Physiol Behav, 14, 109-12.
6. Golden DP, Wolthuis RA, Hofler GW, 1973, a spectral analysis of the normal resting electrocardiogram, IEEE Transac Biomed Engin, 20, 5, 366-72.
8. Hubbard PS, 1973, Rotational brownian motion. II. fourier Transforms for a Spherical body with Strong Interactions, Phys Rev, A, 8, 3, 1429-36.
9. Liou JM, Huang CM, Chiu CC, Wang HS, Liao YT, Peng YC et al. 2011, Differences in pulse Spectrum analysis between atopic Dermatitis and Nonatopic Healthy Children, J Alt Compl Med, 17, 4, 325-8, doi:10.1089/acm.2010.0101.
10. Koob AO, Cirillo J, Babbs CF, 2006, A novel »open ield« activity detector to determine spatial and temporal movement of laboratory animals after injury and disease, J Neurosc Meth, 157, 330-6.
11. Lind NM, Vinther M, Hemmingsen RP, Hansen AK, 2005, validation of a digital video tracking system for recording pig locomotor behavior, J Neurosci Methods, 143, 123-32.
12. Lolov R, 1985, Spatial magnitude of the normal QRS-complex in the electrocardiogram of rabbits. velocity and acceleration of the spatial magnitude, Acta Physiol Pharmacol Bulg, 11, 3, 23-30. 13. Lolov VR, Lolov RV, 1985, Spectral analysis of the normal electrocardiogram of rabbits, Basic Res
Cardiol, 80, 4, 353-6.
14. Obradovic Z, Pantovic S, Rosic G, Selakovic Z, Rosic M, 2009, The new experimental model for behavioral investigations in animal studies, Gen Physiol Biophys (Special issue), 28, 77-86. 15. Riggs T, Isenstein B, Thomas C, 1979, Spectral analysis of the normal electrocardiogram in
children and adults, J Electrocard, 12, 4, 377-9.
16. Segrt Z, Djordjevic S, Jacevic V, Kilibarda V, Vucinic S, Jovic-Stosic J et al., 2009, pharmacodynamic and pharmacokinetic effects of lumazenil and theophylline application in rats acutely intoxicated by diazepam, Vojnosan Pregl, 66, 2, 141-8.
17. Sesay M, Vignes JR, Stöckle M, Mehsen M, Boulard G, Maurette P, 2003, Spectral analysis of the eCg R-R interval permits early detection of vagal responses to neurosurgical stimuli, Ann Fr Anesth Reanim, 22, 5, 421-4.
SPEKTRALNA ANALIZA KRETANJA – PRIMER “„open ield“” TESTA
OBRADOVIĆ Z, PANTOVIĆ SUZANA, ILIĆ V, JORGOVANOVIĆ N, ČOLIĆ MAJA,
GAJOVIĆ OLGICA, STOJANOVIĆ JELICA i ROSIĆm
SADRŽAJ