F. Berto et alii, Frattura ed Integrità Strutturale, 33 (2015) 229-237; DOI: 10.3221/IGF-ESIS.33.29
229
Focussed on multiaxial fatigue
Multiaxial fatigue strength of severely notched
titanium grade 5 alloy
F. Berto, A. Campagnolo
University of Padua, Italy
[email protected], [email protected]
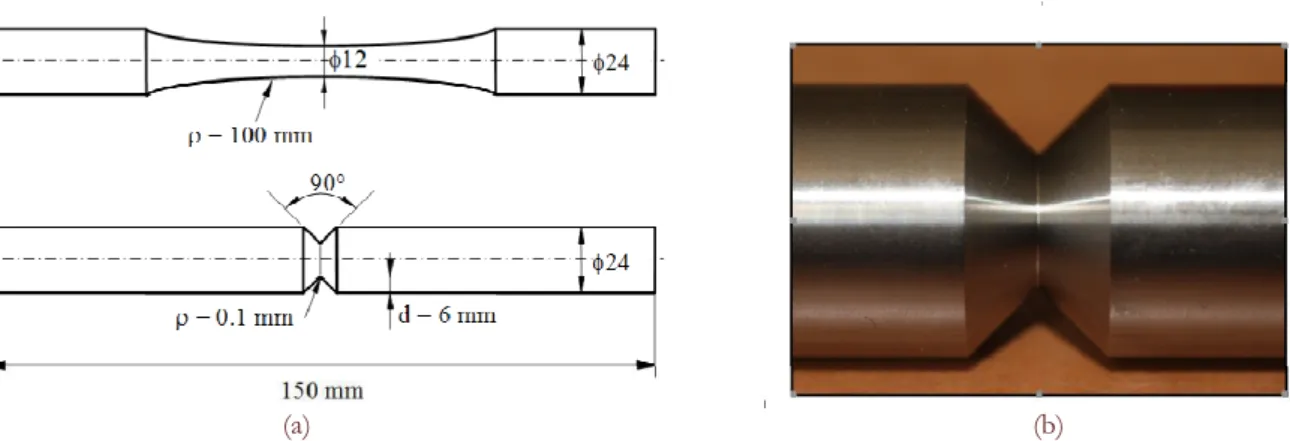
ABSTRACT. The multiaxial fatigue strength of severely notched titanium grade 5 alloy (Ti-6Al-4V) is investigated. Experimental tests under combined tension and torsion loading, both in-phase and out-of-phase, have been carried out on axisymmetric V-notched specimens considering different nominal load ratios (R = -1, 0). All specimens are characterized by a notch tip radius less than 0.1 mm, a notch depth of 6 mm and a notch opening angle equal to 90 degrees. The experimental data from multiaxial tests are compared with those from pure tension and pure torsion tests on un-notched and notched specimens, carried out at load ratio ranging from R = -3 to R = 0.5.
In total, more than 160 new fatigue data are examined, first in terms of nominal stress amplitudes referred to the net area and then in terms of the local strain energy density averaged over a control volume surrounding the V-notch tip. The dependence of the control radius on the loading mode is analysed showing a very different notch sensitivity for tension and torsion. For the titanium alloy Ti-6Al-4V, the control volume is found to be strongly dependent on the loading mode.
KEYWORDS. Titanium alloy; Ti-6Al-4V; Multiaxial fatigue; V-notch; Control volume; Strain Energy Density.
INTRODUCTION
ultiaxial fatigue of metallic materials is a topic of active research. For a comparison between different criteria we mention here a recent overview [1] and the report [2] based on a large body of experimental data from notched specimens. A central position is occupied by the critical plane approach [3, 4] and by some interesting variants [5-7].
In this ambit, energy-based criteria find important applications [8]. Recently it has been proposed a multiaxial fatigue criterion based on a frequency-domain formulation of a stress invariant, called “Projection by Projection” (PbP) approach [9]. A frequency-domain formulation of the critical plane-based C-S criterion has recently been presented in [10]. In 1923 Jasper [11] first used an energy-based parameter to analyse fatigue strength under tension–compression loadings. Afterwards dealing with multiaxial fatigue loading Ellyinproposed an approach based on the combination of both the plastic and elastic strain work [12-13]. A wide review of energy-based multiaxial fatigue life formulations was carried out in [14]. Theoretical and experimental problems tied to multiaxial fatigue were discussed by several researchers [15-22]. The present work deals with multiaxial fatigue strength of severely notched titanium grade 5 alloy (Ti-6Al-4V). This titanium alloy is widely used for advanced military, civil aerospace and naval applications. The in-service conditions are usually characterized by a complex stress state combined with aggressive environments. The Ti-6Al-4V titanium alloy has
F. Berto et alii, Frattura ed Integrità Strutturale, 33 (2015) 229-237; DOI: 10.3221/IGF-ESIS.33.29
230
very good static and fatigue properties, an high strength-to-mass ratio, with an excellent wear resistance, also at high temperature and in corrosive environments. The uniaxial fatigue resistance of smooth and notched specimens made of Ti-6Al-4V has been extensively investigated in the recent literature. A complete set of data from sharply V-notched specimens under torsion and combined tension and torsion loadings, both in-phase and out-of-phase, is not available in the literature for Ti-6Al-4V. With the aim to fill this lack, a complete set of experimental data from a severely notched titanium alloy under multiaxial loading is provided.
Circumferentially V-notched specimens are tested under combined tension and torsion loading, both in-phase and out-of-phase, with two nominal load ratios, R = -1 and R = 0. All axisymmetric specimens are characterized by a notch tip radius less than 0.1 mm, a notch depth of 6 mm and a V-notch angle equal to 90 degrees. The experimental data from multiaxial tests are discussed together with those from pure tension and pure torsion tests on un-notched and notched specimens, carried out at a load ratio ranging from R = -3 to R = 0.5.
Altogether more than 160 new fatigue data (15 Wöhler curves) are analyzed in terms of nominal stress amplitudes referred to the net area. The application of a multiaxial loading reduces the fatigue life compared to the pure tension loading case, with reference to the same normal stress amplitude, but the reduction results to be quite limited for the specific value of the biaxiality ratio (= 0.6). Stronger is the reduction of the multiaxial fatigue strength due to the nominal load ratio R. The phase angle effect is found to be weak for R = -1, being the mean values of the normal stress amplitude about the same at 2·106 cycles. More clear is the effect of the phase angle when R = 0: the out-of-phase loading is slightly beneficial with respect to in-phase loading at high cycle fatigue regime whereas the fatigue strength is almost the same at low cycle regime. The sensitivity of this titanium alloy under multiaxial fatigue loading to the phase angle effect results to be quite limited, being lower than +15 percent for the R = 0 case and negligible for the R = -1 case.
The fracture surfaces of the specimens tested under multiaxial conditions have been analyzed. The fracture surface morphology seem to be affected by the phase angle. Some signs of micro abrasions could be observed on all fracture surfaces and the extent to which the rubbing occurred depends on phase angle. Generally, a limited but distinguishable quantity of debris and powder was emanated from the notch tip when a visible crack started to propagate.
Afterwards, all fatigue strength data are summarized in terms of the local strain energy density (SED) averaged over a material-dependent control volume surrounding the V-notch tip [23-30]. The dependence of the control volume size on the loading mode is investigated showing the need to use for the titanium alloy Ti-6Al-4V a different size of the control volume under tension and under torsion, due to a very different notch sensitivity for tension and torsion. The expressions for estimating the control radii, thought of as material properties, are obtained imposing at 2·106 cycles the constancy of the SED from smooth and V-notched specimens, which depends on the notch stress intensity factors and the radius of the control volume.
In particular, a control volume of radius R1c are used to evaluate the averaged contribution to local stress and strains due to tensile loading, whereas a radius R3c are used to assess the averaged contribution due to torsion loading. The control radii result to be R1c = 0.051 mm and R3c = 0.837 mm. The size of R3c radius is highly influenced by the presence of larger plasticity under torsion loading with respect to tensile loading and by friction and rubbing between the crack surfaces, as discussed extensively for different materials [31]. The SED is called ‘apparent linear elastic SED’ to remember that the evaluation of the strain energy in two different volumes (for tension and torsion, as determined from experimental data) allows us to overcome the problem tied to shielding mechanisms maintaining a linear elastic model.
The unifying capacity of the SED approach is highlighted, in fact the synthesis based on the local strain energy density allows to obtain a quite narrow scatter-band, which has an equivalent stress-based scatter index T equal to 1.58, considering all the data from V-notched and smooth specimens under pure tension, pure torsion and multiaxial loading, independent of the load ratio and the phase angle. The results of the synthesis in terms of SED are also compared with those from other materials already reported in the literature by the same authors.
MATERIAL PROPERTIES AND GEOMETRY OF THE SPECIMENS
F. Berto et alii, Frattura ed Integrità Strutturale, 33 (2015) 229-237; DOI: 10.3221/IGF-ESIS.33.29
231
(Leica Application Suite), have provided a mean value equal to 0.09 mm with a very reduced scatter. The precision ensured by the employed procedure is ± 5% of the measured quantity. The typical notch geometry constituted by two rectilinear flanks tangent to the notch tip radius is shown in Fig. 1b, for one of the V-notched specimens. The experimental tests have been performed on a MTS 809 servo-hydraulic bi-axial testing device (± 100 kN, ± 1100 Nm, ± 75mm/± 55°) under load control. A MTS load cell with ± 0.5 % error at full scale has been used to measure the applied load. Altogether 15 different fatigue test series have been performed according to the parameters described below:
-Four series of tests on un-notched and V-notched specimens under pure tension and pure torsion fatigue loading at the nominal load ratio R = -1;
-Four series of tests on un-notched and V-notched specimens under pure torsion fatigue loading at the nominal load ratios R = 0 and 0.5;
-Three series of tests on un-notched specimens under pure torsion fatigue loading at the nominal load ratios R = 0.25, -2 and -3;
-Four series of tests on V-notched specimens under combined tension and torsion loading, with a constant biaxiality ratio = 0.6. Two nominal load ratios, R = 0 and R = -1 (referred separately to the normal and shear stress components), and two phase angles, = 0° (in-phase loading) and = 90° (out-of-phase loading), have been adopted in these tests.
(a) (b)
Figure 1: Geometry of un-notched and V-notched specimens (a) and details of the notch tip (b).
RESULTS FROM FATIGUE TESTS
ll specimens have been polished with the aim of removing surface scratches and processing marks, before performing the tests. A MTS 809 servo-hydraulic biaxial machine with a 100 kN axial load cell and a torsion load cell of 1100 Nm has been used for fatigue tests. All tests have been conducted under load control at a frequency between 10 and 15 Hz as a function of the applied load.
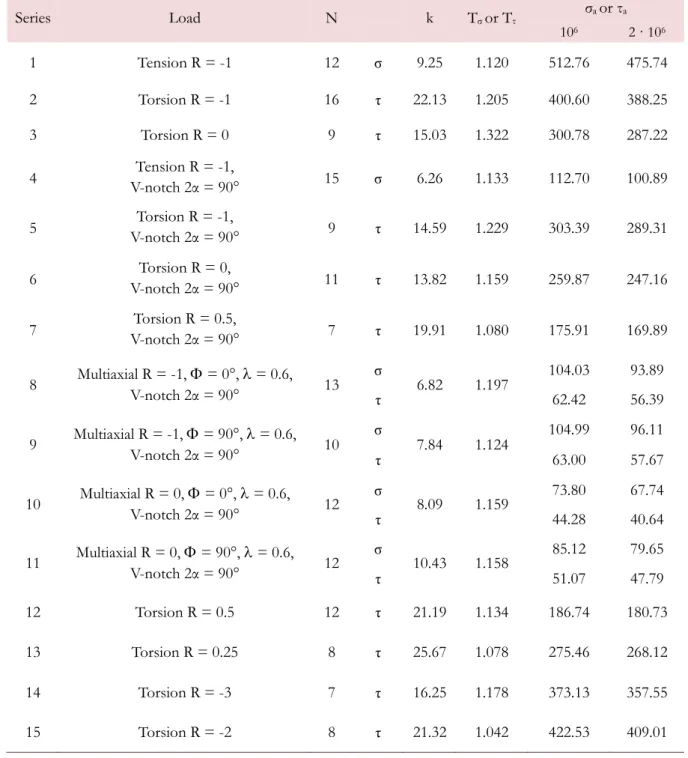
The statistical analyses have been performed assuming a log-normal distribution. All data obtained from specimens characterized by fatigue life between 104 and 2·106 have been taken into account in the statistical analyses, excluding the run-outs. The nominal stress amplitudes for a probability of survival Ps = 50% at different number of loading cycles, NA = 106 and 2·106, the inverse slope k of Wöhler curves and the scatter index T, which provides the width of the scatterband between the curves with 10% and 90% probabilities of survival (with a confidence level equal to 95%) are shown in Tab. 1. The plot of the fatigue curves are reported in [31].
SYNTHESIS BY MEANS OF THE LOCAL SED
ith regard to smooth specimens, all the experimental data are summarised here in terms of the strain energy density, which can be expressed under linear elastic hypothesis according to Beltrami’s expression. Under pure tension one obtains:
2
2
nom
W E
(1)
A
F. Berto et alii, Frattura ed Integrità Strutturale, 33 (2015) 229-237; DOI: 10.3221/IGF-ESIS.33.29
232
Table 1: Results from fatigue tests. Mean values, Ps=50%. Stresses referred to the net area.
while under pure torsion it results:
1
nom2W
E
(2)
where nom and nom represent the range of the nominal stress components. For Ti-6Al-4V titanium alloy the Young’s modulus E is equal to 110 GPa while the Poisson’s ratio ν is 0.3.
Also the experimental data related to V-notched specimens will be summarised here in terms of linear elastic strain energy density, but in this case the SED calculation is based on the local stress and strain state in a control volume surrounding
Series Load N k T or T a or a
106 2 · 106
1 Tension R = -1 12 9.25 1.120 512.76 475.74
2 Torsion R = -1 16 22.13 1.205 400.60 388.25
3 Torsion R = 0 9 15.03 1.322 300.78 287.22
4 Tension R = -1,
V-notch 2α = 90° 15 6.26 1.133 112.70 100.89
5 Torsion R = -1,
V-notch 2α = 90° 9 14.59 1.229 303.39 289.31
6 Torsion R = 0,
V-notch 2α = 90° 11 13.82 1.159 259.87 247.16
7 Torsion R = 0.5,
V-notch 2α = 90° 7 19.91 1.080 175.91 169.89
8 Multiaxial R = -1, = 0°, = 0.6,
V-notch 2α = 90° 13 6.82 1.197
104.03 93.89
62.42 56.39
9 Multiaxial R = -1, = 90°, = 0.6,
V-notch 2α = 90° 10 7.84 1.124
104.99 96.11
63.00 57.67
10 Multiaxial R = 0, = 0°, = 0.6,
V-notch 2α = 90° 12 8.09 1.159
73.80 67.74
44.28 40.64
11 Multiaxial R = 0, = 90°, = 0.6,
V-notch 2α = 90° 12 10.43 1.158
85.12 79.65
51.07 47.79
12 Torsion R = 0.5 12 21.19 1.134 186.74 180.73
13 Torsion R = 0.25 8 25.67 1.078 275.46 268.12
14 Torsion R = -3 7 16.25 1.178 373.13 357.55
F. Berto et alii, Frattura ed Integrità Strutturale, 33 (2015) 229-237; DOI: 10.3221/IGF-ESIS.33.29
233
the notch tip. Being the radius at the notch tip very small ( less than 0.1 mm), the Mode 1 and Mode 3 notch stress intensity factors K1 and K3 can be used to re-analyse the fatigue strength data related to V-notched specimens in terms of the SED.
These field parameters were calculated by means of linear elastic FE analysis considering a sharp V-notch with = 0, see Fig. 2. In particular, considering a cylindrical coordinate system (r, θ, z) centered at the notch apex, where r is the radial coordinate, is the angle between a particular point and the notch bisector line while z is the longitudinal axis of the specimens, the Mode 1 and Mode 3 Notch Stress Intensity Factors (NSIFs) can be defined according to the following expressions:
1
1
1 2 limr 0 ( , 0)
K r r
(3)
3
1
3 2 limr 0 z( , 0)
K r r
(4)
In the case of a V-notch opening angle equal to 90 degrees, the eigenvalues 1 and 3 are equal to 0.545 and 0.667
respectively. On the other hand in conditions of linear elasticity the NSIFs can be linked to the nominal stress components according to the following expression:
1
1
1 1 nom
K k d
(5a)
3
1
3 3 nom
K k d
(5b)
where d is the notch depth (d = 6.0 mm) while k1 and k3 are non-dimensional factors derived from FE analysis. They
simply represent the shape factors, in analogy with the representation of Linear Elastic Fracture Mechanics.
The harmonic element solid plane 83 of the Ansys code was used in the finite element analysis. Taking advantage of the
geometric and loading symmetry, it was possible to model only one quarter of the specimen. FE models gave k1 = 1.000
and k3 = 1.154.
The stress field is controlled by the first singular term (NSIF) up to a distance from the notch tip about equal to 1.0 mm. Substituting the notch depth of the specimens examined here, d = 6 mm, in Eqs. (5a) and (5b), one can obtain:
K1 2.260nom (in MPa ·mm0.445) (6a)
3 2.096 nom
K
(in MPa ·mm0.333) (6b)
Taking into account the range of the nominal stresses at NA = 2·106 cycles relating to V-notched specimens tested under
pure tension and pure torsion with a nominal load ratio R = -1 (Tab. 1) and substituting them into the Eq. (6a) and (6b), it can be obtained:
0.445
1A 2.260 200 452
K MPa mm
(7a)
0.333 3A 2.096 580 1216
K MPa mm
(7b)
In the case of a component weakened by a sharp V-notch and in conditions of linear elasticity, the SED averaged over a control volume, which embraces the notch tip, can be calculated by means of the following expression:
1 3
2 2
3 1
1 2 1 3 2 1
1c 3c
1 K K
W e e
E R R
(8)
where K1 and K3 represent the Mode I and Mode III NSIF ranges, R1c and R3c are the radii of the control volume related to Mode I and Mode III loadings while e1 and e3 are two parameters that summarize the dependence from the V-notch geometry.
These parameters are directly linked to the integrals of the angular functions over the control volume and they can be determined a priori by means of closed-form expressions once known the V-notch opening angle. Since the specimens examined here are characterized by a notch opening angle 2 equal to 90 degrees, e1 and e3 are equal 0.146 and 0.310 respectively, with the Poisson’s ratio = 0.3.
F. Berto et alii, Frattura ed Integrità Strutturale, 33 (2015) 229-237; DOI: 10.3221/IGF-ESIS.33.29
234
It is possible to estimate the control volume radii described in Fig. 2, R1c and R3c, considering separately the loading conditions of Mode I and Mode III. These radii are functions of the high cycle fatigue strength of smooth specimens, 1A = 950 MPa,3A = 776 MPa, and of the mean values of the NSIFS, K1A andK3A, all referred to the same number of cycles, NA = 2·106:
1 1 1 1 1c 1 1 2 A A K R e
(9a)
3 1 1 3 3 3c 3 1 A A e K R
(9b)
Eq. 9a and 9b provide as a result: R1c = 0.051 mm and R3c = 0.837 mm. The obtained values will be used to summarise all fatigue strength data by means of the averaged SED.
The expressions for estimating the control radii, thought of as material properties, have been obtained imposing at NA
cycles the constancy of the SED from smooth and V-notched specimens, which depends on the notch stress intensity factors and the radius of the control volume. Considering instead cracked specimens, the critical NSIFs should be replaced by the threshold values of the stress intensity factors.
Figure 2: Control volumes for V-shaped notches under tension and torsion loading.
In particular, a control volume of radius R1c will be used to evaluate the averaged contribution to local stress and strains due to tensile loading, whereas a radius R3c will be used to assess the averaged contribution due to torsion loading. The size of R3c radius is highly influenced by the presence of larger plasticity under torsion loading with respect to tensile loading and by friction and rubbing between the crack surfaces, as discussed extensively for different materials [31]. With the aim to unify in a single diagram the fatigue data related to different values of the nominal load ratio R, it is necessary to introduce a weighting factor cw on the basis of mere algebraic considerations. The result of these observations[24], provides as master cases cw = 1.0 for R = 0 and cw = 0.5 for R = -1. The expression of cw as a function of the nominal load ratio R is:
2 2 2 2 1 0 1 1 0 1 0 1 1 R for R R for R R for R R (10)F. Berto et alii, Frattura ed Integrità Strutturale, 33 (2015) 229-237; DOI: 10.3221/IGF-ESIS.33.29
235
1 3
2
2
2 2
3 1
1 2 1 3 2 1
1c 3c
2
1
nom W
nom W
W
c un notched specimens pure tension
E
SED c un notched specimens pure torsion
E
c K K
e e V notched specimens multiaxial loading
E R R
(11)
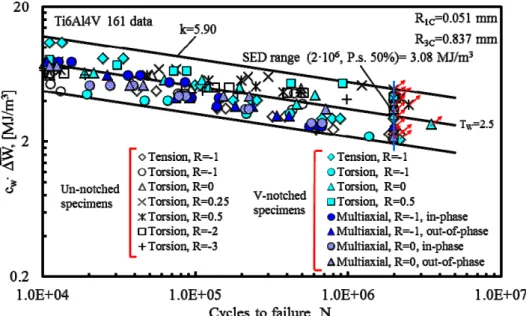
Fig. 3 shows the synthesis in terms of SED of all the fatigue strength data presented in this contribution is shown. Again two different control radii equal to R1c = 0.051 mm and R3c = 0.837 mm respectively have been adopted. The scatterband includes all the data from un-notched and V-notched specimens under pure tension, pure torsion and multiaxial loading, regardless of the load ratio and the phase angle. It is also characterized by an inverse slope k equal to 5.90, a scatter index TW = 2.5 and a value of the strain energy density at the reference number of cycles, NA = 2·106, that equals 3.08 MJ/m3. The equivalent stress-based scatter index T results to be 1.58, that is comparable with that observed in the Haibach scatterband (T= 1.50).
Figure 3: Synthesis by means of local SED of un-notched and V-notched specimens data.
CONCLUSIONS
large bulk of fatigue strength data referred to cylindrical V-notched specimens made of titanium grade 5 alloy (Ti-6Al-4V) and tested under combined tension and torsion loading, both in-phase and out-of-phase, have been analysed together with those obtained from un-notched and V-notched specimens under pure tension and pure torsion loading.
A total of over 160 new fatigue data (15 Wöhler curves) have been summarised in the present work. All fatigue strength data from uniaxial and multiaxial tests have been presented first in terms of nominal stress amplitudes referred to the net area and then reanalysed in terms of the local strain energy density averaged over a control volume that embraces the V-notch tip. The dependence of the control radius by the loading mode is analysed showing the need to use, for the titanium alloy Ti-6Al-4V, a different size of the control volume under tension and under torsion.
The synthesis based on the local strain energy density allows us to obtain a quite narrow scatter-band, which has a scatter index equal to 2.50, considering all the data from V-notched and smooth specimens under pure tension, pure torsion and multiaxial loading, independent of the load ratio and the phase angle.
F. Berto et alii, Frattura ed Integrità Strutturale, 33 (2015) 229-237; DOI: 10.3221/IGF-ESIS.33.29
236
REFERENCES
[1] Fatemi, A., Shamsaei, N., Multiaxial fatigue: An overview and some approximation models for life estimation, Int J Fatigue, 33 (2011) 948-958.
[2] Nieslony, A., Sonsino, C.M., Comparison of some selected multiaxial fatigue assessment criteria, LBF Report 2008; No. FB-234.
[3] Fatemi, A., Socie, D.F., A critical plane approach to multiaxial fatigue damage including out-of-phase loading, Fatigue Fract Eng Mater Struct, 11 (1988) 149-165.
[4] Fatemi, A., Kurath, P. P., Multiaxial fatigue life prediction under the influence of mean stresses, ASME J Eng Mater Techn, 110 (1988) 380-388.
[5] Łagoda, T., Macha, E., Bedkowski, W., A critical plane approach based on energy concepts: application to biaxial random tension-compression high-cycle fatigue regime, Int J Fatigue, 21 (1999) 431-443.
[6] Carpinteri, A., Spagnoli, A., Multiaxial high-cycle fatigue criterion for hard metals, Int J Fatigue, 23 (2001) 135-145. [7] Carpinteri, A., Spagnoli, A., Vantadori, S., Bagni, C., Structural integrity assessment of metallic components under
multiaxial fatigue: The C-S criterion and its evolution, Fatigue Fract Eng Mater, 36 (2013) 870-883.
[8] Ye, D., Hertel, O., Vormwald, M., A unified expression of elastic–plastic notch stress–strain calculation in bodies subjected to multiaxial cyclic loading, Int J Solids Struct, 45 (2008) 6177-6189.
[9] Cristofori, A., Benasciutti, D., Tovo, R., A stress invariant based spectral method to estimate fatigue life under multiaxial random loading, Int J Fatigue, 33 (2011) 887–899.
[10]Carpinteri, A., Spagnoli, A., Vantadori, S., Reformulation in the frequency domain of a critical plane-based multiaxial fatigue criterion, Int. J. Fatigue, 67 (2014) 55-61.
[11]Jasper, T.M., The value of the energy relation in the testing of ferrous metals at varying ranges and at intermediate and high temperature, Philos Mag, 46 (1923) 609–627.
[12]Ellyin, F., Cyclic strain energy density as a criterion for multiaxial fatigue failure, Brown, Miller, editors. Biaxial and Multiaxial Fatigue, 3. London: EGF Publication; (1989) 571–83.
[13]Ellyin, F., Fatigue damage, crack growth and life prediction. Edmonton: Chapman and Hall, (1997).
[14]Macha, E., Sonsino, C.M., Energy criteria of multiaxial fatigue failure, Fatigue Fract Engng Mater Struct, 22 (1999) 1053–1070.
[15]Pook, L.P., Sharples, J.K., The mode III fatigue crack growth threshold for mild steel, Int J Fract, 15 (1979) R223-R226.
[16]Pook, L.P., The fatigue crack direction and threshold behaviour of mild steel under mixed mode I and III loading, Int J Fatigue, 7 (1985) 21-30.
[17]Tong, J., Yates, J.R., Brown, M.W., Some aspects of fatigue thresholds under mode III and mixed mode and I loadings, Int J Fatigue, 18 (1986) 279-285.
[18]Yu, H.C., Tanaka, K., Akiniwa, Y., Estimation of torsional fatigue strength of medium carbon steel bars with circumferential crack by the cyclic resistance-curve method, Fatigue Fract Eng Mater, 21 (1998) 1067-1076.
[19]Tanaka, K., Akiniwa, Y., Yu, H., The propagation of a circumferential fatigue crack in medium-carbon steel bars under combined torsional and axial loadings, In: Mixed-Mode Crack Behaviour, ASTM 1359 (eds KJ Miller and DL McDowell), West Conshohocked, PA, (1999) 295-311.
[20]Pippan, R., Zelger, C., Gach, E., Bichler, C., Weinhandl, H., On the mechanism of fatigue crack propagation in ductile metallic materials, Fatigue Fract Engng Mat Struct, 34 (2011) 1-16.
[21]Christopher, C.J., James, M.N., Patterson, E.A., Tee, K.F., Towards a new model of crack tip stress fields, Int J Fracture, 148 (2007) 361–371.
[22]Christopher, C.J., James, M.N., Patterson, E.A., Tee, K.F., A quantitative evaluation of fatigue crack shielding forces using photoelasticity, Eng Fract Mech, 75 (2008) 4190-4199.
[23]Berto, F., Lazzarin, P., Yates, J., Multiaxial fatigue of V-notched steel specimens: a non-conventional application of the local energy method, Fatigue Fract Engng Mater Struct, 34 (2011) 921–943.
[24]Lazzarin, P., Sonsino, C.M., Zambardi, R., A notch stress intensity approach to assess the multiaxial fatigue strength of welded tube-to-flange joints subjected to combined loadings, Fatigue Fract Engng Mater Struct, 27 (2004) 127-140.
F. Berto et alii, Frattura ed Integrità Strutturale, 33 (2015) 229-237; DOI: 10.3221/IGF-ESIS.33.29
237
[26]Berto, F., Lazzarin, P., Marangon, C., Fatigue strength of notched specimens made of 40CrMoV13.9 under multiaxial loading, Materials and Design, 54 (2014) 57-66.
[27]Berto, F., Lazzarin, P., Tovo, R.,Multiaxial fatigue strength of severely notched cast iron specimens, International Journal of Fatigue, 67 (2014) 15-27.
[28]Berto, F., Lazzarin, P., Marangon, C., Brittle fracture of U-notched graphite plates under mixed mode loading, Mater Des, 41 (2012) 421-432.
[29]Lazzarin, P., Campagnolo, A., Berto, F., A comparison among some recent energy- and stress-based criteria for the fracture assessment of sharp V-notched components under Mode I loading, Theoretical and Applied Fracture Mechanics, 71 (2014) 21-30.
[30]Berto, F., Lazzarin, P., Recent developments in brittle and quasi-brittle failure assessment of engineering materials by means of local approaches, Mater Sci Eng R, 75 (2014) 1-48.