Fecal Markers of Intestinal Inflammation and Permeability Associated with the Subsequent
Acquisition of Linear Growth Deficits in Infants
Margaret Kosek,*Rashidul Haque, Aldo Lima, Sudhir Babji, Sanjaya Shrestha, Shahida Qureshi, Samie Amidou,
Estomih Mduma, Gwenyth Lee, Pablo Pen˜ataro Yori, Richard L. Guerrant, Zulfiqar Bhutta, Carl Mason,
Gagandeep Kang, Mamun Kabir, Caroline Amour, Pascal Bessong, Ali Turab, Jessica Seidman, Maribel Paredes Olortegui, Josiane Quetz, Dennis Lang, Jean Gratz, Mark Miller, and Michael Gottlieb for the MAL-ED network
Department of International Health, Johns Hopkins Bloomberg School of Public Health, Baltimore, Maryland; Center for Vaccine Sciences, ICCDR,B, Dhaka, Bangladesh; Federal University of Ceara´, Fortaleza, CE, Brazil; Christian Medical College, Vellore, Tamil Nadu, India; AFRIMS Research Unit Nepal (WARUN), Kathmandu, Nepal; Department of Pediatrics and Child Health, Aga Khan University, Karachi, Pakistan; University of Venda, Limpopo Province, South Africa; Haydom Lutheran Hospital, Manraya, Tanzania; Center for Global Health,
University of Virginia, Charlottesville, Virginia; Division of Women and Child Health, Aga Khan University, Karachi, Pakistan; Foundation of National Institutes of Health, Bethesda, Maryland
Abstract. Enteric infections are associated with linear growth failure in children. To quantify the association between intestinal inflammation and linear growth failure three commercially available enzyme-linked immunosorbent assays (neopterin [NEO], alpha-anti-trypsin [AAT], and myeloperoxidase [MPO]) were performed in a structured sampling of asymptomatic stool from children under longitudinal surveillance for diarrheal illness in eight countries. Samples from 537 children contributed 1,169 AAT, 916 MPO, and 954 NEO test results that were significantly associated with linear growth. When combined to form a disease activity score, children with the highest score grew 1.08 cm less than children with the lowest score over the 6-month period following the tests after controlling for the incidence of diarrheal disease. This set of affordable non-invasive tests delineates those at risk of linear growth failure and may be used for the improved assessments of interventions to optimize growth during a critical period of early childhood.
INTRODUCTION
The World Health Organization (WHO) has estimated that 32% of children<5 years of age are stunted (length for age Z-score<−2). Stunting is associated with an increased severity
and duration of infectious disease episodes and recent esti-mates in child health assign 1.6 million deaths (>16%) to the underlying adverse effects of malnutrition that are manifest by this linear growth failure.1Furthermore, linear growth def-icits that occur in early life are particularly critical as they are not fully reversible and these permanent deficits are a marker of an enduring loss of human potential experienced by those living in extreme poverty.2Improving child growth in pop-ulations with significant growth deficits is a universal goal and targeted interventions are needed early in life when linear growth deficits are most responsive to interventions. Over the past 25 years many nutritional and disease control interven-tions that have targeted child growth as an outcome have been met with less than expected benefits.3There is a growing
recognition that the relatively poor performance of these interventions are in part because of complex interactions of infection and undernutrition, but also potentially caused by the altered status of the gut in undernourished children with intense exposure to multiple enteric pathogens.
Tropical or environmental enteropathy (EE) has been described in the literature since the 1960s. Biopsy studies done in different parts of the developing world in adults described a consistent set of histopathologic lesions, which included increased crypt depth, decrease in villus height, and lymphocytic infiltration. Later biopsy studies showed a pre-dominance of CD8+ lymphocytes, leading to the alterna-tive nomenclature for EE, T cell enteropathy with a TH1
response.4–6More recent and detailed biopsy studies done in
Zambia have shown that no adults living in Zambia, even those living in moderately good socioeconomic conditions, had normal histology of the jejunum.7The abnormalities were more severe among those of poorer socioeconomic status, and the severity of disease within individuals varied over time when followed by yearly endoscopy and histologic morpho-metrics for a period of 3 years.
Studies in pediatric populations in the Gambia done in the late 1980s evaluated markers of systemic inflammation, dual sugar permeability tests (lactulose and mannitol) that are meant to assess the permeability of the gut to macromole-cules and intestinal absorptive capacity, offered evidence in support of altered gut physiology as an integral component of the pathway leading to growth failure in these children.8–10
The tests were done on a limited number of children in a single epidemiologic context. Results from other sites were consistent in some, but not all findings. Because of changes in assay methodologies and different methods in associating the results with anthropometric outcomes, the magnitude of the association between the dual sugar permeability test and infant growth failure remains an open area of investigation.
In a multisite prospective birth cohort study we sought to clarify the ability of established markers of intestinal inflam-mation and permeability to predict the linear growth trajectory of children living in poverty in the developing world. We chose to concentrate on stool markers that were stable enough for use with minimal primary processing and to focus on the out-come of linear growth in the 6 months following the measure as we posit that the greatest use of a biomarker of environmental enteropathy would be to identify children undergoing a silent preclinical evolution of disease that could be treated if identi-fied to prevent or attenuate future linear growth deficits. Theoretically, such markers might also be measured to monitor response to programmatic therapies or to adjust the inten-sity of therapies at the level of the individual. Alternatively, they could be used at the level of the community to obtain population-based measures of intestinal injury and altered
*Address correspondence to Margaret Kosek, Johns Hopkins Bloomberg School of Public Health, Department of International Health, 615 N. Wolfe St E5545, Baltimore, MD 21205. E-mail: [email protected]
intestinal function. This approach is significantly different than that used in studies in the Gambia that averaged multiple measures over many months, and then compared the mea-sures with growth over the interval during which meamea-sures were obtained.8
We evaluated three stool markers: alpha-1- antitrypsin (AAT), neopterin (NEO), and myeloperoxidase (MPO). The AAT is a serum trypsin inhibitor and one of the principal serum proteins, present in quantities in the range of 1.5–3.5 g/L.
Unlike other principal serum proteins, it is highly resistant to intestinal proteolysis and is excreted intact in the stool.11 In intestinal inflammation, as a result of mucosal ulceration or augmented permeability, the extravasion of AAT into the gut can be measured in the stool and is the classic fecal marker for protein losing enteropathies.12 Endoscopy studies of patients
with acquired immunodeficiency syndrome (AIDS) have shown that high AAT levels were associated with visible muco-sal lesions on the upper endoscopy.13Notable elevations asso-ciated with shigellosis,14 the enteric infection with the most
pronounced impact on linear growth,15also supported its
eval-uation as a biomarker of intestinal permeability and protein wasting in the evaluation of environmental enteropathy.
Neopterin is produced by macrophages and dendritic cells upon stimulation with interferon-gamma (IFN-g) produced by activated T lymphocytes. As such it is a marker of TH1 immune activation that has been useful in assessing allograft rejection, the evaluation of the level of activity of auto-immune diseases, including celiac disease, a close clinical and histopathologic homolog to EE.16–18A single previous report
associated elevated stool neopterin levels with growth failure in the Gambia.19Like AAT it is a notably stable compound that is biologically inert and highly resistant to proteolysis and thus appropriate for stool testing under field conditions.
Myeloperoxidase is a specific marker of neutrophil activity. It was chosen because it is not elevated in breast milk or in the stools of breastfed children as are lactoferrin and calprotectin,20and stool MPO levels have been correlated with
disease activity in inflammatory bowel disease as assessed both by endoscopic and biochemical parameters.21
METHODS
The malnutrition and enteric diseases (MAL-ED) study is an ongoing multisite birth cohort designed to study the effects of enteric infections and nutritional status on child growth and cognitive development through the use of standard protocols of surveillance and assays implemented in eight highly diverse
epidemiologic settings. The study has been implemented in Fortaleza, Brazil (BRF), Dhaka, Bangladesh (BGD), Vellore, India, (INV), Bhaktapur, Nepal (NPB), Loreto, Peru (PEL), Naushahro Feroze, Pakistan (PKN), Haydom, Tanzania (TZH), and Venda, South Africa (SAV) and include both rural and urban environments that are, as a whole, likely to be representative of conditions of children living in poverty in the developing world.
Children are enrolled within 17 days of birth and followed twice weekly for morbidity measures and monthly for anthro-pometric assessments. Children are weighed using metric pediatric balances with a certified accuracy of 100 g and length is measured using a marked platform with a sliding footboard. Study protocols were reviewed and approved by the Institutional Review Boards and regional health authori-ties. These included: (BRF) The Institutional Review Board for Health Science Research of the University of Virginia, the Research Ethics Committee of Universidade Federal de Ceara, and the National Research Ethics Committee of the National Council of Health of Brazil; (BGD) The Institu-tional Review Board for Health Science Research of the University of Virginia and the Ethical Review Committee of ICDDR,B; (INV) The Institutional Review Board of the Christian Medical College of Vellore and the Health Ministry’s Screening Committee of the Indian Council of Medical Research; (NPB) The Institutional Review Board of the Institute of Medicine of Bhaktapur, the Ethical Review Board of the Nepal Health Research Council, and the Institu-tional Review Board of the Walter Reed Army Institute of Research; (PEL) The Institutional Review Board of the Johns Hopkins School of Public Health, the Ethics Committee of Asociacion Benefica PRISMA, and the Regional Health Department of Loreto; (PKN) The Ethical Review Commit-tee of the Aga Khan University; (TZH) The Institutional Review Board for Health Sciences Research of the University of Virginia and the Medical Research Coordinating Commit-tee of the National Institute for Medical Research, and the Ministry of Health and Social Welfare of Tanzania; (SAV) The Institutional Review Board for Health Science Research of the University of Virginia, the Department of Health and Social Development of Limpopo Province, and the Ethical Clearance Committee of the University of Venda.
From May 2011 to November 2011, the MAL-ED study served as a platform to pilot test fecal markers of environmen-tal enteropathy and subset sampling of the toenvironmen-tal available stool banks was done. The subset sampling was based on several suppositions, the first of which is that linear growth
Table1
Stool samples were examined from children enrolled in the study at each site by January 1, 2010*
0 m 1 m 2 m 3 m 4 m 5 m 6 m 7 m 8 m 9 m 10 m 11 m 12 m 13 m 14 m 15 m
Stool assessment x x x
Anthropometric assessment x x x x x x
Periods of assessment of growth velocity
deficits, as opposed to weight gain is a more appropriate indi-cator of adverse consequences of physiologic insults. This is because acquired linear growth deficits are more stable and durable, and because they are associated with deficits in adult work capacity and cognitive potential.22 Recent global reviews for the timing of growth faltering has defined the range of 3–18 months of age as that of the most accelerated
phase in the acquisition of linear growth deficits.2 To focus
study on the early acquisition of linear growth deficits, stools from all asymptomatic children at 3, 6, and 9 months of age were selected from stool banks from children born before January 1, 2010 (enrollment for this study continued until February 28, 2012) and growth outcomes were studied over the time span of 3–15 months of age (see Table 1).
Statistical methods.Because the MAL-ED study was ongo-ing at the time of analysis, data were closed on July 1, 2012. Only data entered and centrally available at this time were included.
Stool results obtained within ±15 days of the child’s indi-cated age were included in the analysis (Table 2).
In exploratory analysis test results were examined by site, by age, and by nutritional status. Correlations of values between the fecal stool tests for individual stools were calculated.
The AAT, MPO, and NEO results were categorized as being at or below the site-combined 25th percentile, between the 25th and the 75th percentile, or above the 75th percentile across the eight sites. These cutoffs were not site-specific; the data presented used the same cutoffs applied across sites and can be seen in Table 3.
Growth modeling. Only anthropometric data from time points 0, 3, 6, 9, 12, and 15 months of age were included in the analysis (Table 2).
Simple linear regression models were carried out to investi-gate the ability of the three tests to predict subsequent changes in length-for-age Z-score (LAZ), by site. Because individual children had multiple observations, these simple linear regres-sion models were restricted to fecal test results at 6 months of age, predicting the change in LAZ from 6 to 9 months and from 6 to 12 months (results not shown). Building on these models, longitudinal models with random effects were devel-oped to combine results across sites and ages. Because longer time intervals were considered to be of greater clinical rele-vance than shorter ones, the models showing changes in LAZ over the 6 months following the fecal tests were retained. The final model is shown below in Equation 1.
LAZði+6Þ,j LAZi,j=bj+b0+b1ðtest=medÞ+b2ðtest=highÞ
+b3D+b4ðage=6 monthsÞ
+b5ðage=9 monthsÞ+b6ðcountry=BGÞ
+b7ðcountry=BRÞ+ L etc: ð1Þ
In Equation 1, LAZ(i+6)j − LAZi,j represents the child’s
change in LAZ from the time of the fecal test (3, 6, or 9 months of age), to (6 months subsequent), test =med or test=high indicates the percentile category the AAT, MPO, or NEO test, andDis a continuous variable representing the number of episodes of diarrhea in the 6-month period. Thebjterm is a random intercept, unique for each study child.
The residual structure was set to exponential, to account for correlation when more than one growth period from the same child (i.e., growth from 3 to 9 months and growth from 6 to 12 months) was present.
Formation of a fecal marker score.A principal component analysis based on the natural log of the three markers was carried out to create a composite score of environmental enteropathy. Based on the weighting factors suggested by this result, a simplified score based on the percentile cate-gory of AAT, MPO, and NEO was developed. This EE score is shown in Equation 2, where AAT, MPO, and NEO categories are defined as 0 (<=25th percentile), 1, (25–75th
percentile), or 2 (>=75th percentile). The EE score there-fore ranged from 0 (lowest quartile in all categories) to 10 (highest quartile in all categories) and is formulated as shown in Equation 2.
2
+
ðAAT categoryÞ+2+
ðMPO categoryÞ+1
+
ðNEO categoryÞ=EE score: ð2ÞTable2
Number of asymptomatic stools contributed by site that were not associated with a diarrheal episode, not temporally associated with a lactulose mannitol (L/M) test, and age matched to within 15 days of the child’s true age*
AAT MPO NEO All 3 tests completeon same sample Bangladesh 211 194 163 147
Brazil 42 38 36 33
India 192 96 95 91
Nepal 241 234 234 224
Peru 131 59 60 47
Pakistan 257 156 199 137
South Africa 38 74 103 11
Tanzania 57 65 64 54
Total 1,169 916 954 744
*AAT=alpha-anti-trypsin; MPO=myeloperoxidase; NEO=neopterin.
Table3
Summary measures of absolute concentration of fecal inflammatory markers by country AAT (mg/g)
median (25th, 75th percentile)
MPO (ng/mL) median (25th, 75th percentile)
NEO (nmol/L) median (25th, 75th percentile) Bangladesh 0.47 (0.25, 0.82) 8838.23 (4552.95, 15020.98) 1422.35 (741.38, 2237.37) Brazil 0.29 (0.14, 0.62) 6847.91 (3884.41, 12452.19) 2385.39 (1895.55, 3303.96) India 0.59 (0.29, 1.12) 14574.97 (6093.03, 27507.40) 2009.31 (1417.08, 2969.13) Nepal 0.59 (0.31, 1.12) 14484.40 (7499.47, 25317.29) 1413.73 (1008.67, 2179.72) Peru 0.60 (0.31, 0.99) 11623.52 (5765.75, 21883.94) 1884.87 (1396.77, 2827.90) Pakistan 0.23 (0.12, 0.52) 8452.01 (3950.82, 12868.78) 2076.65 (1305.33, 3820.75) South Africa 0.25 (0.19, 0.63) 16284.92 (6530.56, 25171.11) 3997.17 (2492.34, 5830.18) Tanzania 0.31 (0.18, 0.61) 17949.77 (9612.64, 2633.81) 1748.40 (1155.42, 2960.52) Overall 0.44 (0.21, 0.86) 11118.88 (5650.46, 20526.33) 1846.68 (1171.39, 2997.85)
The EE score was tested in a model of the same form used for the markers individually, although as a continuous rather than a categorical variable.
Data analysis were performed in Stata, version 11 (StataCorp, College Park, TX) and R, version 2.14.0 (R Development Core Team (2012). R: a language and environment for statistical com-puting. The R Foundation for Statistical Computing, Vienna, Austria. ISBN 3-900051-07-0 (http://www.R-project.org/).
MATERIALS
Stool samples were collected without fixative by field workers and frozen at−70°C pending processing. These
sam-ples were run by each site individually for MPO (Alpco, Salem, NH) as described in the package insert except that the initial dilutions run were 1:500. The NEO (GenWay Biotech, San Diego, CA) was per instructions on the package insert but was diluted 1:1000 in 0.9% saline. The AAT (Biovendor, Candler, NC), which is measured as part of the base MAL-ED study protocol, was run per the protocol speci-fied on the package insert at a dilution of 1:500, and was also included in the analysis. Samples out of range of the standard curve for any of the assays were run at a 2-fold higher or lower concentration (as appropriate).
RESULTS
Data were received for 1,321 samples from 661 unique chil-dren. Stools from children with diarrhea in the last 7 days or LM testing on the day of or the day before the stool collection were omitted from the analysis because of specimen dilution. Across all sites, a total of 1,169 AAT results, 916 MPO results, and 954 NEO results were complete. There were 744 stool samples for which all three test results were available (Table 2, Figure 1).
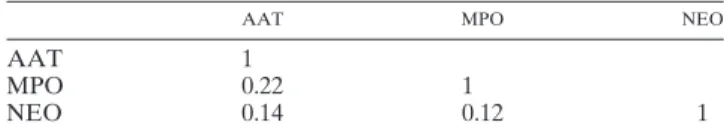
The distributions of these test results were similar across most sites (Table 2). The overall median values of the fecal markers was 0.438 mg/g AAT, 11118.88 ng/L MPO, and 1846.68 nmol/L NEO (Table 3). Correlations between tests were found to be low, with the highest correlation (r=0.219)
occurring between AAT and MPO (Table 4). The values observed in these populations are consistently elevated rela-tive to non-tropical controls in all cases (non-tropical stan-dard MPO = < 2,000 ng/L,21 AAT < 0.27 mg/g,23 NEO
70 nmol/L24).
All three tests predicted declines in LAZ in the 6 months following the test. For instance, children whose fecal level was at or above the 75th percentile for AAT were predicted to lose 0.152 LAZ, compared with children at or below the 25th percentile. Similarly, children in the 75th percentile for MPO and NEO were predicted to lose 0.293 and 0.171 LAZ, respec-tively, compared with children at or below the 25th percentiles for those tests (Table 5). This corresponds to between 0.398 and 0.658 cm less growth over 6 months between the lowest and highest categories, depending on the test (Supplemental Table S1). Subanalysis that allowed for site-specific quartile measures yielded similar results of similar magnitude for most sites, although for the majority of sites, site-specific data did not achieve statistical significance (data not shown). Stratifica-tion for age in the analysis did not yield findings suggestive
Figure1. One thousand three hundred and twenty-one samples from 611 children from eight countries were evaluated for fecal levels of neopterin (NEO), myeloperoxidase (MPO), and alpha-anti-trypsin (AAT). Samples used in the growth analysis were restricted to stools from children with no history of diarrhea in the last 7 days or history of lactulose administration on the day of or before stool collection and for which complete anthropometric data were available.
Table4
Pairwise examination of the Spearman’s correlation between concentrations in AAT, MPO, and NEO in stool*
AAT MPO NEO
AAT 1
MPO 0.22 1
NEO 0.14 0.12 1
of differences in age dependency of the association between the individual biomarkers or the disease activity index.
The combined EE score predicted a decline in LAZ of 0.047 per unit score (Table 6). This is to say that a child with a maximum EE score of 10, i.e., in the upper quartile for AAT, MPO, and NEO, would be expected to lose 0.47 LAZ scores more, in the 6 months following the test, than a child with the lowest possible score of 0. This corresponds to 1.08 cm less length gained between children in the highest versus the lowest EE score (Supplemental Table S2).
To delineate postnatal acquired growth deficits from late manifestation of intrauterine growth restriction, the analysis
was adjusted for birth weight and found birth weight did not modify the association between the fecal markers and change in LAZ.
DISCUSSION
This study shows that levels of inflammation at the level of the intestine representing increased intestinal neutrophil activity (MPO) and TH1 activity (NEO), and protein wasting are asso-ciated with subsequent acquired deficits in linear growth in infants. These effects are separate from late manifestations of intrauterine growth restriction, as the relationships are not modified by birth weight or LAZ at 1 month of age. These acquired linear growth deficits associated with high levels of markers of intestinal inflammation offer support to the hypothesis that intestinal inflammation, likely resulting from frequent enteric infection, is a prominent contributor to growth failure in infancy. The levels of inflammation measured and the strength of association between the indi-vidual biomarkers and the measured outcomes were for the most part consistent across eight diverse epidemiologic set-tings, suggesting that the patterns of intestinal injury, or at least those assessed with these markers are consistent in diverse epidemiologic contexts in children living in poverty. Study findings also suggest that intestinal inflammation is an important component of environmental enteropathy.
The measurement of the level of intestinal inflammation as a composite disease activity score, rather than as individual biomarkers was made possible by the low correlation between the three markers. The advantage of doing so allowed for the accounting of a greater degree of linear growth deficits to be explained than any marker evaluated by itself. This is also logical—diffuse patterns of inflammation that are likely to
reflect a more profound physiologic alteration than a more specific inflammatory response. The use of disease activity scores has been useful for monitoring individuals with other inflammatory conditions such as inflammatory bowel disease and rheumatoid arthritis. We feel it is also an appropriate framework for the analysis of the activity of environmental enteropathy. This index of disease activity score appeared to
Table5
Children with the highest quartile measure of intestinal inflammation in an asymptomatic stool as measured by either AAT, MPO, or NEO* Coefficient
(95% CI) Coefficient(95% CI) Coefficient(95% CI)
AAT<25th percentile Ref MPO<25th percentile Ref NEO<25th percentile Ref AAT 25th–75th percentile −0.115† MPO 25th–75th percentile −0.132† NEO 25th–75th percentile −0.080
AAT>75th percentile −0.152† MPO>75th percentile −0.293‡ NEO>75th percentile −0.171†
Diarrheal incidence −0.027 Diarrheal incidence −0.032§ Diarrheal incidence −0.029†
Country¶ – Country¶ – Country¶ –
Age¶ – Age¶ – Age¶ –
Constant −0.128 Constant −0.122 Constant −0.209‡
N(number of samples) 928 N 752 N 790
n(number of unique children) 537 n 472 n 495
*These children experienced significant deficits in linear growth as measured by change in LAZ over the subsequent 6-month time interval when compared with children in the lowest quartile of these measures.
†P<0.050. ‡P<0.01. §P<0.10.
¶Coefficients not shown.
Table6
The EE activity index is associated with linear growth failure over a subsequent 6-month time interval*
Coefficient (95% CI)
Score −0.047†
Diarrheal incidence −0.026‡
Country=BG ref
BR 0.687†
IN −0.054
NP 0.212†
PE −0.011
PK 0.098
SA 0.553‡
TZ −0.097
Age=3 months ref
6 months −0.197†
9 months −0.266†
Constant −0.020
N(number of samples) 624
n(number of unique children) 408
*For every additional point on a 10-point scale the change in LAZ over the 6-month interval is diminished by 0.047 Z-scores. Therefore, a child with an environmental enteropa-thy (EE) activity score of 10 measures of alpha-anti-trypsin (AAT), myeloperoxidase (MPO), and neopterin (NEO) all in the upper quartile will have a change in LAZ of 0.47 Z-scores less than a child with markers of intestinal inflammation in the lowest quartile for each marker of intestinal inflammation.
†P<0.01. ‡P<0.10.
perform better in countries with higher rates of diarrheal disease, but performed consistently across the multiple sites in our study.
Absolute values of these biomarkers in these children were markedly elevated compared with non-tropical reference values in nearly all cases. The mean AAT value across sites was 1.6 times the non-tropical reference norm,23,25the MPO was 5.5 times the non-tropical reference.21There is little data
available for NEO, but mean levels across sites were 26 times the non-tropical standard value for stool24but were within 10%
of values previously obtained in undernourished children in the Gambia.19 Values are 1,000 times those of serum levels of
neopterin, even in disease states. Neopterin is formed by the non-enzymatic breakdown of dihydroneopterin triphos-phate an intermediate metabolite of guanosine triphostriphos-phate. A relative deficiency of the downstream enzyme 6-pyruvoyl-tetrahydropterin leads to neopterin production at the expense of biopterin production in humans26and primates but not other species; therefore, dietary sources are not likely to cause ele-vated stool concentrations relative to those present in urine. Enterohepatic circulation of neopterin and elevated concentra-tions in the bile seem to be the likely source of a large amount of neopterin in feces. Apparently intestinal inflammation also significantly increases neopterin levels, however is unlikely to be the sole causes of these elevated levels.
Dual sugar permeability testing with lactulose and mannitol (L/M testing) has been a frequently used assessment tool for environmental enteropathy. The test is non-invasive, requiring only administration of a solution containing the two saccha-rides and subsequent collection of urine or, less commonly, blood. However, these assays have a number of practical draw-backs. The assays are run on a number of platforms, from older kinetic assays to newer high-performance liquid chromatogra-phy (HPLC) and high-performance ion chromotograchromatogra-phy (HPIC) methods. Relatively few laboratories in endemic areas have the expertise and equipment to run these assays. The LM test is more expensive (estimated cost across sites $50) than the combined application of the three tests reported here ($15). Results with the LM test obtained across laboratories and different platforms are not comparable; thus, the ability to combine results across epidemiological settings is currently extremely restricted. In contrast NEO, MPO, and AAT are all commercially available, standardized assays that are performed using routine stool samples. With a 3–4 page standard
operat-ing procedure, all eight laboratories quickly demonstrated competence and comparability of assay performance. In addi-tion to the kits, the level of equipment and technical expertise required to obtain results are minimal and limited to an enzyme-linked immunodeficiency assay plate reader and an experienced laboratory technician. Reference laboratories in most of the world could run this assay without specialized equipment, training, or the need to ship samples.
Normal stools water concentration can be reasonably assumed to be relatively constant and levels of MPO, NEO, and AAT therefore predictably related to intestinal inflamma-tion and permeability in stools from asymptomatic children. A limitation of the three tests is that the direct measured fecal concentrations of proteins in stools that are watery, secondary to the administration of a solute load (as occurs during L/M testing), or because of an episode of diarrhea have altered values that are not predictably related to the level of inflamma-tion or protein wasting secondary to the effect of diluinflamma-tion,
which would lower concentrations to varying degrees depending on the relative increase in concentration of water in the stool under evaluation. The use of these exams in predicting growth deficits would be expected to be altered if study design and sample selection did not take this into account.
Linear growth failure is a fundamental and persistent prob-lem in children living in poverty in the developing world. In this pilot study done in eight countries, we show that simple affordable assays done on normal stool can be useful in pre-dicting linear growth deficits in children. We see these tempo-ral windows as opportunities for intervention and feel these markers may offer a manner by which children, at the level of the individual or community can be stratified for risk of subsequent linear growth faltering, and interventions may be targeted to at-risk populations before the occurrence of a permanent physiological insult. At this time, it is unclear if normalization of any of these markers would alter the sub-sequent growth of children; however, if this can be shown in intervention studies, the ability to rapidly assess patient response to interventions could be a useful tool in screening and improving programs to reduce the burden of disease resulting from chronic undernutrition.
Received September 4, 2012. Accepted for publication October 13, 2012. Published online November 26, 2012.
Note: Supplemental tables appear at www.ajtmh.org.
Acknowledgments: Dixner Rengifo Trigoso made important early technical protocol adjustments and Ben McCormick provided helpful comments on an earlier draft of the manuscript. We would addition-ally like to thank the staff and participants of the MAL-ED Network Project for their important contributions.
Financial support: The Etiology, Risk Factors and Interactions of Enteric Infections and Malnutrition and the Consequences for Child Health and Development Project (MAL-ED) are carried out as a col-laborative project supported by the Bill & Melinda Gates Foundation.
Disclaimer: The authors have no conflict of interest.
Bethesda, MD, E-mails: [email protected], [email protected], and [email protected]. Maribel Paredes Olortegui, AB Prisma, Bio-medical Investigation, Iquitos, Peru, E-mail: [email protected] .pe. Michael Gottlieb, Foundation for the National Institutes of Health, Bethesda, MD, E-mail: [email protected].
REFERENCES
1. Black RE, Allen LH, Bhutta ZA, Caulfield LE, de Onis M, Ezzati M, Mathers C, Rivera J, 2008. Maternal and child undernutrition: global and regional exposures and health con-sequences.Lancet 371:243–260.
2. Victora CG, de Onis M, Hallal PC, Blossner M, Shrimpton R, 2010. Worldwide timing of growth faltering: revisiting implica-tions for intervenimplica-tions.Pediatrics 125:e473–e480.
3. Bhutta ZA, Ahmed T, Black RE, Cousens S, Dewey K, Giugliani E, Haider BA, Kirkwood B, Morris SS, Sachdev HP, Shekar M, 2008. What works? Interventions for maternal and child undernutrition and survival.Lancet 371:417–440.
4. Sullivan PB, Marsh MN, Mirakian R, Hill SM, Milla PJ, Neale G, 1991. Chronic diarrhea and malnutrition–histology of the small
intestinal lesion.J Pediatr Gastroenterol Nutr 12:195–203.
5. Sullivan PB, Lunn PG, Northrop-Clewes C, Crowe PT, Marsh MN, Neale G, 1992. Persistent diarrhea and malnutrition–the
impact of treatment on small bowel structure and permeability.
J Pediatr Gastroenterol Nutr 14:208–215.
6. Campbell DI, Murch SH, Elia M, Sullivan PB, Sanyang MS, Jobarteh B, Lunn PG, 2003. Chronic T cell-mediated enter-opathy in rural west African children: relationship with nutri-tional status and small bowel function.Pediatr Res 54:306–311.
7. Kelly P, Menzies I, Crane R, Zulu I, Nickols C, Feakins R, Mwansa J, Mudenda V, Katubulushi M, Greenwald S, Farthing M, 2004. Responses of small intestinal architecture and func-tion over time to environmental factors in a tropical popula-tion.Am J Trop Med Hyg 70:412–419.
8. Lunn PG, Northrop-Clewes CA, Downes RM, 1991. Intestinal permeability, mucosal injury, and growth faltering in Gambian infants.Lancet 338:907–910.
9. Campbell DI, Elia M, Lunn PG, 2003. Growth faltering in rural Gambian infants is associated with impaired small intestinal barrier function, leading to endotoxemia and systemic inflam-mation.J Nutr 133:1332–1338.
10. Campbell DI, Lunn PG, Elia M, 2002. Age-related association of small intestinal mucosal enteropathy with nutritional status in rural Gambian children.Br J Nutr 88:499–505.
11. Sharp HL, 1976. The current status of alpha-1-antityrpsin, a protease inhibitor, in gastrointestinal disease.Gastroenterology 70:611–621.
12. Crossley JR, Elliott RB, 1977. Simple method for diagnosing protein-losing enteropathies.BMJ 1:428–429.
13. Laine L, Garcia F, McGilligan K, Malinko A, Sinatra FR, Thomas DW, 1993. Protein-losing enteropathy and hypoalbuminemia in AIDS.AIDS 7:837–840.
14. Black RE, Levine MM, 1991. Intestinal protein loss in shigellosis.
Nutr Res 11:1215–1220.
15. Black RE, Brown KH, Becker S, 1984. Effects of diarrhea associ-ated with specific enteropathogens on the growth of children in rural Bangladesh.Pediatrics 73:799–805.
16. Margreiter R, Fuchs D, Hausen A, Huber C, Reibnegger G, Spielberger M, Wachter H, 1983. Neopterin as a new biochem-ical marker for diagnosis of allograft rejection. Experience based upon evaluation of 100 consecutive cases. Transplanta-tion 36:650–653.
17. Leohirun L, Thuvasethakul P, Sumethkul V, Pholcharoen T, Boonpucknavig V, 1991. Urinary neopterin in patients with sys-temic lupus erythematosus.Clin Chem 37:47–50.
18. Fuchs D, Granditsch G, Hausen A, Reibnegger G, Wachter H, 1983. Urinary neopterin excretion in coeliac disease.Lancet 2:463–464.
19. Campbell DI, McPhail G, Lunn PG, Elia M, Jeffries DJ, 2004. Intestinal inflammation measured by fecal neopterin in Gambian children with enteropathy: association with growth failure,Giardia lamblia, and intestinal permeability.J Pediatr
Gastroenterol Nutr 39:153–157.
20. Dorosko SM, Mackenzie T, Connor RI, 2008. Fecal calprotectin concentrations are higher in exclusively breast-fed infants compared to those who are mixed-breast-fed.Breastfeed
Med 3:117–119.
21. Saiki T, 1998. Myeloperoxidase concentrations in the stool as a new parameter of inflammatory bowel disease.Kurume Med J 45:69–73.
22. Victora CG, Adair L, Fall C, Hallal PC, Martorell R, Richter L, Sachdev HS, 2008. Maternal and child undernutrition: consequences for adult health and human capital.Lancet 371: 340–357.
23. Beckmann G, Ruffer A, 2000. Microbiology of the Intestine. Hannover: Schluttersche, 1–446.
24. Ledjeff E, Artner-Dworzak E, Witasek A, Fuchs D, Hausen A, 2001. Neopterin concentrations in colon dialysate.Pteridines 12:155–160.
25. Meyers S, Wolke A, Field SP, Feuer EJ, Johnson JW, Janowitz HD, 1985. Fecal alpha 1-antitrypsin measurement: an indicator of Crohn’s disease activity.Gastroenterology 89:13–18.