SRef-ID: 1680-7359/adgeo/2005-5-13 European Geosciences Union
© 2005 Author(s). This work is licensed under a Creative Commons License.
Geosciences
Integrated analysis of water quality in a mesoscale lowland basin
A. Habeck, V. Krysanova, and F. Hattermann
Potsdam Institute for Climate Impact Research (PIK), Telegrafenberg, 14473 Potsdam, Germany
Received: 7 January 2005 – Revised: 1 August 2005 – Accepted: 1 September 2005 – Published: 16 December 2005
Abstract. This article describes a modelling study on
nitro-gen transport from diffuse sources in the Nuthe catchment, representing a typical lowland region in the north-eastern Germany. Building on a hydrological validation performed in advance using the ecohydrological model SWIM, the ni-trogen flows were simulated over a 20-year period (1981– 2000). The relatively good quality of the input data, partic-ularly for the years from 1993 to 2000, enabled the nitrogen flows to be reproduced sufficiently well, although modelling nutrient flows is always associated with a great deal of uncer-tainty. Subsequently, scenario calculations were carried out in order to investigate how nitrogen transport from the catch-ment could be further reduced. The selected scenario results with the greatest reduction of nitrogen washoff will briefly be presented in the paper.
1 Introduction
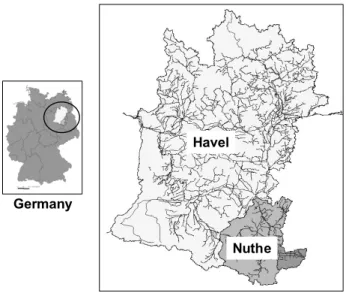
The work presented here was carried out as a part of the consortium project “Bewirtschaftungsm¨oglichkeiten im Einzugsgebiet der Havel” (“Potential for water resources management in the Havel River Basin”), whose major objec-tive was to accompany scientifically the practical application of the Water Framework Directive in Germany. According to this, the surface water of the Havel River (see Fig. 1), which is one of the largest tributaries of the Elbe River, should be brought into a “good ecological condition” by the year 2015. The main aim of the project work was to suggest manage-ment options leading to reduction of nitrogen and phospho-rous transport from diffuse sources to the Havel river system. For this purpose, the nutrient transport from diffuse sources represented mainly by agriculture, was simulated using the ecohydrological model SWIM (Krysanova et al., 2000), and a number of land use change scenarios were applied to inves-tigate their effect on reduction of nutrient load.
Correspondence to:A. Habeck ([email protected])
2 The Model SWIM
SWIM (Soil and Water Integrated Model, Krysanova et al., 1998) is a continuous-time, spatially distributed ecohydro-logical model for mesoscale and large river basins. It works on a daily time step and integrates hydrology, vegetation, nutrients (carbon, nitrogen and phosphorus) and sediment fluxes at the river basin scale. The spatial aggregation units for river basin modelling are subbasins, which are further dis-aggregated into hydrotopes – hydrologically homogenous ar-eas within subbasins. The hydrotopes are delineated by over-laying of subbasin, land use and soil maps (Krysanova et al., 2000). The model is connected to meteorological, land use, soil, vegetation and agricultural management input data.
Water fluxes, plant growth and nitrogen dynamics are cal-culated with the daily time step for every hydrotope. The ni-trogen module includes the following pools: nitrate nini-trogen, active and stable organic nitrogen, organic nitrogen in the plant residue, and the flows: fertilisation, input with precipi-tation, mineralisation, denitrification, plant uptake, wash-off with surface and subsurface flows, leaching to ground water, and loss with erosion. The lateral water and nutrient fluxes are routed over the river network, taking transmission losses into account.
For detailed process descriptions, validation studies and data see Krysanova et al. (1998, 1999, 2000). An extensive multiscale and multicriterial validation of the model in the German part of the Elbe basin and its subbasins including sensitivity and uncertainty analyses is described in Hatter-mann et al. (2004).
3 Case study area
Nuthe Havel
Germany
Fig. 1.The location of the Havel and Nuthe catchments.
hydrological terms, the catchment area is characterized by al-most semi-arid conditions: usually in summer there is a lack of precipitation, but in winter a surplus. The drainage be-haviour of the Nuthe is regulated by reservoir and ditch sys-tems. Soils are predominantly formed during the last ice age, over loose bedrocks, which are often influenced by shallow groundwater. Typical soil types are brown soils (Braunerde), gley-podsols, gleys and organic fen soils. The large part of the Nuthe catchment (47%) is used for agriculture, but there is also a large proportion of forest (42%). While at the end of the 1980s the Nuthe was considered as strongly polluted, to-day it is one of the rivers in Germany with the lowest nitrate pollution because of the notable reduction of nutrient emis-sions from different sources during the last 15 years (see also Sect. 5 for details).
4 Modelling results
In order to fulfil the basic requirement for the water qual-ity modelling of a catchment, the model SWIM was first hydrologically validated for the Nuthe. The comparison of the measured and simulated water discharge was satisfactory: the daily Nash and Sutcliffe efficiency for the validation pe-riod 1981–1987 was 0.57, and the mean long term difference between the observed and simulated river discharge at the basin outlet was +4%. This is acceptable for the lowland basin, especially if one takes into account that the hydrolog-ical modelling is more complicated in an anthropogenhydrolog-ically influenced lowland catchment due to the specific local hydro-logical conditions such as influence of shallow groundwater, artificial reservoirs and drainage systems.
After the hydrological validation, the simulation of the ni-trate cycling in soil and transport to the river system was per-formed, and the results were compared with available data of observation. In order to preliminarily check the balance of nitrogen in soil simulated by the model, SWIM was first
applied in the framework of the workshop “Modelling Wa-ter and Nutrient Dynamics in Soil Crop Systems” organised by the Leibniz-Centre for Agricultural Landscape and Land Use Research (ZALF). The objective was to perform a point-scale validation at several sites in Germany, which included one site in the Havel catchment. The model was able to re-produce the observed nitrogen cycling in soils (nitrate-N con-tent in different soil layers) quite well. A detailed description of the study and results can be found in Post et al. (2004)1.
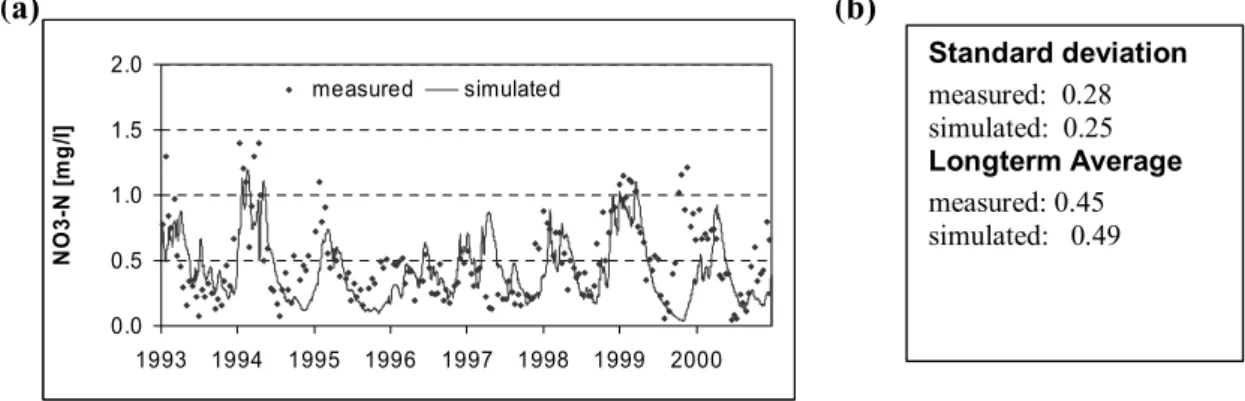
After that nitrogen validation for the Nuthe catchment was performed. The vertical transformation processes in soil pro-file as well as the retention and denitrification processes in the catchment during the lateral transport were taken into consideration. Both point and diffuse sources of pollution were considered, though exact information about crop ro-tations and fertiliser application (amounts and timing) was missing and had to be substituted by general or expert knowl-edge for the region. The comparison of the simulated daily values for nitrate concentration with the measured ones in the Nuthe for the years from 1993 to 2000 shows a satisfactory result, despite of some differences in 1997 and 1999 (Fig. 2), which could be caused by imprecise input information men-tioned above.
The example of the Nuthe also demonstrates that nutrient modelling is usually associated with some uncertainty caused by different reasons. Thus it is important, for example, that the model is subject to a comprehensive hydrological valida-tion in advance, since errors in the calculavalida-tion of water dis-charge have a notable influence on the results of the nutrient dynamics modelling. Moreover, data on land use and land management, such as crop rotations and timing and quan-tities of fertiliser application, need to be known in order to correctly represent the nutrient balance in soil. Therefore, the influence of different fertilisation practices was investi-gated additionally in our study.
One such example is shown in Fig. 3, which presents the sensitivity of the model to the amount of applied mineral ni-trogen fertilisers considering the reference case along with increasing/decreasing the amount of nitrogen fertiliser by 40%. One can see that the amount of nitrogen application in soil particularly affects the peak concentrations in river. This confirms in turn that the precise adjustment of fertiliser quan-tities should not be ignored. Further, the parameters for nu-trient retention and nunu-trient denitrification during the lateral transport should be plausibly chosen and should be appropri-ate for the region, since both factors have a notable influence on the simulation results.
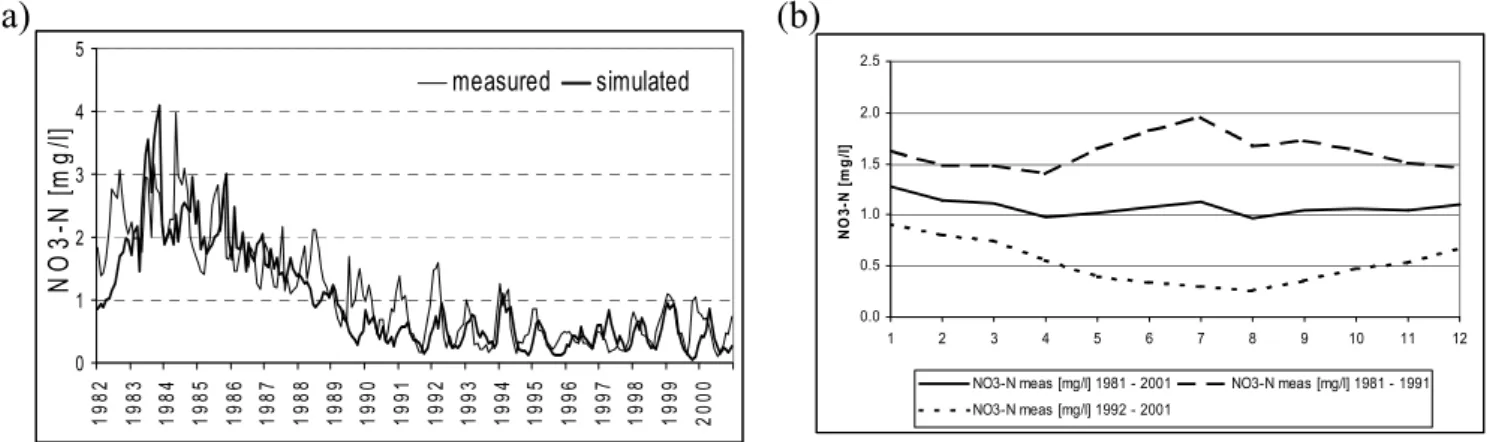
In the next step the long-term dynamics of the nitrate N concentration in the Nuthe River was analysed for the period 1982–2000 (Fig. 4). The measured data show that since the middle of the 1980s, the level of nitrate N concentration in
1Post, J., Habeck, A., Hattermann, F., Krysanova, V.,
(a) (b)
Standard deviation
measured: 0.28 simulated: 0.25
Longterm Average
measured: 0.45 simulated: 0.49
0.0 0.5 1.0 1.5 2.0
1993 1994 1995 1996 1997 1998 1999 2000
NO
3
-N [
m
g/
l]
measured simulated
Fig. 2. (a)Comparison of the simulated daily values for nitrate N concentration with the measured ones (one measurement in two weeks) in the Nuthe, gauge Potsdam / Babelsberg (1993–2000);(b)Standard deviation and long-term average values for the time period 1993–2000.
the Nuthe River has declined considerably. The reasons for this can be found in changes in nutrient emissions. Generally three different sources of nitrogen pollution were identified for the Nuthe catchment area in the 1980s:
1. point sources (public sewage treatment plants and direct input from industrial sources),
2. diffuse sources (manly input from agriculture fields and the atmosphere), and
3. sewage fields (disposal of communal sewage on ground) (Werner et al., 1994).
Until the mid-1980s about 45 million m3of sewage per year were being piped to the sewage fields in the Nuthe catchment. Sewage water was brought onto the fields not only during the vegetation period, but continuously. Due to the fact that the sewage fields covered only about 1% of the total Nuthe catch-ment area, and very large amounts of wastes were spread over the fields practically permanently, leading to the per-manent wash-off from the highly polluted area, the sewage fields operated rather as a permanent point source polluter for the Nuthe basin (higher load accompanying lower dis-charge). Therefore it makes sense to consider this pollution source separately.
The analysis shows that the reduction of nitrogen concen-tration in the Nuthe River happened predominantly due to essential reduction of inputs from two sources: the sewage fields and diffuse sources. Since the beginning of the 1990s the volume of sewage on the sewage fields was significantly reduced, and in 1994 this method was completely discontin-ued (Tr¨oger et al., 1995; Scheytt et al., 2000). Furthermore, from the early 1990s the use of industrial and mineral fer-tilizers on arable land in the basin was considerably reduced because of changes in agriculture management practices (fer-tilisation in accordance with plant requirements) (Behrendt et al., 2002).
In our modelling for 1982–2000 (see Fig. 4a) it was there-fore taken into account that in the 1980s the input of nitro-gen from point and diffuse sources was considerably higher than in the 1990s. Because exact input data on a daily or
0.0 0.5 1.0 1.5
1996 1997 1998
NO3-N
[mg/l]
Fig. 3. Effect of different amounts of mineral nitrogen fertilis-ers on the daily nitrate concentration in the Nuthe for the time period 1996–1998. Middle line shows the reference case with 100 kg N/(ha*a), and the dark/light grey shadowed areas indicate cases with increased/decreased amounts of fertilisers by 40%.
monthly basis were lacking, the daily nitrogen input from the sources listed above was estimated using existing annual values. Therefore, the intraseasonal dynamics in the 1980s could not be satisfactory reproduced. On the other hand, when the measured and the simulated monthly nitrate con-centrations are compared (Fig. 4b), the change in the sea-sonal dynamics can be clearly seen. While the peak concen-trations in the 1980s occurred during the summer months, in the 1990s they occurred in winter, which means that point source pollution prevailed in the 1980s, and diffuse source pollution prevailed in the 1990s. The closure of sewage fields along with other measures mentioned above definitively led to the observed significant reduction in N concentrations, and to the change in seasonal dynamics. This conclusion was confirmed by the simulation experiment with SWIM (Fig. 4).
5 Scenario calculations
(a) (b)
0.0 0.5 1.0 1.5 2.0 2.51 2 3 4 5 6 7 8 9 10 11 12
NO 3 -N [ m g /l ]
NO3-N meas [mg/l] 1981 - 2001 NO3-N meas [mg/l] 1981 - 1991
NO3-N meas [mg/l] 1992 - 2001
0 1 2 3 4 5 1 982 1 983 1 984 1 985 1 986 1 987 1 988 1 989 1 990 1 991 1 992 1 993 1 994 1 995 1 996 1 997 1 998 1 999 2 000 NO 3 -N [m g /l ] measured simulated
Fig. 4. (a)Comparison of the simulated monthly values for nitrate concentration with the measured ones in the Nuthe from 1982 until 2000
(b)Monthly long-term average values of the measured nitrate concentration for three time periods.
Table 1. Proportion of land use types in the Nuthe catchment for the time periods 1988 – 2000 (reference case) and 2003 – 2015 (scenario)
Land Use Type 1988–2000 [%] 2003–2015 [%]
Agriculture 47 36
Forest 42 43
Others 10 22
Table 2. Emissions of nitrogen from diffuse sources in the Nuthe catchment for the time periods 1988–2000 (reference case) and 2003–2015 (scenario)(a) total emissions in [kt/a](b) emissions weighted according to the area in [kg/ha*a].
(a)
Land Use Type 1988–2000 [kt/a] 2003–2015 [kt/a]
Total 3.9 2.6
Agriculture 2.3 1.2
Forest 0.8 0.1
Others 0.8 1.2
(b)
Land Use Type 1988–2000 [kg/ha*a] 2003–2015 [kg/ha*a]
Total 23 15
Agriculture 31 21
Forest 11 2
Others 41 31
The scenarios were produced by the working group in the Havel consortium project (Jacobs et al., 2003). Here re-sults for one scenario described in Table 1, which relates to the years 2003 to 2015 and assumes significant reduction of arable land and its conversion to set-aside areas and wetlands, are presented.
According to this scenario, arable land is reduced from 47% to 36%. In particular the areas used for intensive agri-culture and pasture decline. The share of land used for ex-tensive pasture and set-aside, on the other hand, increases. The main reason for the increase of “other types of land use” is the extension of wetlands not used for agriculture from 1% to 12%. Although the overall share covered by forest remains fairly constant according to Table 1, there are con-siderable changes. The older stands of deciduous, conifer-ous and mixed woodlands have been reduced in favour of young stands. Though the areas for different types of land use in this scenario changed, the fertiliser quantities and tim-ing, crop rotations and the climatic boundary conditions were kept constant.
The objective was to study how and to what extent changes in land use may reduce the nitrogen discharge from diffuse sources. Table 2 shows that this can be achieved with the planned changes in land use. In total the amount of nitro-gen from diffuse sources sinks from 3.9 to 2.6 kt/a. Also the nitrogen emissions weighted according to area are reduced from 23 to 15 kg/ha*a. This corresponds to reductions of 33% and 35% respectively. If one looks more closely at the three different groups of land use, it can be seen that expec-tations have been fulfilled both for agriculture and forestry. For the other classes of land use, particularly the wetlands not used for agriculture purposes, there was an increase in nitrogen discharge, which is due to the fact that the area for this land use was considerably increased. The volume of dis-charge weighted according to area, however, shows the ex-pected decrease in nitrogen discharge (Table 2b).
6 Outlook
method could be transferred to other catchments, where water quality is a problem and reduction of agricultural diffuse pollution is required.
Edited by: P. Krause, K. Bongartz, and W.-A. Fl¨ugel Reviewed by: anonymous referees
References
Behrendt, H., Opitz, D., and Schmoll, O.: Stoffeintr¨age in die Gew¨asser des Landes Brandenburg, Fachbeitr¨age des Lan-desumweltamtes, H. 68, Hrsg. Landesumweltamt Brandenburg, 2002.
Jacobs, J. and Jessel, B.: Entwicklung von Landschaftsszenarien als Grundlage f¨ur das Management von Flusseinzugsgebieten, UVP-Report, H. 2/2003.
Hattermann, F. F., Wattenbach, M., Krysanova, V., and Wechsung, F.: Runoff simulations on the macroscale with the ecohydrolog-ical model SWIM in the Elbe catchment – validation and uncer-tainty analysis, Hydrological Processes, 19, 693–714, 2005.
Krysanova, V., M¨uller-Wohlfeil, D.-I., and Becker, A.: Develop-ment and test of a spatially distributed hydrological/water qual-ity model for mesoscale watersheds, Ecological Modelling, 106, 263–289, 1998.
Krysanova, V. and Becker, A.: Integrated modelling of hydrological processes and nutrient dynamics at the river basin scale, Hydro-biologia, 410, 131–138, 1999.
Krysanova, V., Wechsung, F., Arnold, J., Srinivasan, R., and Williams, J.: SWIM, User manual, PIK-Report, H. 69, Potsdam Institut f¨ur Klimafolgenforschung, 2000.
Scheytt, T. and Grams, S.: Grundwasserstr¨omung und -beschaffenheit unter dem Einfluss 100-j¨ahriger Rieselfeld-wirtschaft, Wasser und Boden, 52, 15–22, 2000.
Werner, W. and Wodsack, H. P.: Stickstoff- und Phosphoreintrag in Fließgew¨asser Deutschlands unter besonderer Ber¨ucksichtigung des Eintragsgeschehens im Lockersteinbereich der ehemaligen DDR, Agrarspectrum, 88–122, 1994.