ACPD
11, 17337–17373, 2011Measurements of ozone and its precursors in Beijing
J. Xu et al.
Title Page
Abstract Introduction
Conclusions References
Tables Figures
◭ ◮
◭ ◮
Back Close
Full Screen / Esc
Printer-friendly Version
Interactive Discussion
Discussion
P
a
per
|
Dis
cussion
P
a
per
|
Discussion
P
a
per
|
Discussio
n
P
a
per
|
Atmos. Chem. Phys. Discuss., 11, 17337–17373, 2011 www.atmos-chem-phys-discuss.net/11/17337/2011/ doi:10.5194/acpd-11-17337-2011
© Author(s) 2011. CC Attribution 3.0 License.
Atmospheric Chemistry and Physics Discussions
This discussion paper is/has been under review for the journal Atmospheric Chemistry and Physics (ACP). Please refer to the corresponding final paper in ACP if available.
Measurements of ozone and its
precursors in Beijing during summertime:
impact of urban plumes on ozone
pollution in downwind rural areas
J. Xu1,2,3, J. Z. Ma1, X. L. Zhang3, X. B. Xu1, X. F. Xu3, W. L. Lin1, Y. Wang1,
W. Meng3, and Z. Q. Ma3
1
Chinese Academy of Meteorological Sciences, Beijing 100081, China
2
Graduate University of Chinese Academy of Sciences, Beijing 100049, China
3
Institute of Urban Meteorology, China Meteorological Administration, Beijing 100089, China
Received: 23 May 2011 – Accepted: 10 June 2011 – Published: 21 June 2011
Correspondence to: J. Z. Ma ([email protected])
ACPD
11, 17337–17373, 2011Measurements of ozone and its precursors in Beijing
J. Xu et al.
Title Page
Abstract Introduction
Conclusions References
Tables Figures
◭ ◮
◭ ◮
Back Close
Full Screen / Esc
Printer-friendly Version
Interactive Discussion
Discussion
P
a
per
|
Dis
cussion
P
a
per
|
Discussion
P
a
per
|
Discussio
n
P
a
per
|
Abstract
Sea-land and mount-valley circulations are the dominant mesoscale synoptic systems affecting the Beijing area during summertime. Under the influence of these two cir-culations, the prevailing wind is southwesterly from afternoon to midnight, and then changes to northeasterly till forenoon. In this study, surface ozone (O3), carbon monox-5
ide (CO), nitric oxide (NO), nitrogen dioxide (NO2), nitrogen oxide (NOx) and
non-methane hydrocarbons (NMHCs) were measured at four sites located along the route of prevailing wind, including two upwind urban sites (Fengtai (FT) and Baolian (BL)), an upwind suburban site (Shunyi (SY)) and a downwind rural site (Shangdianzi (SDZ)) during 20 June–16 September 2007. The purpose is to improve our understanding of
10
ozone photochemistry in urban and rural areas of Beijing and the influence of urban plumes on ozone pollution in downwind rural areas. It is found that ozone pollution was synchronism in the urban and rural areas of Beijing, coinciding with the regional-scale synoptic processes. Due to the high traffic density and local emissions, the average levels of reactive gases NOxand NMHCs at the non-rural sites were much higher than 15
those at SDZ. The level of long-lived gas CO at SDZ was comparable to and slightly lower than it was at other sites. The daily-averaged ozone concentration at SDZ was much higher than at other sites due to weak titration. Ranking by OH loss rate coef-ficient (LOH), alkenes played a dominant role in total NMHCs reactivity at both urban
and rural sites during the experiment, accounting for 48.6 % and 52.1 % of totalLOH, 20
respectively. The NMHCs data were also used to estimate the ozone potential for-mation (OFP) in Beijing. The leading contributors to ozone forfor-mation were aromatics at both urban and rural sites during the experiment, which accounts for 55.5 % and 49.4 % of total OFP, respectively. The ozone peak values are found to lag behind one site after another along the route of prevailing wind from SW to NE. Intersection
25
analyses of trace gases reveal that polluted air masses arriving at SDZ were more aged with both higher O3and Oxconcentrations than those at BL. The results indicate
ACPD
11, 17337–17373, 2011Measurements of ozone and its precursors in Beijing
J. Xu et al.
Title Page
Abstract Introduction
Conclusions References
Tables Figures
◭ ◮
◭ ◮
Back Close
Full Screen / Esc
Printer-friendly Version
Interactive Discussion
Discussion
P
a
per
|
Dis
cussion
P
a
per
|
Discussion
P
a
per
|
Discussio
n
P
a
per
|
photochemical O3 production when being mixed with background atmosphere in the downwind rural area.
1 Introduction
Beijing is one of the world’s largest cities with population over 15 million and an area of 16 808 km2. Accompanying the rapid growth in traffic, photochemical pollution in
5
Beijing has become more serious in recent years (Hao and Wang, 2005; Shao et al., 2006; Wang et al., 2006). For example, the ambient air quality standard for ozone has frequently been exceeded, with the peak hourly averaged concentration of 286 ppbv recorded (Wang et al., 2006). Beijing is the center of an urban agglomeration in North China. Compared to the other two city cluster regions in China, i.e., the Yangtze River
10
delta (Cheung and Wang, 2001; Chan et al., 2003; Geng et al., 2007) and the Pearl River delta (Ding et al., 2004; So and Wang, 2003; Wang and Kwok, 2003; Lam et al., 2005; Zhang et al., 2008b), research on photochemical pollution in Beijing was started scarcely.
Previous studies focused mainly on the spatial and temporal variations of surface
15
ozone and its precursors (Tang et al., 2009; Wang et al., 2010; Shao et al., 2009). Countable reports on the photochemical processes suggested that the ozone produc-tion processes and formaproduc-tion regimes are complicated and non-uniformly distributed within the Beijing area. For example, Lu (2010) indicated that both NOx-and VOC (volatile organic compounds)-sensitive chemistry exist at the urban and suburban sites
20
with ozone production,P(O3), varying from nearly zero to 120 and 50 ppb h− 1
, respec-tively. It has been indicated that theP(O3) in the urban area is more VOC sensitive
with the ozone production efficiency (OPE) varying from 1.5 to 6.0 near the high NOx emission sources (An, 2006), and from 3.9 to 7.9 with the low NOxemissions (Chou et
al., 2009). Model results suggested that the current high surface ozone is strongly
stim-25
ACPD
11, 17337–17373, 2011Measurements of ozone and its precursors in Beijing
J. Xu et al.
Title Page
Abstract Introduction
Conclusions References
Tables Figures
◭ ◮
◭ ◮
Back Close
Full Screen / Esc
Printer-friendly Version
Interactive Discussion
Discussion
P
a
per
|
Dis
cussion
P
a
per
|
Discussion
P
a
per
|
Discussio
n
P
a
per
|
strong inhibitory effect on ozone formation, even after a 50 % NOxemission reduction. A transition of ozone formation was observed from NOx-saturated to NOx-limited
sen-sitivity behavior with a 75 % reduction of NOx emissions (Tang et al., 2010). Further
studies indicated that ozone formation in Beijing is sensitive to VOCs for both urban and rural sites (Wang et al., 2010; Shao et al., 2009), and a reduction in NOx would lead 5
to a decrease in ozone at the rural site, but would cause an increase in ozone at the urban site (Shao et al., 2009). In the urban area vehicle activities contribute dominantly to both the VOC loading and the ozone formation potential while in the rural area the contribution of traffic is much lower (Yuan et al., 2009). These results suggested that it is needed to investigate the ozone-related processes individually in different regions
10
because there is no geographically uniform response to NOx and VOCs owing to the intricate emission conditions in the Beijing area.
Previous studies also highlighted the importance of regional transport from the urban to rural area of Beijing as it was found that the highest concentrations of O3and other trace gases observed at the rural site are mainly due to emissions from the Beijing
15
urban area (Wang et al., 2006). Lin et al. (2008b) analyzed ozone and its precursors observed at Shangdianzi (SDZ), a regional background station in North China, over the period 2004–2006. The contribution of pollutants from the North China Plain to surface ozone at SDZ was estimated at an average value of 21.8 ppbv, mostly from SW of the station. Meng (2009) indicated that the intensive biomass burning in the North China
20
Plain, in combination with the transport of regional pollution by more frequent south-westerly winds, are responsible for the elevated CO concentration during summer time at SDZ. Diurnal variation of O3with delayed peaking time suggested that the transport of photochemical aged plume is an important source for O3at SDZ (Meng et al., 2009;
Lin et al., 2008a). All these studies were carried out based on measurements in the
25
ACPD
11, 17337–17373, 2011Measurements of ozone and its precursors in Beijing
J. Xu et al.
Title Page
Abstract Introduction
Conclusions References
Tables Figures
◭ ◮
◭ ◮
Back Close
Full Screen / Esc
Printer-friendly Version
Interactive Discussion
Discussion
P
a
per
|
Dis
cussion
P
a
per
|
Discussion
P
a
per
|
Discussio
n
P
a
per
|
southwest of Beijing), they showed that the regional sources contributed 34–88 % to the peak ozone at the urban site during the selected episodes. They also showed that the ozone (and CO) peak at the downwind site (∼50 km north of Beijing) lagged behind
that at the urban site in time due to the transport of regional and Beijing plumes to the downwind rural site in the afternoon.
5
Previous studies have highlighted the importance of pollution transport to the ozone variations in Beijing and its downwind areas. However, to what extent these pollution plumes can influence and what changes in chemical characteristics of air masses oc-cur during the transport are still not well understood. In order to further reveal the impact of urban plumes on summertime ozone pollution in the downwind rural area
10
of Beijing, simultaneous measurements of O3 and its precursors (i.e. VOC, CO and NOx) were conducted at four sites located along the route of prevailing wind in the
region from June to September 2007 (this is the season that O3 episodes are often
observed). In this paper, we present the analytical results of these measurement data including the concentrations of individual trace gases and total non-methane
hydrocar-15
bons (NMHCs). The photochemical reactivity and ozone formation potential of VOCs species in the urban and rural areas of Beijing are analyzed. Furthermore, diurnal vari-ation patterns of ozone and its precursors at the urban and rural sites are compared under different prevailing wind conditions to investigate the transport effects of urban plume on the downwind area. Finally, we examine the interspecies correlations among
20
O3, CO and selected VOC species to investigate the photochemical age of air masses
at the two sites.
2 Experimental
2.1 Meteorological background and monitoring sites
Beijing municipality is located on the northwestern border of the North China Plain
25
ACPD
11, 17337–17373, 2011Measurements of ozone and its precursors in Beijing
J. Xu et al.
Title Page
Abstract Introduction
Conclusions References
Tables Figures
◭ ◮
◭ ◮
Back Close
Full Screen / Esc
Printer-friendly Version
Interactive Discussion
Discussion
P
a
per
|
Dis
cussion
P
a
per
|
Discussion
P
a
per
|
Discussio
n
P
a
per
|
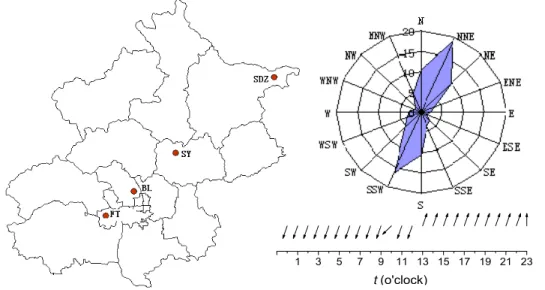
industrialized cities are close to Beijing on the southwest and southeast. Sea-land breeze and mountain-valley breeze are the two mesoscale circulations affecting the Beijing area. The mountain-valley breeze may influence the whole plain area, and the influence of sea-land breeze can reach as far as 100 km approximately into the inland. Under the influence of these two circulations, the prevailing wind is southerly from
af-5
ternoon to midnight, and then changes to northerly till forenoon. The prevailing wind rose and diurnal variation of wind direction are shown in Fig. 1.
Along to the route of prevailing wind, four sites distributed from southwest to north-east of Beijing municipality were selected to observe ozone and its precursors. These include two urban sites (FT and BL), one suburban site (SY), and one rural site (SDZ).
10
The FT and SY sites are located in the meteorological observation fields surrounded by low rising vegetation. The BL site is located in the Baolian Sports Park surrounded by residential districts. Compared to the urban sites, the SY site is relatively close to the high NOx emission sources and located about 5km away from the Sixth Round Road of Beijing. The SDZ site is one of the regional Global Atmosphere Watch (GAW)
15
stations in China. The station is located in the northern part of the North China Plain, about 100 km northeast of the Beijing metropolitan center and 55 km northeast of the Miyun County Township of Beijing, respectively. Surrounding of the station is covered with large-scale crops and sparsely populated small villages. According to afternoon prevailing wind direction, FT and BL are the upwind urban sites, and SY is the upwind
20
suburban site with respect to the downwind rural site SDZ.
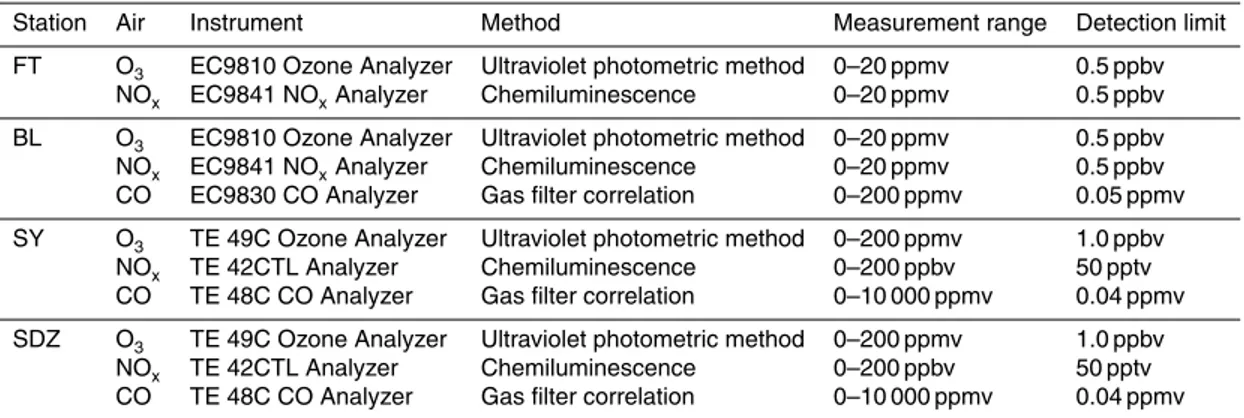
2.2 Instrumental methods
Concentrations of ozone and its precursors (CO, NO, NO2and NOx) at BL and FT
sta-tions were observed by a set of commercial instruments from Ecotech, Inc., Australia. The instruments include an EC9810 Ozone Analyzer for ozone, an EC9830 Analyzer
25
for CO, and an EC9841 Analyzer for NOx. Ozone and its precursors at SY and SDZ
ACPD
11, 17337–17373, 2011Measurements of ozone and its precursors in Beijing
J. Xu et al.
Title Page
Abstract Introduction
Conclusions References
Tables Figures
◭ ◮
◭ ◮
Back Close
Full Screen / Esc
Printer-friendly Version
Interactive Discussion
Discussion
P
a
per
|
Dis
cussion
P
a
per
|
Discussion
P
a
per
|
Discussio
n
P
a
per
|
an TE 48C Analyzer for CO, and an TE 42CTL NOxAnalyzer for NOx. Specifications of the sampling methods and instruments are shown in Table 1. Ambient air samples were drawn through a 1.5 m Teflon tube above the rooftop in both stations. The inlet was in-stalled 3.5 m above the ground. At BL and FT stations, daily zero/span checks were automatically done using a dynamic gas calibrator (Ecotech GasCal 1000) in
combi-5
nation with a zero air supply (Sabio Model 1001) and a set of standard reference gas mixtures. At SY and SDZ stations, daily zero/span checks were automatically done us-ing a dynamic gas calibrator (TE 146C) in combination with a zero air supply (TE 111) and a set of standard reference gas mixtures. Both mixtures used at the two stations were from the Chemical Metrology & Analytical Science Division, National Institute of
10
Metrology, Beijing, China. Multipoint calibrations were made every 3–6 months. For ozone, the standards are traceable to the Standard Reference Photometer (SRP) main-tained by WMO World Calibration Centre in Switzerland (EMPA). The standard gases of NO and CO were compared against NIST-traceable standards from Scott Specialty Gases, USA. After the correction of data on the basis of multipoint calibration, hourly
15
averaged data were calculated and are used for further analysis in this study.
During the experiment, 55 species of NMHCs (C2–C9) were measured and iden-tified by two-dimensional gas chromatography (GC×GC) (Xu et al., 2003) at BL and
SDZ. Morning time and afternoon time samples were collected on each Tuesday at 08:00–08:30 and 14:00–14:30, respectively. Besides, more samples were collected
20
at 06:00–06:30, 10:00–10:30, 14:00–14:30, 16:00–16:30, and 20:00–20:30 on some representative days.
3 Results and discussion
3.1 Time series overview and statistical analysis
Time series of meteorological parameters and hourly averaged O3, NOx, CO,
25
ACPD
11, 17337–17373, 2011Measurements of ozone and its precursors in Beijing
J. Xu et al.
Title Page
Abstract Introduction
Conclusions References
Tables Figures
◭ ◮
◭ ◮
Back Close
Full Screen / Esc
Printer-friendly Version
Interactive Discussion
Discussion
P
a
per
|
Dis
cussion
P
a
per
|
Discussion
P
a
per
|
Discussio
n
P
a
per
|
concentrations at the four monitoring sites had a similar day-to-day variation pattern, in accord with the variation of meteorological parameters. For example, five high-ozone episodes (21–26 June, 4–7 July, 21–27 July, 18–24 August, and 4–12 September) were observed under a meteorological condition of low relative humidity, moderate pressure, high temperature, and high solar radiation. Also, five cooling processes
hap-5
pened clearly on 27 June–3 July, 13–14 July, 30 July–7 August, 26 August, and 13–14 September, respectively. These processes almost began with a decrease in air tem-perature and solar radiation and an increase in relative humidity, which are generally associated with cold fronts followed by dry and cold air masses. With the change of weather conditions, the concentrations of air pollutants changed correspondingly.
10
Generally, when the cooling processes occurred, the pollutant levels decreased dra-matically at all sites. When the weather was controlled by stagnant high pressure systems, the pollutant concentrations accumulated gradually. The similar day-to-day variations of pollutants at all sites coincided with the meteorological conditions, reflect-ing a regional-scale character of synoptic system over urban and rural areas of Beijreflect-ing.
15
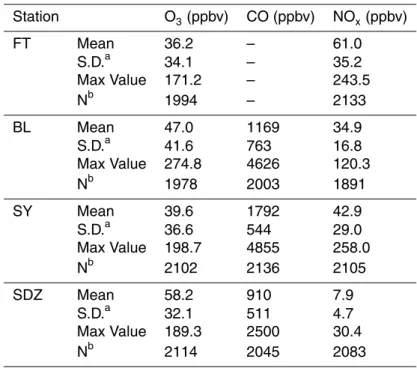
Statistical summary of hourly averaged concentrations of O3 and its precursors for
each station is given in Table 2. Mean NOx concentration observed at the SDZ site is much lower than that observed at the other three sites. As shown in Fig. 3, hourly averaged NOx concentrations at SDZ were generally less than 20 ppbv, much lower
than a rang of 30–100 ppbv observed at other sites. CO concentration observed at
20
SDZ is comparable to but in general lower than that observed at other sites (Fig. 3.). The peak CO value was about several ppmv, while the lowest value approached 100– 200 ppbv at high wind speeds (especially with northerly winds). In contrary, mean O3 mixing ratio at SDZ is much higher than that observed at other sites, due to the effect of weak titration reaction in the rural area with low NOx emissions.
25
ACPD
11, 17337–17373, 2011Measurements of ozone and its precursors in Beijing
J. Xu et al.
Title Page
Abstract Introduction
Conclusions References
Tables Figures
◭ ◮
◭ ◮
Back Close
Full Screen / Esc
Printer-friendly Version
Interactive Discussion
Discussion
P
a
per
|
Dis
cussion
P
a
per
|
Discussion
P
a
per
|
Discussio
n
P
a
per
|
further divide NMHCs into four groups, namely alkanes, alkenes, aromatics, and iso-prene, of which the first three groups are mainly emitted from anthropogenic sources. While isoprene was reported to be related to both biogenic and anthropogenic sources in Karachi, Pakistan (Barletta et al., 2005) and Hong Kong, China (So and Wang, 2004), some studies have proven that isoprene is mostly biogenic rather than anthropogenic in
5
summer in Beijing (Duan et al., 2008). As shown in Fig. 4, the estimated contributions of each divided group to the total NMHCs are: alkanes 49.1 %, alkenes 16.6 %, and aromatics 32.8 % at BL and alkanes 47.8 %, alkenes 20.1 %, and aromatics 29.4 % at SDZ, respectively. On the other hand, biogenic VOC (isoprene) contributes 1.5 % and 2.7 % to the total NMHCs at BL and SDZ, respectively. The concentration and
compo-10
sition of NMHCs at BL (SDZ) are similar to those measured at other urban (rural) site in Beijing as reported by previous studies (Xie et al., 2008; Shao et al., 2009).
The mean concentrations of integrated NMHCs are listed in Table 3. The benzene to toluene ratio (B/T) is often used to identify VOCs sources. A B/T ratio of around 0.5 (w/w) has been reported to be characteristic of vehicular emissions (Perry and Gee,
15
1995; Brocco et al., 1997), and higher B/T ratios have been reported for burning of bio-fuel, charcoal and coal (Andreae and Merlet, 2001; Moreira dos Santos et al., 2004). In this study, the B/T ratios at BL are 0.77±0.18, close to the values measured in other
Beijing urban site as reported by Duan et al. (2008), and the B/T ratios at SDZ are much higher, with values of 2.22±1.45. This result indicates that vehicular emissions
20
are main source of NMHCs in the Beijing urban area and burning of bio-fuel makes a great contribution to NMHCs in the rural area.
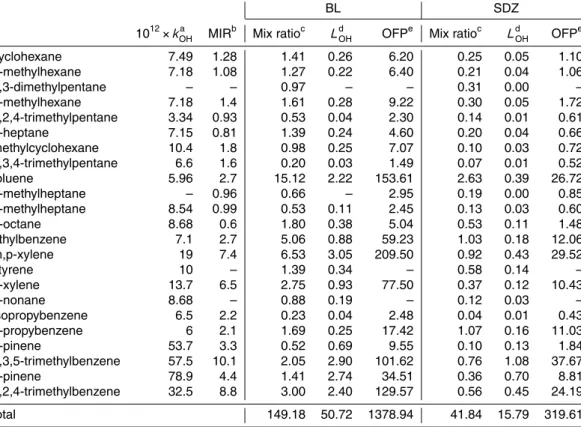
3.2 NMHCs reactivity and ozone formation potential
The OH loss rate coefficient (LOH) and the ozone formation potential (OFP) are
of-ten used to estimate the photochemical reactivity of the NMHCs (Goldan et al.,
25
2004). LOH is defined as the product of the concentration of VOCs and the rate
constant of VOCs reacting with OH (kOH, cm 3
ACPD
11, 17337–17373, 2011Measurements of ozone and its precursors in Beijing
J. Xu et al.
Title Page
Abstract Introduction
Conclusions References
Tables Figures
◭ ◮
◭ ◮
Back Close
Full Screen / Esc
Printer-friendly Version
Interactive Discussion
Discussion
P
a
per
|
Dis
cussion
P
a
per
|
Discussion
P
a
per
|
Discussio
n
P
a
per
|
VOCs concentration and the Maximum Incremental Reactivity (MIR) coefficient (di-mensionless, g O3/g VOCs) and it represents the maximum contributions of a VOCs
species to ozone formation under the optimum conditions. The LOH and OFP of
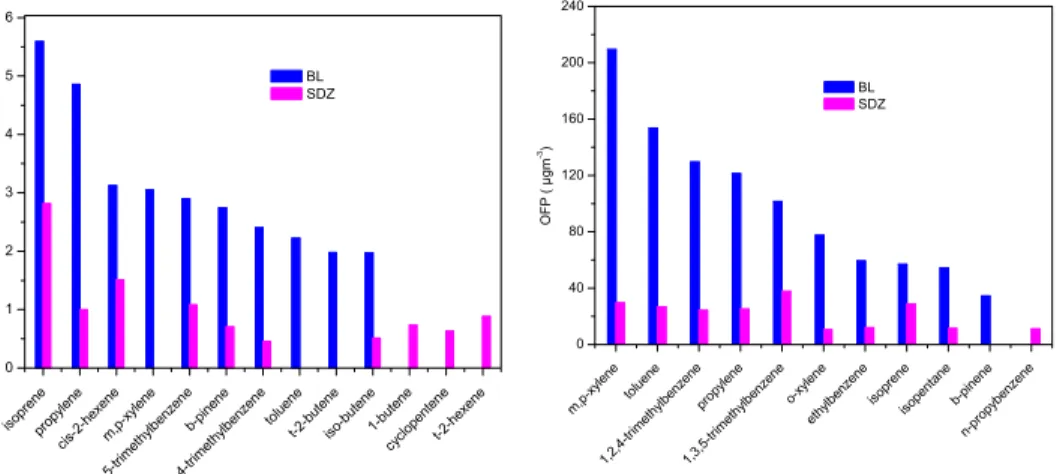
all individual NMHCs measured at BL and SDZ are listed in Table 3. The top 10 NMHCs with the largest value of LOH and OFP at each site are shown in Fig. 5. 5
The averaged consumption rate constant of OH (kOH) at the BL and SDZ sites
are 9.9×10⁻¹²cm3molecule−1s−1and 15.5×10⁻¹²cm3molecule−1s−1, respectively.
Comparing these rate constants to the reaction rate constant between isoprene and OH (kOH=8.5×10−
12
cm3molecule−1s−1), it is suggested that the reactivity of NMHCs was stronger in both urban and rural area in Beijing, especially at the rural site. During
10
the whole experiment period, the total LOH reached 50.7 s− 1
and 15.8 s−1 at the BL and SDZ sites, respectively. The total OFP reached 1379 µg m−3 and 320 µg m−3 at the BL and SDZ sites, respectively, comparable to the value of 937 µg m−3 measured
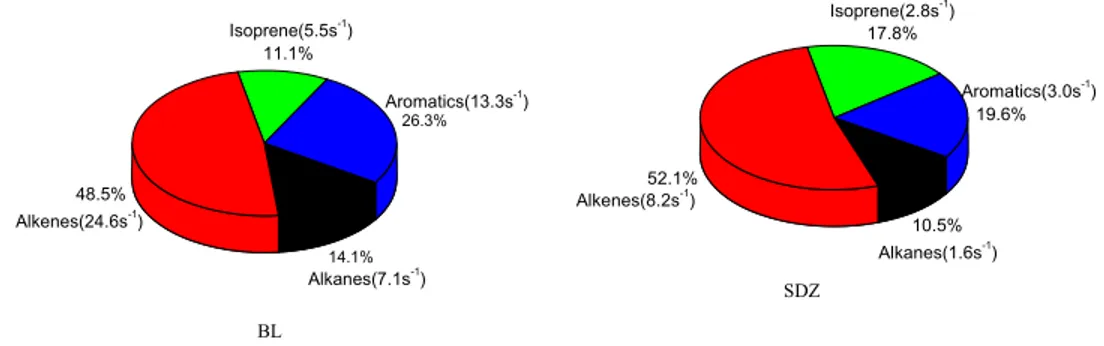
at an urban site during an ozone episode in 2006 in Beijing (Duan et al., 2008). The totalLOH and percentage contributions of alkanes, alkenes, isoprene, and aromatics 15
are shown in Fig. 6. The total OFP and percentage contributions of alkanes, alkenes, isoprene, and aromatics are shown in Fig. 7. Alkenes played a dominant role in total NMHCs reactivity at both urban and rural sites, accounting for 48.5 % and 52.1 % of totalLOH, respectively. Aromatics were dominant in ozone formation at both urban and
rural sites, accounting for 55.5 % and 49.5 % of total OFP, respectively.
20
By comparing percentage contributions toLOHand OFP of each NMHCs group
be-tween BL and SDZ sites, it is found that aromatics played a more important contribution to total NMHCs reactivity and ozone formation potential at the urban site than at the rural site. Research results by Duan et al. (2008) support the conclusion that the aro-matics play an important role in the ozone formation. Besides, the OFP of isoprene
25
was 56.9 µg m−3and 28.6 µg m−3, which account for 4.1 % and 8.9 % of the total OFP at the BL and SDZ sites, respectively. It should be noted whereas isoprene showed smaller concentration and lowerLOHand OFP values in the rural area than that in the
ACPD
11, 17337–17373, 2011Measurements of ozone and its precursors in Beijing
J. Xu et al.
Title Page
Abstract Introduction
Conclusions References
Tables Figures
◭ ◮
◭ ◮
Back Close
Full Screen / Esc
Printer-friendly Version
Interactive Discussion
Discussion
P
a
per
|
Dis
cussion
P
a
per
|
Discussion
P
a
per
|
Discussio
n
P
a
per
|
higher at the rural site. By individual species, isoprene had the largest value ofLOHfor
both urban and rural sites, and it was the second greatest contributor to total OFP at the rural site. Even at the urban site, the contribution of isoprene to ozone formation was also considerable, accounting for 4 % of total OFP.
3.3 Pollutant diurnal variations and influence of transport
5
Daily variations of pollutant concentrations can provide insight into the interplay of emissions and chemical and physical processes that operate on a diurnal cycle. Fig-ure 8 shows the average diurnal variations of NOx and O3 at the four measurement
sites. The mixing ratios of NOx at the FT, BL, and SY sites are comparable and their diurnal variation patterns are similar to each other with two peaks in the morning and
10
early evening. NOx measured at SDZ is much lower than it is at other three sites.
Interestingly, there are obvious differences in O3diurnal pattern at the four sites as in-dicated by the peak value appearing time. As shown in Fig. 8, the ozone diurnal peak value appears at 13:00, 14:00, 15:00 and 17:00 (Beijing time) at FT, BL, SY and SDZ, respectively. The ozone peak value time appeared at the upwind site FT is close to and
15
followed by the peak value time (12:00∼13:00) of solar radiation, while the ozone peak
value time at the downwind site SDZ is much later. Such peak value lagging along the route of prevailing wind from SW to NE can be attributed to the contribution of pollution transport from the up to the down wind area as discussed below.
To investigate the chemical characteristics of air masses from different regions with
20
different histories of atmospheric processing, it is necessary to segregate the bulk data into groups. We divide the data into three groups based on the diurnal variation of wind directions to look at the effect of transport on pollutant concentrations at the downwind site SDZ. The first group (denoted as Type A) refers to the days when the prevail-ing wind pattern is characterized by northeasterly at night and turnprevail-ing to southwestly
25
after sunrise. The second group (denoted as Type B) refers to the days when the prevailing winds are dominated by northwestly (270◦
∼360◦) and northeastly (0◦∼90◦).
ACPD
11, 17337–17373, 2011Measurements of ozone and its precursors in Beijing
J. Xu et al.
Title Page
Abstract Introduction
Conclusions References
Tables Figures
◭ ◮
◭ ◮
Back Close
Full Screen / Esc
Printer-friendly Version
Interactive Discussion
Discussion
P
a
per
|
Dis
cussion
P
a
per
|
Discussion
P
a
per
|
Discussio
n
P
a
per
|
characterized by southwestly (180◦
∼270◦). Considering the location of SDZ, the air
mass of Type B has slightly been impacted by anthropogenic emissions and can be assigned as clean air mass, and the air mass of Type C contains the signature of ur-ban pollution transportation. The difference in the diurnal variation of wind directions between BL and SDZ is small for each type, indicating that the winds at the two sites
5
were basically affected by the large-scale air flow.
As shown in Fig. 9, the diurnal variation of O3 at BL shows a typical pattern for large polluted cities, with minimum values in the early morning, a strong rise during the morning with the increasing solar radiation, peak mixing ratios at about 14:00, and a decline due to ozone destruction by NO during night time (Lal et al., 2000; Zhang and
10
Kim Oanh, 2002; Mazzeo et al., 2005; Ribas and Pe uelas, 2004; Duenas et al., 2002). While there is no large difference in the diurnal variation of O3for the three types at BL,
different features are found for SDZ. Compared to BL, the O3 peak observed at SDZ was delayed for several hours, with a value being close to that at BL in Type A, much lower in Type B, and higher in Type C. These reveal that surface O3 was controlled 15
predominantly by photochemical reaction at BL, and at SDZ it was profoundly affected by the transportation from upwind urban areas. According to the definition of Liu (Liu, 1977), “total oxidant” (Ox=O3+NO2) production is more representative for the real
photochemical production than that of ozone. The Oxmixing ratio observed at SDZ is lower for Type A in the late morning and early afternoon and much lower for Type B in
20
the daytime and evening. Interestingly, for Type C in the late afternoon and evening, both O3 and Ox mixing ratio are higher at SDZ than at BL. High concentrations of O3 at a rural site can only come from two processes. One is in situ photochemical pro-duction, and the other is transport from the urban area. CO at SDZ is obviously lower in Type B and higher in Type C corresponding to the clean and polluted air masses,
25
respectively. Since Ox at SDZ is also higher, higher O3 at SDZ cannot be explained
ACPD
11, 17337–17373, 2011Measurements of ozone and its precursors in Beijing
J. Xu et al.
Title Page
Abstract Introduction
Conclusions References
Tables Figures
◭ ◮
◭ ◮
Back Close
Full Screen / Esc
Printer-friendly Version
Interactive Discussion
Discussion
P
a
per
|
Dis
cussion
P
a
per
|
Discussion
P
a
per
|
Discussio
n
P
a
per
|
with background atmosphere in the rural area. Strong influence of urban plumes from Beijing on air quality in the rural area has also been observed by Wang et al. (2006); Lin et al. (2008b). Note that such ozone peak lagging was observed at another down-wind rural site of Beijing during the 2008 Olympics as reported by Wang et al. (2010). In contrary to this study, however, they also showed a lagged ozone peak at the upwind
5
rural site in relative to the urban site. It is indicated that in addition to the transport local photochemistry plays an important role in the diurnal variation of ozone at urban and rural areas.
3.4 Interspecies correlations and chemical aging of air masses
3.4.1 Correlation of O3and CO
10
CO can be considered as an air pollution transport indicator due to its lifetime of ap-proximately 1 month in the summer. By examining the correlation between O3 and
CO, the atmospheric processes of air masses arrived at a monitoring site can be re-flected. During entire measurement period, the correlation coefficients between O3
and CO measured at BL and SDZ are−0.06 and 0.2, respectively. Poor correlations
15
imply that the concentrations measured at the two sites were affected by complicated processes. Figure 10. shows scatter plots of O3and CO for photochemical active
af-ternoon hours (13:00∼18:00) observed at the two sites. A moderately good positive
correlation (r=0.52) is presented for SDZ with a slope of 0.04, while there is either a lack of correlation or a weak slope for BL. This phenomenon also appeared in the
20
aged air mass flow from marine and the fresh air mass flow from continent in Hong Kong (Wang et al., 2003). As shown in Fig. 1, the prevailing wind direction was south-west in the afternoon, bringing air masses from the urban to the rural area. Thus, the moderately good positive O3-CO correlation observed at the downwind site SDZ can
be attributed to the transportation of air masses loading large amount of anthropogenic
25
ACPD
11, 17337–17373, 2011Measurements of ozone and its precursors in Beijing
J. Xu et al.
Title Page
Abstract Introduction
Conclusions References
Tables Figures
◭ ◮
◭ ◮
Back Close
Full Screen / Esc
Printer-friendly Version
Interactive Discussion
Discussion
P
a
per
|
Dis
cussion
P
a
per
|
Discussion
P
a
per
|
Discussio
n
P
a
per
|
3.4.2 Correlation of NMHCs species with different lifetimes
The ratios of VOCs with different photochemical lifetimes can be used to examine the atmospheric processes of air masses, including atmospheric transport and photochem-ical aging (Nelson and Quigley, 1983). Due to different lifetimes of two given VOC species, their ratio may change during the course of air mass transport. For the ratio
5
of a more reactive VOC to a less reactive VOC, a higher ratio value indicates relatively little photochemical processing of an air mass and major impact from local emissions. On the other hand, a lower ratio value is reflective of more aged VOC mixes and thus presumably that the VOCs were emitted from longer distant sources. Comparisons of the ratios among sites can be used to estimate the relative ages of air parcels and help
10
to provide the evidence of transport histories. Moreover, this ratio analysis can fur-ther indicate whefur-ther the site is dominantly affected by pollutants from local or regional sources. In the analysis presented here, we use the ratios of m, p-xylene/ethylbenzene and i-butane/propane at the two sites as a metric of atmospheric processing in different air masses (So and Wang, 2003; Guo et al., 2007; Zhang et al., 2008a). m, p-xylene
15
and ethylbenzene are mainly emitted from vehicles and solvent usage, whereas isobu-tane and propane have an origin of liquefied petroleum gas emission (Guo et al.,2007). m, p-xylene is more reactive than ethylbenzene, with lifetimes about 1 and 2 days, re-spectively; isobutane also has a shorter lifetime than propane, with lifetimes of about 6 and 12 days, respectively. Figure 11 shows the scatter plots of m, p-xylene to
ethylben-20
zene and isobutane to propane at the BL and SDZ sites. Clearly, BL has higher slopes than SDZ for both VOC ratios, with an m, p-xylene/ethylbenzene ratio of 1.60 (versus 1.13 at SDZ), and an isobutane/propane ratio of 0.71 (versus 0.61 at SDZ). The re-sults suggest that air masses at SDZ were more aged than those at BL, reflecting the importance of regional transport at the SDZ site.
ACPD
11, 17337–17373, 2011Measurements of ozone and its precursors in Beijing
J. Xu et al.
Title Page
Abstract Introduction
Conclusions References
Tables Figures
◭ ◮
◭ ◮
Back Close
Full Screen / Esc
Printer-friendly Version
Interactive Discussion
Discussion
P
a
per
|
Dis
cussion
P
a
per
|
Discussion
P
a
per
|
Discussio
n
P
a
per
|
3.4.3 Correlation of O3with photochemical age
To further investigate the relationship between observed O3 concentration and
pho-tochemical aging degree of air masses at the two monitoring sites, we use the m, p-xylenes/ethylbenzene ratio as a metric of photochemical age (Zhang et al., 2008a). As we expected, the m, p-xylenes/ethylbenzene ratio and O3 concentration observed 5
during morning time (08:00∼08:30) dose not show good correlation at both sites (not
shown here). During the hours following sunrise, surface ozone concentrations in-crease due to two factors: local ozone production through conversion of ozone pre-cursors and downward entrainment of ozone from the upper residual layer (Rao et al., 2003). The poor correlation indicates that entrainment of air from the O3-rich residual
10
layer trapped aloft is important to the accumulation of surface ozone during morning time at both urban and rural sites. Figure 12. shows the relation between the m, p-xylenes/ethylbenzene ratio and O3 concentration observed during photochemically active afternoon time (around ozone peak time 14:00∼14:30) at the two sites. At SDZ,
higher O3concentrations coincide with greater photochemical age. However, at BL sur-15
face ozone concentration seems to be not highly correlated with photochemical age.
4 Summary and conclusions
O3and its precursors were measured at the four sites located along the route of prevail-ing wind in the Beijprevail-ing area from June to September 2007. Similar day-to-day variation patterns of pollutants were observed at these sites, indicating that the meteorological
20
conditions in urban and rural areas of Beijing are influenced by regional-scale charac-teristics of synoptic system. The average levels of primary gases, especially reactive gases NOx and NMHCs at the downwind rural site SDZ, are much lower than those
observed at other sites. The level of long-lived gas CO at the SDZ site is comparable to but slightly lower than it is at urban sites, due to regional transportation. In contrary,
in-25
fluenced by strong titration reaction with NO, the mean mixing ratios of O3at the urban
ACPD
11, 17337–17373, 2011Measurements of ozone and its precursors in Beijing
J. Xu et al.
Title Page
Abstract Introduction
Conclusions References
Tables Figures
◭ ◮
◭ ◮
Back Close
Full Screen / Esc
Printer-friendly Version
Interactive Discussion
Discussion
P
a
per
|
Dis
cussion
P
a
per
|
Discussion
P
a
per
|
Discussio
n
P
a
per
|
In spite of lower integrated NMHCs concentrations, the percentage contributions of some components such as alkenes and isoprene are obviously higher at the rural site than at the urban site. Measured NMHCs were used to estimate the photochemical reactivity (LOH) and the ozone formation potential (OFP) in the urban (BL) and rural
(SDZ) areas of Beijing. The total LOH is estimated to be 50.7 s− 1
and 15.8 s−1 at
5
the urban and rural sites, respectively. Alkenes play a dominant role in total NMHCs reactivity at both urban and rural sites, accounting for 48.5 % and 52.1 % of totalLOH,
respectively. The total OFP is estimated to be 1379 µg m−3and 320 µg m−3at the urban and rural sites, respectively, Aromatics are dominant in ozone formation at both urban and rural sites, accounting for 55.5 % and 49.5 % of total OFP, respectively.
10
Observed diurnal variation patterns of NOxare different between the urban and rural
sites due to the effects of both local emissions, e.g., from traffic, and changing me-teorological conditions. While the O3diurnal variations at the four sites are typical of polluted areas in general, the O3 peaks are found to appear at different time, being
earlier at the upwind site (e.g., 14:00 for BL) and later at the downwind site (e.g., 17:00
15
for SDZ). Such peak value lagging along the route of prevailing wind from SW to NE is attributed to the transport of both O3 and its precursors from the up wind to the down
wind area.
Meteorological data analysis shows that the SDZ site is affected by different air mass types, resulting in significant difference in the diurnal variation of O3observed at SDZ. 20
In the air masses characterized by urban pollution transport, both O3and Oxare higher
at SDZ than at BL. This cannot be fully explained with the weaker O3 titration by NO at SDZ than at BL, but indicate more photochemical O3production when urban plume
being mixed with background atmosphere in the rural area. Observed O3 is shown to
have a good correlation with CO as well as polluted air mass age at SDZ, The results
25
ACPD
11, 17337–17373, 2011Measurements of ozone and its precursors in Beijing
J. Xu et al.
Title Page
Abstract Introduction
Conclusions References
Tables Figures
◭ ◮
◭ ◮
Back Close
Full Screen / Esc
Printer-friendly Version
Interactive Discussion
Discussion
P
a
per
|
Dis
cussion
P
a
per
|
Discussion
P
a
per
|
Discussio
n
P
a
per
|
Acknowledgements. This work was supported by NSFC41075111, NSFC40775074,
GYHY200806027, and BNSF8082012. The authors would like to thank the staffof the
Shang-dianzi station for carrying out the measurements.
References
An, J. L.: Ozone production efficiency in Beijing area with high NOx emissions, Acta Scientiae
5
Circumstantiae, 26, 652–657, 2006.
Andreae, M. O. and Merlet, P.: Emission of trace gases and aerosols from biomass burning, Global Biogeochem. Cy., 15, 955–966, 2001.
Atkinson, R. and Arey, J.: Atmospheric degradation of volatile organic compounds, Chem. Rev., 103, 4605–4638, 2003.
10
Barletta, B., Meinardi, S., Sherwood Rowland, F., Chan, C. Y., Wang, X., Zou, S., Yin Chan, L., and Blake, D. R.: Volatile organic compounds in 43 Chinese cities, Atmos. Environ., 39, 5979–5990, 2005.
Brocco, D., Fratarcangeli, R., Lepore, L., Petricca, M., and Ventrone, I.: Determination of aro-matic hydrocarbons in urban air of Rome, Atmos. Environ., 31, 557–566, 1997.
15
Carter, W. P. L.: Development of ozone reactivity scales for volatile organic compounds, J. Air Waste Manage. Assoc., 44, 881–889, 1994.
Chan, C. Y., Chan, L. Y., Cui, H., Zheng, X. D., Zheng, Y. G., Qin, Y., and Li, Y. S.: Origin of the springtime tropospheric ozone maximum over east China at LinAn in 2001, Tellus 55B, 55, 982–992, 2003.
20
Cheung, V. T. F. and Wang, T.: Observational study of ozone pollution at a rural site in the Yangtze Delta of China, Atmos. Environ., 35, 4947–4958, 2001.
Chou, C. C. K., Tsai, C. Y., Shiu, C. J., Liu, S. C., and Zhu, T.: Measurement of NOy during Cam-paign of Air Quality Research in Beijing 2006 (CAREBeijing-2006): Implications for the ozone
production efficiency of NOx, J. Geophys. Res., 114, D00G01, doi:10.1029/2008JD010446,
25
2009.
Ding, A., Wang, T., Zhao, M., Wang, T., and Li, Z.: Simulation of sea-land breezes and a discussion of their implications on the transport of air pollution during a multi-day ozone episode in the Pearl River Delta of China, Atmos. Environ., 38, 6737–6750, 2004.
Duan, J., Tan, J., Yang, L., Wu, S., and Hao, J.: Concentration, sources and ozone formation
ACPD
11, 17337–17373, 2011Measurements of ozone and its precursors in Beijing
J. Xu et al.
Title Page
Abstract Introduction
Conclusions References
Tables Figures
◭ ◮
◭ ◮
Back Close
Full Screen / Esc
Printer-friendly Version
Interactive Discussion
Discussion
P
a
per
|
Dis
cussion
P
a
per
|
Discussion
P
a
per
|
Discussio
n
P
a
per
|
potential of volatile organic compounds (VOCs) during ozone episode in Beijing, Atmos. Res., 88, 25–35, 2008.
Duenas, C., Fern ´andez, M. C., Ca ete, S., Carretero, J., and Liger, E.: Assessment of ozone
variations and meteorological effects in an urban area in the Mediterranean Coast, Sci. Total
Environ., 299, 97–113, 2002.
5
Geng, F., Zhao, C., Tang, X., Lu, G., and Tie, X.: Analysis of ozone and VOCs measured in Shanghai: A case study, Atmos. Environ., 41, 989–1001, 2007.
Goldan, P. D., Kuster, W. C., Williams, E., Murphy, P. C., Fehsenfeld, F. C., and Meagher, J.: Nonmethane hydrocarbon and oxy hydrocarbon measurements during the 2002 New Eng-land Air Quality Study, J. Geophys. Res., 109, D21309, doi:21310.21029/22003JD004455,
10
2004.
Guo, H., So, K. L., Simpson, I. J., Barletta, B., Meinardi, S., and Blake, D. R.: C1-C8 volatile organic compounds in the atmosphere of Hong Kong: Overview of atmospheric processing and source apportionment, Atmos. Environ., 41, 1456–1472, 2007.
Hao, J. and Wang, L.: Improving urban air quality in China: Beijing case study, J. Air Waste
15
Manage. Assoc., 55, 1298–1305, 2005.
Lal, S., Naja, M., and Subbaraya, B. H.: Seasonal variations in surface ozone and its precursors over an urban site in India, Atmos. Environ., 34, 2713–2724, 2000.
Lam, K. S., Wang, T. J., Wu, C. L., and Li, Y. S.: Study on an ozone episode in hot season in Hong Kong and transboundary air pollution over Pearl River Delta region of China, Atmos.
20
Environ., 39, 1967–1977, 2005.
Lin, W., Xu, X., Zhang, X., and Tang, J.: Contributions of pollutants from North China Plain to surface ozone at the Shangdianzi GAW station, Atmos. Chem. Phys. Discuss., 8, 9139– 9165, doi:10.5194/acpd-8-9139-2008, 2008a.
Lin, W., Xu, X., Zhang, X., and Tang, J.: Contributions of pollutants from North China Plain
25
to surface ozone at the Shangdianzi GAW Station, Atmos. Chem. Phys., 8, 5889–5898, doi:10.5194/acp-8-5889-2008, 2008b.
Liu, S. C.: Possible effects on fropospheric O3 and OH due to NO emissions, Geophys. Res.
Lett., 4, 325–328, 1977.
Lu, K. D., Zhang, Y. H., Su, H., Brauers, T., Chou, C. C., Hofzumahaus, A., Liu, S. C., Kita,
30
K., Kondo, Y., Shao, M., Wahner, A., Wang, J. L., Wang, X. S., and Zhu, T.: Oxidant (O3 +
NO2) production processes and formation regimesin Beijing, J. Geophys. Res., 115, D07303,
ACPD
11, 17337–17373, 2011Measurements of ozone and its precursors in Beijing
J. Xu et al.
Title Page
Abstract Introduction
Conclusions References
Tables Figures
◭ ◮
◭ ◮
Back Close
Full Screen / Esc
Printer-friendly Version
Interactive Discussion
Discussion
P
a
per
|
Dis
cussion
P
a
per
|
Discussion
P
a
per
|
Discussio
n
P
a
per
|
Mazzeo, N. A., Venegas, L. E., and Choren, H.: Analysis of NO, NO2, O3 and NOx concentra-tions measured at a green area of Buenos Aires City during wintertime, Atmos. Environ., 39, 3055–3068, 2005.
Meng, Z. Y., Xu, X. B., Yan, P., Ding, G. A., Tang, J., Lin, W. L., Xu, X. D., and Wang, S. F.: Characteristics of trace gaseous pollutants at a regional background station in Northern
5
China, Atmos. Chem. Phys., 9, 927–936, doi:10.5194/acp-9-927-2009, 2009.
Moreira dos Santos, C. Y., de Almeida Azevedo, D., and de Aquino Neto, F. R.: Atmospheric distribution of organic compounds from urban areas near a coal-fired power station, Atmos. Environ., 38, 1247–1257, 2004.
Nelson, P. F. and Quigley, S. M.: The m, p-xylenes: ethylbenzene ratio. A technique for
estimat-10
ing hydrocarbon age in ambient atmospheres, Atmos. Environ., 17, 659–662, 1983.
Perry, R. and Gee, I. L.: Vehicle emissions in relation to fuel composition, Sci. Total Environ., 169, 149–156, 1995.
Ran, L., Zhao, C., Geng, F., Tie, X., Tang, X., Peng, L., Zhou, G., Yu, Q., Xu, J., and Guenther, A.: Ozone photochemical production in urban Shanghai, China: Analysis based on ground
15
level observations, J. Geophys. Res., 114, D15301, doi:15310.11029/12008JD010752, 2009.
Rao, S. T., Ku, J. Y., Berman, S., Zhang, K., and Mao, H.: Summertime characteristics of the atmospheric boundary layer and relationships to ozone levels over the eastern United States, Pure Appl. Geophys., 160, 21–55, 2003.
20
Ribas, A. and Peuelas, J.: Temporal patterns of surface ozone levels in different habitats of the
North Western Mediterranean basin, Atmos. Environ., 38, 985–992, 2004.
Shao, M., Tang, X., Zhang, Y., and Li, W.: City clusters in China: air and surface water pollution, Front. Ecol. Environ., 4, 353–361, 2006.
Shao, M., Lu, S., Liu, Y., Xie, X., Chang, C., Huang, S., and Chen, Z.: Volatile organic
com-25
pounds measured in summer in Beijing and their role in ground-level ozone formation, J. Geophys. Res., 114, D00G06, doi:10.1029/2008JD010863, 2009.
So, K. L. and Wang, T.: On the local and regional influence on ground-level ozone concentra-tions in Hong Kong, Environ. Pollut., 123, 307–317, 2003.
So, K. L. and Wang, T.: C3-C12 non-methane hydrocarbons in subtropical Hong Kong:
spatial-30
temporal variations, source-receptor relationships and photochemical reactivity, Sci. Total Environ., 328, 161–174, 2004.
ACPD
11, 17337–17373, 2011Measurements of ozone and its precursors in Beijing
J. Xu et al.
Title Page
Abstract Introduction
Conclusions References
Tables Figures
◭ ◮
◭ ◮
Back Close
Full Screen / Esc
Printer-friendly Version
Interactive Discussion
Discussion
P
a
per
|
Dis
cussion
P
a
per
|
Discussion
P
a
per
|
Discussio
n
P
a
per
|
in Beijing, 2001–2006, Atmos. Chem. Phys., 9, 8813–8823, doi:10.5194/acp-9-8813-2009, 2009.
Tang, X., Wang, Z., Zhu, J., Gbaguidi, A. E., Wu, Q. Z., Li, J., and Zhu, T.: Sensitivity of ozone to precursor emissions in urban Beijing with a Monte Carlo scheme, Atmos. Environ., 44, 3833–3842, 2010.
5
Wang, B., Shao, M., Lu, S. H., Yuan, B., Zhao, Y., Wang, M., Zhang, S. Q., and Wu, D.: Variation of ambient non-methane hydrocarbons in Beijing city in summer 2008, Atmos. Chem. Phys., 10, 5911–5923, doi:10.5194/acp-10-5911-2010, 2010.
Wang, T. and Kwok, J. Y. H.: Measurement and analysis of a multiday photochemical smog episode in the Pearl River delta of China, J. Appl. Meteorol., 42, 404–416, 2003.
10
Wang, T., Ding, A. J., Blake, D. R., Zahorowski, W., Poon, C. N., and Li, Y. S.: Chemical characterization of the boundary layer outflow of air pollution to Hong Kong during February– April 2001, J. Geophys. Res., 108, 8787, doi:10.1029/2002JD003272, 2003.
Wang, T., Ding, A., Gao, J., and Wu, W. S.: Strong ozone production in urban plumes from Beijing, China, Geophys. Res. Lett., 33, L21806, doi:21810.21029/22006GL027689, 2006.
15
Wang, T., Nie, W., Gao, J., Xue, L. K., Gao, X. M., Wang, X. F., Qiu, J., Poon, C. N., Meinardi, S., Blake, D., Wang, S. L., Ding, A. J., Chai, F. H., Zhang, Q. Z., and Wang, W. X.: Air quality during the 2008 Beijing Olympics: secondary pollutants and regional impact, Atmos. Chem. Phys., 10, 7603–7615, doi:10.5194/acp-10-7603-2010, 2010.
Wang, Y., McElroy, M. B., Munger, J. W., Hao, J., Ma, H., Nielsen, C. P., and Chen, Y.: Variations
20
of O3and CO in summertime at a rural site near Beijing, Atmos. Chem. Phys., 8, 6355–6363,
doi:10.5194/acp-8-6355-2008, 2008.
Xie, X., Shao, M., Liu, Y., Lu, S., Chang, C. C., and Chen, Z. M.: Estimate of initial isoprene contribution to ozone formation potential in Beijing, China, Atmos. Environ., 42, 6000–6010, 2008.
25
Xu, X., Stee, L. L. P., Williams, J, Beens, J., Adahchour, M., Vreuls, R. J. J., Brinkman, U. A.,
and Lelieveld, J.: Comprehensive two-dimensional gas chromatography (GC×GC)
mea-surements of volatile organic compounds in the atmosphere, Atmos. Chem. Phys., 3, 665– 682, doi:10.5194/acp-3-665-2003, 2003.
Yuan, Z. B., Lau, A. K. H., Shao, M., and Louie, P. K. K.: Source analysis of volatile organic
30
compounds by positive matrix factorization in urban and rural environments in Beijing, J. Geophys. Res., 114, D00G15, doi:10.1029/2008JD011190, 2009.
ACPD
11, 17337–17373, 2011Measurements of ozone and its precursors in Beijing
J. Xu et al.
Title Page
Abstract Introduction
Conclusions References
Tables Figures
◭ ◮
◭ ◮
Back Close
Full Screen / Esc
Printer-friendly Version
Interactive Discussion
Discussion
P
a
per
|
Dis
cussion
P
a
per
|
Discussion
P
a
per
|
Discussio
n
P
a
per
|
Region of Thailand in relation to O3precursor concentrations and meteorological conditions,
Atmos. Environ., 36, 4211–4222, 2002.
Zhang, J., Wang, T., Chameides, W. L., Cardelino, C., Blake, D. R., and Streets, D. G.: Source characteristics of volatile organic compounds during high ozone episodes in Hong Kong, Southern China, Atmos. Chem. Phys., 8, 4983–4996, doi:10.5194/acp-8-4983-2008, 2008a.
5
Zhang, Y. H. and Lu, K. D.: The dependence of ozone production rate on ozone precursors in the Beijing and Pearl River Delta regions, 2004–2009, IGACtivity News Letter, 42, 26–38, 2009.
Zhang, Y. H., Su, H., Zhong, L. J., Cheng, Y. F., Zeng, L. M., Wang, X. S., Xiang, Y. R., Wang, J. L., Gao, D. F., and Shao, M.: Regional ozone pollution and observation-based approach
10
ACPD
11, 17337–17373, 2011Measurements of ozone and its precursors in Beijing
J. Xu et al.
Title Page
Abstract Introduction
Conclusions References
Tables Figures
◭ ◮
◭ ◮
Back Close
Full Screen / Esc
Printer-friendly Version
Interactive Discussion
Discussion
P
a
per
|
Dis
cussion
P
a
per
|
Discussion
P
a
per
|
Discussio
n
P
a
per
|
Table 1.Specifications of instruments and sampling methods.
Station Air Instrument Method Measurement range Detection limit
FT O3 EC9810 Ozone Analyzer Ultraviolet photometric method 0–20 ppmv 0.5 ppbv
NOx EC9841 NOxAnalyzer Chemiluminescence 0–20 ppmv 0.5 ppbv
BL O3 EC9810 Ozone Analyzer Ultraviolet photometric method 0–20 ppmv 0.5 ppbv
NOx EC9841 NOxAnalyzer Chemiluminescence 0–20 ppmv 0.5 ppbv
CO EC9830 CO Analyzer Gas filter correlation 0–200 ppmv 0.05 ppmv
SY O3 TE 49C Ozone Analyzer Ultraviolet photometric method 0–200 ppmv 1.0 ppbv
NOx TE 42CTL Analyzer Chemiluminescence 0–200 ppbv 50 pptv
CO TE 48C CO Analyzer Gas filter correlation 0–10 000 ppmv 0.04 ppmv
SDZ O3 TE 49C Ozone Analyzer Ultraviolet photometric method 0–200 ppmv 1.0 ppbv
NOx TE 42CTL Analyzer Chemiluminescence 0–200 ppbv 50 pptv
ACPD
11, 17337–17373, 2011Measurements of ozone and its precursors in Beijing
J. Xu et al.
Title Page
Abstract Introduction
Conclusions References
Tables Figures
◭ ◮
◭ ◮
Back Close
Full Screen / Esc
Printer-friendly Version
Interactive Discussion
Discussion
P
a
per
|
Dis
cussion
P
a
per
|
Discussion
P
a
per
|
Discussio
n
P
a
per
|
Table 2. Statistical summary of hourly averaged concentrations of O3 and its precursors for
each station.
Station O3(ppbv) CO (ppbv) NOx (ppbv)
FT Mean 36.2 – 61.0
S.D.a 34.1 – 35.2
Max Value 171.2 – 243.5
Nb 1994 – 2133
BL Mean 47.0 1169 34.9
S.D.a 41.6 763 16.8
Max Value 274.8 4626 120.3
Nb 1978 2003 1891
SY Mean 39.6 1792 42.9
S.D.a 36.6 544 29.0
Max Value 198.7 4855 258.0
Nb 2102 2136 2105
SDZ Mean 58.2 910 7.9
S.D.a 32.1 511 4.7
Max Value 189.3 2500 30.4
Nb 2114 2045 2083
ACPD
11, 17337–17373, 2011Measurements of ozone and its precursors in Beijing
J. Xu et al.
Title Page
Abstract Introduction
Conclusions References
Tables Figures
◭ ◮
◭ ◮
Back Close
Full Screen / Esc
Printer-friendly Version
Interactive Discussion
Discussion
P
a
per
|
Dis
cussion
P
a
per
|
Discussion
P
a
per
|
Discussio
n
P
a
per
|
Table 3.Chemical characteristics of NMHCs at the BL and SDZ sites.
BL SDZ
1012×kOHa MIR b
Mix ratioc LdOH OFP e
Mix ratioc LdOH OFP e
ethane 0.26 0.25 2.18 0.01 0.67 1.16 0.01 0.36
ethylene 8.52 7.4 1.69 0.35 14.32 0.87 0.18 7.37
propane 1.15 0.48 11.15 0.32 9.63 3.53 0.10 3.05
propylene 26.3 9.4 7.51 4.86 121.27 1.55 1.00 25.03
iso-butane 2.12 1.21 8.62 0.45 23.89 2.27 0.12 6.29
n-butane 2.54 1.02 1.46 0.09 3.53 1.31 0.08 3.17
acetylene 0.83 – 1.05 0.02 – 0.72 0.01 –
t-2-butene 64 10 1.26 1.98 28.86 0.20 0.31 4.58
iso-butene 51.4 5.3 1.56 1.97 18.94 0.40 0.51 4.86
1-butene 31.4 – 2.13 1.65 – 0.95 0.73 –
cis-2-butene 56.4 10 0.96 1.33 21.99 0.23 0.32 5.27
cyclopentane 5.16 2.4 0.64 0.08 4.40 0.22 0.03 1.51
isopentane 3.6 1.38 13.36 1.18 54.29 2.79 0.25 11.34
n-pentane 3.94 1.04 6.24 0.60 19.11 1.60 0.16 4.90
2-m-2-butene 68.9 6.4 0.36 0.61 5.28 0.15 0.25 2.20
cyclopentene 67 – 0.28 0.46 – 0.38 0.63 –
t-2-pentene 67 8.8 0.39 0.64 9.83 0.08 0.13 2.02
3-m-1-butene 31.8 6.2 0.55 0.43 7.81 0.10 0.08 1.42
1-pentene 31.4 6.2 0.65 0.50 11.54 0.28 0.22 4.97
cis-2-pentene 65 8.8 0.75 1.20 18.90 0.18 0.29 4.53
2,2-dimethylbutane 2.23 0.82 1.53 0.08 4.41 1.41 0.08 4.07
2,3-dimethylbutane 6.3 1.07 1.50 0.23 5.65 0.69 0.11 2.60
2-methylpentane 5.6 1.5 4.09 0.56 21.58 0.74 0.10 3.90
3-methylpentane 5.7 1.5 3.12 0.44 16.46 0.74 0.10 3.90
isoprene 101 9.1 2.25 5.59 56.95 1.13 2.81 28.60
4-m-1-pentene – – 0.29 – – 0.12 0.00 –
2-m-1-pentene 68.9 – 0.34 0.58 – 0.19 0.32 –
n-hexane 5.61 0.98 4.35 0.60 14.99 0.57 0.08 1.96
t-2-hexene 62.6 – 0.99 1.52 – 0.57 0.88 –
cis-2-hexene 62.7 – 2.02 3.12 – 0.98 1.51 –
methylcyclopentane 7.05 2.8 2.81 0.49 27.03 0.40 0.07 3.85
ACPD
11, 17337–17373, 2011Measurements of ozone and its precursors in Beijing
J. Xu et al.
Title Page
Abstract Introduction
Conclusions References
Tables Figures
◭ ◮
◭ ◮
Back Close
Full Screen / Esc
Printer-friendly Version
Interactive Discussion
Discussion
P
a
per
|
Dis
cussion
P
a
per
|
Discussion
P
a
per
|
Discussio
n
P
a
per
|
Table 3.Continued.
BL SDZ
1012×kOHa MIR
b Mix ratioc
LdOH OFP
e Mix ratioc
LdOH OFP
e
cyclohexane 7.49 1.28 1.41 0.26 6.20 0.25 0.05 1.10
2-methylhexane 7.18 1.08 1.27 0.22 6.40 0.21 0.04 1.06
2,3-dimethylpentane – – 0.97 – – 0.31 0.00 –
3-methylhexane 7.18 1.4 1.61 0.28 9.22 0.30 0.05 1.72
2,2,4-trimethylpentane 3.34 0.93 0.53 0.04 2.30 0.14 0.01 0.61
n-heptane 7.15 0.81 1.39 0.24 4.60 0.20 0.04 0.66
methylcyclohexane 10.4 1.8 0.98 0.25 7.07 0.10 0.03 0.72
2,3,4-trimethylpentane 6.6 1.6 0.20 0.03 1.49 0.07 0.01 0.52
toluene 5.96 2.7 15.12 2.22 153.61 2.63 0.39 26.72
2-methylheptane – 0.96 0.66 – 2.95 0.19 0.00 0.85
3-methylheptane 8.54 0.99 0.53 0.11 2.45 0.13 0.03 0.60
n-octane 8.68 0.6 1.80 0.38 5.04 0.53 0.11 1.48
ethylbenzene 7.1 2.7 5.06 0.88 59.23 1.03 0.18 12.06
m,p-xylene 19 7.4 6.53 3.05 209.50 0.92 0.43 29.52
styrene 10 – 1.39 0.34 – 0.58 0.14 –
o-xylene 13.7 6.5 2.75 0.93 77.50 0.37 0.12 10.43
n-nonane 8.68 – 0.88 0.19 – 0.12 0.03 –
isopropybenzene 6.5 2.2 0.23 0.04 2.48 0.04 0.01 0.43
n-propybenzene 6 2.1 1.69 0.25 17.42 1.07 0.16 11.03
a-pinene 53.7 3.3 0.52 0.69 9.55 0.10 0.13 1.84
1,3,5-trimethylbenzene 57.5 10.1 2.05 2.90 101.62 0.76 1.08 37.67
b-pinene 78.9 4.4 1.41 2.74 34.51 0.36 0.70 8.81
1,2,4-trimethylbenzene 32.5 8.8 3.00 2.40 129.57 0.56 0.45 24.19
total 149.18 50.72 1378.94 41.84 15.79 319.61
aRate constant of NMHCs reaction with OH at 298 K (cm3molecule−1s−1) (Atkinson and Arey, 2003). bMIR denotes maximum incremental reactivity (g O
3/g VOCs). (Carter, 1994; Ran et al., 2009). cVolumetric mixture ratio, ppbv.
d[VOC]
×kOH, s−1. e[VOC]
ACPD
11, 17337–17373, 2011Measurements of ozone and its precursors in Beijing
J. Xu et al.
Title Page
Abstract Introduction
Conclusions References
Tables Figures
◭ ◮
◭ ◮
Back Close
Full Screen / Esc
Printer-friendly Version
Interactive Discussion
Discussion
P
a
per
|
Dis
cussion
P
a
per
|
Discussion
P
a
per
|
Discussio
n
P
a
per
|
1 3 5 7 9 11 13 15 17 19 21 23
t (o'clock)
Fig. 1. Sites location and pattern and diurnal variation of prevailing wind. (FT: FengTai; BL:
ACPD
11, 17337–17373, 2011Measurements of ozone and its precursors in Beijing
J. Xu et al.
Title Page
Abstract Introduction
Conclusions References
Tables Figures
◭ ◮
◭ ◮
Back Close
Full Screen / Esc
Printer-friendly Version
Interactive Discussion
Discussion
P
a
per
|
Dis
cussion
P
a
per
|
Discussion
P
a
per
|
Discussio
n
P
a
per
|
144 288 432 576 720 86410081152129614401584172818722016
01 2 3 4
144 288 432 576 720 86410081152129614401584172818722016
020 40 60 80 100 120
6-25 7-1 7-7 7-13 7-19 7-25 7-31 8-6 8-12 8-18 8-24 8-30 9-5 9-11 17.0
25.5 34.0 42.5
Solar
r
a
d
iat
ion(
M
m
-1 )
RH(%)
T
em
p
er
at
ur
e(
)
℃
Date
1
Fig. 2.Time series of hourly averaged solar radiation, relative humidity and temperature at the
ACPD
11, 17337–17373, 2011Measurements of ozone and its precursors in Beijing
J. Xu et al.
Title Page
Abstract Introduction
Conclusions References
Tables Figures
◭ ◮
◭ ◮
Back Close
Full Screen / Esc
Printer-friendly Version
Interactive Discussion
Discussion
P
a
per
|
Dis
cussion
P
a
per
|
Discussion
P
a
per
|
Discussio
n
P
a
per
|
6-25 7-1 7-7 7-13 7-19 7-25 7-31 8-6 8-12 8-18 8-24 8-30 9-5 9-11
0 100 200 300
6-25 7-1 7-7 7-13 7-19 7-25 7-31 8-6 8-12 8-18 8-24 8-30 9-5 9-11
0 70 140 210 280
6-25 7-1 7-7 7-13 7-19 7-25 7-31 8-6 8-12 8-18 8-24 8-30 9-5 9-11
0 1000 2000 3000 4000
6-25 7-1 7-7 7-13 7-19 7-25 7-31 8-6 8-12 8-18 8-24 8-30 9-5 9-11
0 100 200 300
TN
M
H
Cs
(
p
p
b
v
)
NO
x
(p
p
b
v)
BL SDZ FT SY
C
O
(p
pbv
)
O3
(p
pbv
)
Date
1
Fig. 3. Time series of hourly averaged TNMHCs, NOx, CO and O3concentrations at the four
ACPD
11, 17337–17373, 2011Measurements of ozone and its precursors in Beijing
J. Xu et al.
Title Page
Abstract Introduction
Conclusions References
Tables Figures
◭ ◮
◭ ◮
Back Close
Full Screen / Esc
Printer-friendly Version
Interactive Discussion
Discussion
P
a
per
|
Dis
cussion
P
a
per
|
Discussion
P
a
per
|
Discussio
n
P
a
per
|
49.1%
32.8% 1.5%
16.6%
Alkanes(73.2±3.4)
Alkenes(24.7±1.6) Isoprene(2.2)
Aromatics(48.9±4.8)
BL
Alkanes(19.9±0.9)
Aromatics(12.3±1.3) Isoprene(1.1)
Alkenes(8.4±0.4)
29.4% 2.7%
20.1%
47.8%
SDZ
Fig. 4. Mixing ratios (in unit of ppbv) and percentages of alkanes, alkenes, isoprene and
ACPD
11, 17337–17373, 2011Measurements of ozone and its precursors in Beijing
J. Xu et al.
Title Page Abstract Introduction Conclusions References Tables Figures ◭ ◮ ◭ ◮ Back Close
Full Screen / Esc
Printer-friendly Version Interactive Discussion Discussion P a per | Dis cussion P a per | Discussion P a per | Discussio n P a per | isop rene propy lene cis-2 -hex ene m ,p-xylene 1, 3,5-trimet hylb enzen e b-pinen e 1, 2,4-trimet hylb enzen e tolue ne t-2-buten e is o-butene 1-bu tene cyclope nten e t-2-hex ene 0 1 2 3 4 5 6 BL SDZ LOH (s -1) m,p -xyle ne toluen e 1,2, 4-trime thyl benz ene propy lene 1,3, 5-trime thyl benz ene o-x ylene ethyl benz ene isop rene isop ent ane b-p inen e n-pro pybe nzen e 0 40 80 120 160 200 240 BL SDZ OF P ( μ gm -3)
Fig. 5. The top 10 NMHCs with the largest value of OH loss rate coefficient (LOH) (left) and
ACPD
11, 17337–17373, 2011Measurements of ozone and its precursors in Beijing
J. Xu et al.
Title Page
Abstract Introduction
Conclusions References
Tables Figures
◭ ◮
◭ ◮
Back Close
Full Screen / Esc
Printer-friendly Version
Interactive Discussion
Discussion
P
a
per
|
Dis
cussion
P
a
per
|
Discussion
P
a
per
|
Discussio
n
P
a
per
|
26.3%
14.1% 11.1%
48.5%
Alkanes(7.1s-1)
Isoprene(5.5s-1
)
Aromatics(13.3s-1
)
Alkenes(24.6s-1
)
BL
19.6% 17.8%
52.1%
10.5%
Alkenes(8.2s-1
)
Alkanes(1.6s-1)
Isoprene(2.8s-1)
Aromatics(3.0s-1
)
SDZ
Fig. 6. OH loss rate coefficients (LOH) and percentage contributions of alkanes, alkenes,