ACPD
13, 7113–7150, 2013Evolution of multispectral aerosol
optical properties
M. Gyawali et al.
Title Page
Abstract Introduction
Conclusions References
Tables Figures
◭ ◮
◭ ◮
Back Close
Full Screen / Esc
Printer-friendly Version Interactive Discussion
Discussion
P
a
per
|
Dis
cussion
P
a
per
|
Discussion
P
a
per
|
Discussio
n
P
a
per
|
Atmos. Chem. Phys. Discuss., 13, 7113–7150, 2013 www.atmos-chem-phys-discuss.net/13/7113/2013/ doi:10.5194/acpd-13-7113-2013
© Author(s) 2013. CC Attribution 3.0 License.
Atmospheric Chemistry and Physics
Open Access
Discussions
Geoscientiic Geoscientiic
Geoscientiic Geoscientiic
This discussion paper is/has been under review for the journal Atmospheric Chemistry and Physics (ACP). Please refer to the corresponding final paper in ACP if available.
Evolution of multispectral aerosol optical
properties in a biogenically-influenced
urban environment during the CARES
campaign
M. Gyawali1,10, W. P. Arnott1, R. A. Zaveri2, C. Song2, M. Pekour2, B. Flowers3, M. K. Dubey3, A. Setyan4, Q. Zhang4, J. W. Harworth5, J. G. Radney5,*,
D. B. Atkinson5, S. China6, C. Mazzoleni6, K. Gorkowski7, R. Subramanian8, B. T. Jobson9, and H. Moosm ¨uller10
1
Physics Department, University of Nevada, Reno, Nevada System of Higher Education, 1664 N. Virginia Street, Reno, NV, USA
2
Atmospheric Sciences and Global Change Division, Pacific Northwest National Laboratory, Richland, WA, USA
3
Earth System Observations, Los Alamos National Laboratory, Los Alamos, NM, USA 4
Department of Environmental Toxicology, University of California, Davis, CA, USA 5
Portland State University, Portland, OR, USA 6
ACPD
13, 7113–7150, 2013Evolution of multispectral aerosol
optical properties
M. Gyawali et al.
Title Page
Abstract Introduction
Conclusions References
Tables Figures
◭ ◮
◭ ◮
Back Close
Full Screen / Esc
Printer-friendly Version Interactive Discussion
Discussion
P
a
per
|
Dis
cussion
P
a
per
|
Discussion
P
a
per
|
Discussio
n
P
a
per
|
7
Department of Civil and Environmental Engineering, Carnegie Mellon University, Pittsburgh, PA, USA
8
Droplet Measurements Technologies, Boulder, CO, USA 9
Washington State University, Pullman, WA, USA 10
Desert Research Institute, Nevada System of Higher Education, 2215 Raggio Parkway, Reno, NV, USA
*
now at: Material Measurement Laboratory, National Institute of Standards and Technology, Gaithersburg, Maryland, 20899, USA
Received: 21 February 2013 – Accepted: 8 March 2013 – Published: 18 March 2013
Correspondence to: M. Gyawali ([email protected])
ACPD
13, 7113–7150, 2013Evolution of multispectral aerosol
optical properties
M. Gyawali et al.
Title Page
Abstract Introduction
Conclusions References
Tables Figures
◭ ◮
◭ ◮
Back Close
Full Screen / Esc
Printer-friendly Version Interactive Discussion
Discussion
P
a
per
|
Dis
cussion
P
a
per
|
Discussion
P
a
per
|
Discussio
n
P
a
per
|
Abstract
Ground-based aerosol measurements made in June 2010 within Sacramento urban area (site T0) and at a 40-km downwind location (site T1) in the forested Sierra Nevada foothills area are used to investigate the evolution of multispectral optical properties as the urban aerosols aged and interacted with biogenic emissions. Along with black
car-5
bon and non-refractory aerosol mass and composition observations, spectral absorp-tio (βabs), scattering (βsca), and extinction (βext) coefficients for wavelengths ranging from 355 to 1064 nm were measured at both sites using photoacoustic (PA) instru-ments with integrating nephelometers and using cavity ring-down (CRD) instruinstru-ments. The daytime average ˚Angstr ¨om exponent of absorption (AEA) was∼1.6 for the
wave-10
length pair 405 and 870 nm at T0, while it was∼1.8 for the wavelength pair 355 and 870 nm at T1, indicating a modest wavelength-dependent enhancement of absorption at both sites throughout the study. The measured and Mie theory calculations of mul-tispectralβsca showed good correlation (R2=0.85–0.94). The average contribution of supermicron aerosol (mainly composed of sea salt particles advected in from the
Pa-15
cific Ocean) to the total scattering coefficient ranged from less than 20 % at 405 nm to greater than 80 % at 1064 nm. From 22 to 28 June, secondary organic aerosol mass increased significantly at both sites due to increased biogenic emissions coupled with intense photochemical activity and air mass recirculation in the area. During this pe-riod, the short wavelength scattering coefficients at both sites gradually increased due
20
to increase in the size of submicron aerosols. At the same time, BC mass-normalized absorption cross-section (MAC) values for ultraviolet wavelengths at T1 increased by ∼60 % compared to the relatively less aged urban emissions at the T0 site. In contrast, the average MAC values for 870 nm wavelength were identical at both sites. These results suggest formation of moderately brown secondary organic aerosols formed in
25
ACPD
13, 7113–7150, 2013Evolution of multispectral aerosol
optical properties
M. Gyawali et al.
Title Page
Abstract Introduction
Conclusions References
Tables Figures
◭ ◮
◭ ◮
Back Close
Full Screen / Esc
Printer-friendly Version Interactive Discussion
Discussion
P
a
per
|
Dis
cussion
P
a
per
|
Discussion
P
a
per
|
Discussio
n
P
a
per
|
1 Introduction
Atmospheric aerosols impact the Earth’s radiation budget by scattering and absorb-ing solar radiation, which is referred to as the aerosol direct effect (Charlson et al., 1992; Schwartz, 1996). This can lead to heating or cooling of the climate depending on the ratio of absorption and extinction coefficients, often characterized by the aerosol
5
single scattering albedo (SSA), and the particle scattering asymmetry parameter as well as the albedo of the underlying surface (Chylek and Wong, 1995). In addition to these direct effects, aerosols can also have indirect effects on the radiation bal-ance by changing the microphysical properties of clouds, thus influencing their optical properties and lifetime (Twomey, 1977; Coakley et al., 1987). Inorganic salts, such as
10
sulfates, are important aerosol species that strongly scatter and backscatter solar ra-diation, usually cooling the climate (Charlson et al., 1992; Haywood and Ramaswamy, 1998). Black carbon (BC) aerosol is the dominant absorber over the solar spectrum (Bond and Bergstrom, 2006) and is associated with a warming effect on the climate (Haywood and Ramaswamy, 1998; Ramanathan et al., 2005). Furthermore, a number
15
of studies (Andreae and Gelencser, 2006; Barnard et al., 2008; Chakrabarty et al., 2010; Gyawali et al., 2009; Kirchstetter et al., 2004; Lewis et al., 2008; Flowers et al., 2010; Lack et al., 2012) have identified organic aerosols (OA) as major absorbers at shorter wavelengths, often referred to as “brown carbon” (BrC). OA constitutes a large fraction of atmospheric aerosol mass; typical measurements range from∼20–90 % of
20
sub-micron-diameter aerosol mass (Zhang et al., 2007). These aerosols scatter light efficiently because their size is comparable to the wavelength of the visible solar radia-tion and typical values of the real part of their refractive index are fairly high (n=1.4 to 2.0). Additionally, they are transported far from the source region; hence, their climatic impact is not limited to the source region. However, the role of OA on the Earth’s
ra-25
ACPD
13, 7113–7150, 2013Evolution of multispectral aerosol
optical properties
M. Gyawali et al.
Title Page
Abstract Introduction
Conclusions References
Tables Figures
◭ ◮
◭ ◮
Back Close
Full Screen / Esc
Printer-friendly Version Interactive Discussion
Discussion
P
a
per
|
Dis
cussion
P
a
per
|
Discussion
P
a
per
|
Discussio
n
P
a
per
|
The Department of Energy’s Carbonaceous Aerosols and Radiative Effects Study (CARES) field campaign was carried out in June 2010 in the Sacramento (California, USA) area to better understand the evolution of aerosol properties resulting from the various physical and chemical interactions between anthropogenic and biogenic emis-sions. A wide range of ground-based and airborne instruments were deployed to
moni-5
tor comprehensive aerosol properties, meteorological variables, and gaseous species. Two ground sites, one within the Sacramento urban area (T0) and another in Cool, CA,∼40 km downwind in the forested Sierra Nevada foothills area (T1), were set up to study the evolution of the aerosols as they aged during transport. Zaveri et al. (2012) presents detailed descriptions of the overall research objectives of the CARES
cam-10
paign, the various sampling platforms and instrumentation, and an overview of several key observations. Fast et al. (2012) describes the meteorological conditions during CARES.
Shilling et al. (2013) analyzed aircraft measurements obtained during CARES and found that production of secondary organic aerosol (SOA) was dramatically enhanced
15
when anthropogenic emissions from Sacramento urban area mixed with isoprene-rich air from the Sierra Nevada foothills. A similar conclusion was reached by Setyan et al. (2012) based on measurements made at the T1 site. Cappa et al. (2012) re-ported BC absorption enhancements due to photochemical aging at T0 was only∼6 % at 532 nm, and attributed the slightly higher absorption enhancement at 405 nm to the
20
influence of BrC on absorption in this wavelength region. In another study, Kassianov et al. (2012) showed that coarse mode aerosols contributed more than 50 % and up to 85 % of time to the total aerosol volume observed at T0 and T1 during CARES.
In this paper, we focus on a comparative analysis of aerosol absorption, scatter-ing, extinction and single scattering albedo over wavelengths ranging from 355 nm
25
ACPD
13, 7113–7150, 2013Evolution of multispectral aerosol
optical properties
M. Gyawali et al.
Title Page
Abstract Introduction
Conclusions References
Tables Figures
◭ ◮
◭ ◮
Back Close
Full Screen / Esc
Printer-friendly Version Interactive Discussion
Discussion
P
a
per
|
Dis
cussion
P
a
per
|
Discussion
P
a
per
|
Discussio
n
P
a
per
|
We begin with a brief description of the measurement sites and instruments followed by a discussion of the time series of aerosol light absorption and scattering coeffi -cients obtained at the T0 and T1 sites using photoacoustic (PA) and cavity ring-down (CRD) instruments. The BC mass concentration measurements from a single particle soot photometer (SP2) were analyzed together with the aerosol light absorption
mea-5
surements to obtain BC mass normalized light absorption cross-sections (MAC). Also reported here are scattering coefficients obtained from Mie theory and scanning mo-bility particle sizer (SMPS) and aerosol particle sizer (APS) measurements of particle size distributions from 10 nm to 20 µm.
2 Experimental
10
2.1 Ground sites
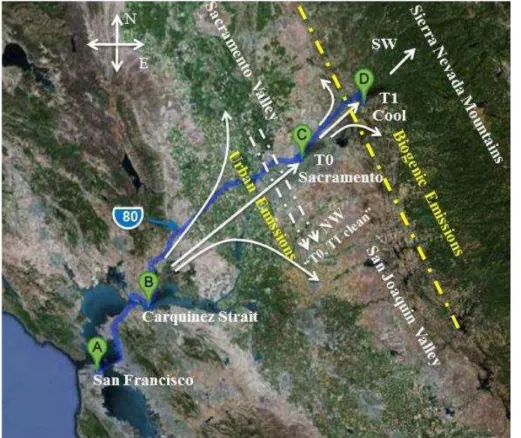
The CARES campaign took place in the Sacramento valley from the 2 to the 28 June, 2010. Figure 1 shows the location of the ground sampling sites overlaid with the dom-inant summer daytime wind patterns. Two ground sites were strategically chosen to study the evolution and transport of urban emissions and their interaction with biogenic
15
emissions in the forested area. The urban site, T0 (altitude∼30 m a.s.l.), was located on the American River College campus, ∼14 km northeast of the downtown Sacra-mento area. The downwind rural site, T1 (altitude∼450 m a.s.l.) was located∼40 km northeast of the T0 site on the Northside School campus in Cool, CA. In addition to the local urban and agricultural sources, emissions from Bay Area and the
petrochem-20
ical refineries located in the Carquinez Strait are the major sources of air pollution in Sacramento and Central Valley. During strong southwesterly flow events, coarse-mode sea salt aerosols from the Pacific Ocean can also be advected to Sacramento area via the Carquinez Strait (Zaveri et al., 2012).
All measurements are reported at ambient temperature and pressure, and in Pacific
25
ACPD
13, 7113–7150, 2013Evolution of multispectral aerosol
optical properties
M. Gyawali et al.
Title Page
Abstract Introduction
Conclusions References
Tables Figures
◭ ◮
◭ ◮
Back Close
Full Screen / Esc
Printer-friendly Version Interactive Discussion
Discussion
P
a
per
|
Dis
cussion
P
a
per
|
Discussion
P
a
per
|
Discussio
n
P
a
per
|
2.2 Measurements of aerosol optical properties
During the CARES campaign, a number of photoacoustic instruments (PA) equipped with integrating reciprocal nephelometers were deployed at the T0 and T1 sites to study the magnitude and spectral dependence of aerosol light absorption (βabs) and scatter-ing coefficients (βsca). To accomplish this, two groups from the University of Nevada,
5
Reno (UNR) and from the Los Alamos National Laboratory (LANL), New Mexico de-ployed several PA instruments operating at multiple wavelengths. At T0, wavelengths included 375, 405, 532, 781, 870, and 1047 nm, while at T1, they were 355, 405, 532, 781, and 870 nm.
The PA technique provides real time, in-situ measurements of ambient aerosol light
10
absorption (Arnott et al., 1999; Moosm ¨uller et al., 2009). In this method, aerosol sam-ples are illuminated in an acoustic resonator by a power-modulated laser. The ab-sorbed energy heats the particles and the heat is quickly released to the surrounding air, producing a periodic variation in air pressure (i.e. a sound wave). The pressure of the sound wave is measured with a calibrated microphone located in the resonator,
15
thereby producing a first-principle measurement of theβabs. These PA instruments
si-multaneously measure theβsca using a reciprocal nephelometer (Abu-Rahmah et al., 2006).
Since PA instruments are designed for the concurrent measurement ofβabsandβsca,
we can obtain the extinction coefficient (βext=βabs+βsca), and other optical
parame-20
ters like the single scattering albedo (SSA), and the ˚Angstr ¨om exponent of absorption (AEA) using multiple wavelength measurements. The SSA is the ratio of theβscaand
βextand can be expressed as
SSA= βsca(λ)
βabs(λ)+βsca(λ). (1)
The spectral dependence of SSA is related to those ofβabs andβsca(Moosm ¨uller and
25
ACPD
13, 7113–7150, 2013Evolution of multispectral aerosol
optical properties
M. Gyawali et al.
Title Page
Abstract Introduction
Conclusions References
Tables Figures
◭ ◮
◭ ◮
Back Close
Full Screen / Esc
Printer-friendly Version Interactive Discussion
Discussion
P
a
per
|
Dis
cussion
P
a
per
|
Discussion
P
a
per
|
Discussio
n
P
a
per
|
was investigated atλ=355, 532, and 870 nm. The AEA expressed by:
AEA=−
ln βabs(λ1)/βabs(λ2)
ln(λ1/λ2) (2)
characterizes the spectral dependence of aerosol light absorption assuming a simple power-law dependence between the wavelengthsλ1andλ2(Moosm ¨uller et al., 2011). The AEA at T0 was derived from the PA measurements of βabs at 405 and 870 nm,
5
while at T1 it was derived from similar measurements at 355 and 870 nm. These wave-lengths were chosen to emphasize light absorption by organic aerosol coatings and in-trinsic absorption (Gyawali et al., 2009). Additionally, AEA was estimated with a power law fit for the MAC values for wavelengths ranging from UV to near IR when data were available simultaneously for both sites.
10
The βext data were also obtained with the CRD operating at 1064 nm at both T0
and T1 sites. The operational principle and design of the CRD have previously been described in detail (Smith and Atkinson, 2001; Radney et al., 2009).
2.3 Collocated measurements used in this study
BC mass concentrations were measured at T0 and T1 with a single particle soot
pho-15
tometer (SP2, Schwarz et al., 2006) calibrated with Acheson Aquadag (Subramanian et al., 2010). The SP2 was calibrated with Aquadag; recent studies have shown that diesel soot and wood smoke BC are better represented by fullerene soot (Moteki and Kondo, 2010; Laborde et al., 2012). So the SP2-measured BC mass was increased by 60 % as a first order correction to a fullerene soot-equivalent value, based on the
20
results of Moteki and Kondo (2010).
Within a particle diameter range from 8 to 858 nm, the particle size distributions were measured at T1 in 70 logarithmically-spaced size bins by a scanning mobility particle sizer (SMPS) system consisting of a differential mobility analyzer (DMA) and a condensation particle counter (CPC; TSI Inc., MN; model 3772) (Setyan et al., 2012).
ACPD
13, 7113–7150, 2013Evolution of multispectral aerosol
optical properties
M. Gyawali et al.
Title Page
Abstract Introduction
Conclusions References
Tables Figures
◭ ◮
◭ ◮
Back Close
Full Screen / Esc
Printer-friendly Version Interactive Discussion
Discussion
P
a
per
|
Dis
cussion
P
a
per
|
Discussion
P
a
per
|
Discussio
n
P
a
per
|
Similar measurements were conducted at T0 for particle diameters from 12 to 736 nm in 115 size bins. Particle size distribution ranging from 0.5 to 20 µm in 52 size bins were measured with an aerodynamic particle sizer (APS; TSI, Shoreview, MN) at both sites. Measurements of size-resolved chemical composition of non-refractory species in particles of an aerodynamic diameter less than 1 µm (PM1) were simultaneously
5
acquired with a high resolution aerosol mass spectrometer (HR-AMS; Setyan et al., 2012). The HR-AMS provides mass concentrations of inorganic and organic aerosols.
2.4 Mie model calculations ofβsca
The interaction of a single homogeneous, spherical particle with plane-wave electro-magnetic radiation can be computed from Mie theory (Kerker, 1969; Hulst, 1981).
10
A model assuming spherical aerosols was applied (Wiscombe, 1980), that required particle size distributions and complex refractive indices:m=nr+i ni. Admittedly,
at-mospheric aerosols vary widely in composition, mixing state, shape, and size (a few nanometers to 100 µm; Seinfeld and Pandis, 2006); but for simplicity the Mie model used here assumed a size-independent refractive index 1.53+i10−6. The assumed
15
value of the real component is commonly used for (NH4)2SO4, and is nearly constant for the wavelength ranging from 450 to 700 nm (Sloane, 1984; Redemann et al., 2001). A recent study has suggested an increase in the real part of the refractive index from 1.48 to 1.55 for OA upon heterogeneous OH oxidation (Cappa et al., 2011), consistent with our chosen value.
20
From the SMPS-APS aerosol size distribution (given byd logdND
p), theβscais estimated
using the following equation:
βsca=
Dmax
Z
Dmin π Dp2
4 Qsca λ,m,Dp dN
ACPD
13, 7113–7150, 2013Evolution of multispectral aerosol
optical properties
M. Gyawali et al.
Title Page
Abstract Introduction
Conclusions References
Tables Figures
◭ ◮
◭ ◮
Back Close
Full Screen / Esc
Printer-friendly Version Interactive Discussion
Discussion
P
a
per
|
Dis
cussion
P
a
per
|
Discussion
P
a
per
|
Discussio
n
P
a
per
|
whereQscathe Mie scattering efficiency is a function of refractive indexm, wavelength
λ, and particle diameterDp.
Mobility diameter (Dm) measured by the SMPS equals toDp, assuming the particles are spherical and singly-charged. However, aerodynamic diameter (Da), as reported by the APS, needs to be converted to the equivalentDpfor Mie theory calculations. For
5
this purpose,Dawas divided by the square root of the density of sea salt aerosol (ρ= 2.25 g cm−3), assuming the coarse mode particles are spherical (Zaveri et al., 2012).
3 Results and discussion
3.1 Aerosol transport and meteorology
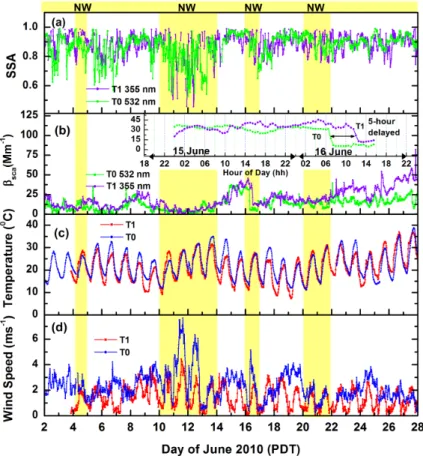
Figure 2 shows the time series of the aerosol optical properties and the meteorological
10
conditions at T0 and T1 sites from the 2 to 28 June 2010. A study of the meteorological parameters characterizing the transport of aerosols during the CARES campaign was published in this special issue by Fast et al. (2012). In brief, near-surface thermally-driven upslope flows including synoptic southwesterly (SW) winds were favorable for transport of the urban plume from Sacramento to the T1 site near Cool. These patterns
15
were occasionally interrupted by a northwesterly (NW) flow, which carried the urban plume southeast to the San Joaquin Valley (Fig. 1), thereby reducing the interaction of the urban plume with biogenic emissions at T1 and recirculation to T0. During these periods (10–13, 16–17, and 20–21 June 2010), the measuredβsca at both sites was significantly lower than during the rest of the campaign. In Fig. 2, the NW flows are
20
indicated by the shaded areas.
The SSA was lowest when NW flow was present from 10 to 14 June. SSA values as low as ∼0.42 were observed at 355 and 532 nm during the 12 June. NW flows significantly reduced the aerosol transport from the Bay Area to T0 and T1. During these periods, the SSA was reduced due to the dominance of fresh local emissions
25
ACPD
13, 7113–7150, 2013Evolution of multispectral aerosol
optical properties
M. Gyawali et al.
Title Page
Abstract Introduction
Conclusions References
Tables Figures
◭ ◮
◭ ◮
Back Close
Full Screen / Esc
Printer-friendly Version Interactive Discussion
Discussion
P
a
per
|
Dis
cussion
P
a
per
|
Discussion
P
a
per
|
Discussio
n
P
a
per
|
T0 was affected by traffic emission of BC more than T1. The SSA was as high as 0.98 at both sites during periods of significant southwesterly (SW) flow patterns and high temperatures.
Between 2 and 22 June, T1βscafollowed the same temporal patterns as T0βscawith
a slight delay, suggesting a dominant influence of regional air masses with transport
5
from T0 to T1. The inset panel (Fig. 2b) presents the spatial and temporal features of aerosol transport from T0 to T1 during the 15 and 16 June, representing the direct transport of the Sacramento plume to Cool, mixing with the air masses at the Sierra’s foothills dominated by biogenic emissions (Fast et al., 2012). Scattering coefficient fea-tures were delayed by about five hours at T1 during the 16 June. According to Fast
10
et al. (2012), on days with SW flows the transport time between the T0 and T1 varied from 2 to 8 h where the longer times were associated with urban plumes originating from downtown Sacramento. During these days, 532 and 355 nm βsca at T0 and T1 were as high as 35 and 45 Mm−1, respectively. Furthermore, during SW flows diurnal characteristics such as morning and evening rush-hour traffic emissions were almost
15
indistinguishable inβscameasurements at T0 and T1. This suggests that the pollution levels in the Sacramento and Cool regions were dependent on direction and magnitude of wind flows rather than only (or even primarily) on local emissions.
During the final six days of the campaign (22–28 June), 355 nmβsca at T1 was en-hanced relative to 532 nm βsca measured at T0 as a consequence of ultrafine and
20
submicron aerosol that began to grow vigorously into the size range where scattering is larger at shorter wavelengths. For instance, during this period, βsca at 355 nm in-creased on average from 15 to 37 Mm−1(147 %), whileβscaat 532 nm increased from 12 to 19 Mm−1 (58 %). Similarly, during the same period, βabs at 355 nm increased from 2 to 4 Mm−1 (107 %) and at 532 nm from 1.5 to 2.3 Mm−1 (58 %). This period
25
ACPD
13, 7113–7150, 2013Evolution of multispectral aerosol
optical properties
M. Gyawali et al.
Title Page
Abstract Introduction
Conclusions References
Tables Figures
◭ ◮
◭ ◮
Back Close
Full Screen / Esc
Printer-friendly Version Interactive Discussion
Discussion
P
a
per
|
Dis
cussion
P
a
per
|
Discussion
P
a
per
|
Discussio
n
P
a
per
|
2011). Enhanced SOA formation was observed when the urban plume interacted with biogenic emissions during the campaign (Setyan et al., 2012). Setyan et al. (2012) described the PM1chemical composition and size distribution of species at T1, includ-ing the OA components. In brief, PM1 mass was dominated by OA (80 %) followed by sulfate (9.9 %). Furthermore, oxygenated OA (OOA) comprised 90 % of the total mass
5
of organics, while hydrocarbon-like OA (HOA) comprised only 10 %. The OOA fraction corresponds to SOA and the HOA fraction to traffic-related primary emissions. From this PM1 classification, it is apparent that the enhanced scattering of 355 nm radiation at T1 was dominated by the OOA components of the SOA.
3.2 Daily average of aerosol chemical, physical, and optical properties
10
3.2.1 Site T0
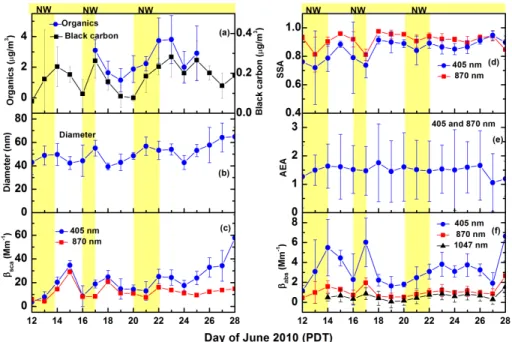
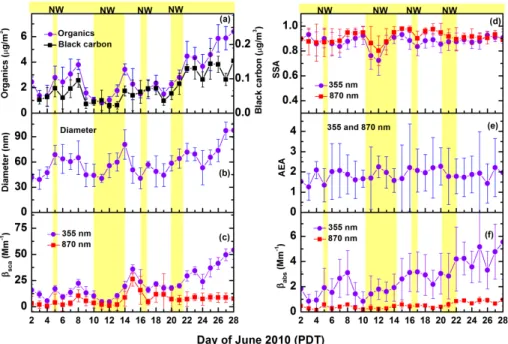
Figure 3a, b shows the daily daytime average of PM1organic mass concentration and particle diameter analyzed by the AMS and SMPS at T0 from the 12 to 28 June. Also presented in Fig. 3 are the PA measurements ofβsca(at 405 and 870 nm) andβabs(at 405, 870, and 1047 nm) during the same period. The vertical bars represent one
stan-15
dard deviation of the averaged measurements during daylight hours (06:00 to 18:00 PDT). PM1organic mass concentration measurements were available only from the 17 to 25 June. Scattering at 405 nm correlated especially well with the mean diameter of PM1from after the 22 June to the end of the campaign, when PM1particle growth con-tributed to enhanced scattering at 405 nm relative to 870 nm. The maximum PM1mean
20
diameter was 68 nm withβsca of 50 Mm−1 for the 28 June, while the β
sca at 870 nm
remained constant at∼11Mm−1. The daily daytime average BC mass concentrations varied between 0.06 and 0.28 µg m−3with an overall average of 0.16 µg m−3(Fig. 3a).
Figure 3d–f shows the daily daytime average SSA, AEA (405, 870 nm), and theβabs. The SSA was lower for both 405 and 870 nm during NW flows due to the increased
25
ACPD
13, 7113–7150, 2013Evolution of multispectral aerosol
optical properties
M. Gyawali et al.
Title Page
Abstract Introduction
Conclusions References
Tables Figures
◭ ◮
◭ ◮
Back Close
Full Screen / Esc
Printer-friendly Version Interactive Discussion
Discussion
P
a
per
|
Dis
cussion
P
a
per
|
Discussion
P
a
per
|
Discussio
n
P
a
per
|
of SOA and recirculation of aged aerosols. The SSA exhibited a similar value of∼0.90 at 405 and 870 nm after the 25 June. The average AEA was nearly constant at∼1.5, indicating enhanced absorption at shorter wavelengths at T0, even in the background air. The daily daytime average βabs plotted for three wavelengths (Fig. 3f) exhibited
similar variations with BC mass concentrations and PM1 organic mass concentrations
5
(Fig. 3a). BC at T0 ranged from 0.6 to 0.28 µg m−3 (Fig. 3a) with an overall average
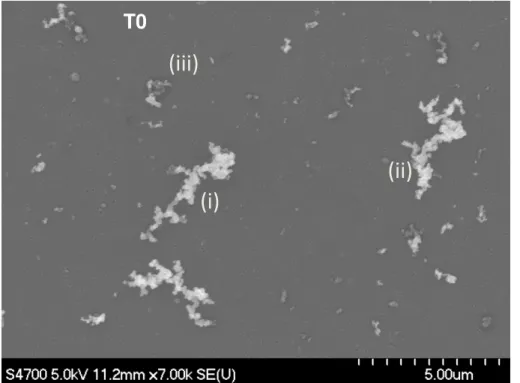
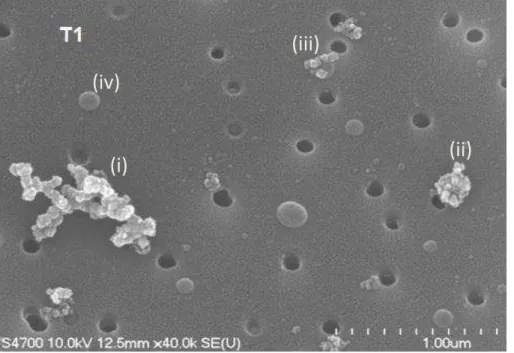
of 0.16 µg m−3. The peaks ofβabs∼5.8 and 1.9 Mm−1at 405 and 870 nm, respectively were observed during the 14 and 17 June and found to be associated with the cor-responding peak values of BC mass concentrations. Figure 4 shows a field emission scanning electron microscope (FE-SEM) image of particles collected at the T0 site on
10
a nuclepore membrane. The image shows a broad size distribution of soot aggregates as large as 4.5 µm in the longest dimension (Fig. 4i). Freshly emitted soot particles can be mixed with partly coated soot particles (Fig. 4ii) or coated by other material (Fig. 4iii) (darker region) such as unburned fuel or lubricating oil, or organic matter.
3.2.2 Site T1
15
Figure 5 presents the same measurements for the T1 site as Fig. 3 did for the T0 site, but at wavelengths 355 and 870 nm and from the 2 to 28 June. Between the 8 and 11 June, the average mass concentration of PM1 organics decreased from 4 to 1 µg m−3, while the mean diameter of these particles decreased from 64 to 40 nm. As mentioned previously, the NW flows disrupted the transport of the urban plume from
20
Sacramento to the T1 site, which would otherwise have been observed after photo-chemical and physical processing. The aerosol size increases during atmospheric pro-cessing as a result of the coagulation and condensation of both organic and inorganic species, affecting aerosol optical properties (Reid et al., 1998). After the 22 June, the growing mean diameter of PM1 resulted in enhanced βsca at 355 nm at T1 and also
25
ACPD
13, 7113–7150, 2013Evolution of multispectral aerosol
optical properties
M. Gyawali et al.
Title Page
Abstract Introduction
Conclusions References
Tables Figures
◭ ◮
◭ ◮
Back Close
Full Screen / Esc
Printer-friendly Version Interactive Discussion
Discussion
P
a
per
|
Dis
cussion
P
a
per
|
Discussion
P
a
per
|
Discussio
n
P
a
per
|
peaked at 55 Mm−1 on the 28 June. The β
sca at 870 nm was slightly higher after the
22 June, but remained nearly constant∼10 Mm−1.
According to Setyan et al. (2012), organics (OOA+HOA) dominated the average chemical composition with 80 % of PM1 mass, followed by sulfate (9.9 %), ammonium (4.5 %), nitrate (3.6 %), and BC (1.6 %). In addition to BC, organic species emitted
5
directly from combustion processes or formed via the oxidation of biogenic emission are the main light absorbing carbonaceous aerosols in the atmosphere (Andreae and Crutzen, 1997). Figure 6, shows a FE-SEM image of particles collected at the T1 site, displays: (a) fractal soot aggregates with open (Fig. 6i) and collapsed structures (Fig. 6ii), consistent with the presence of fresh and aged particles; (b) soot-inclusion
10
with a spherical particle (Fig. 6iii) which is representative of the complex mixing state of soot particles; (c) spherical and near-spherical particles (Fig. 6iv) consistent with the presence of organic aerosols. For comparison, Chakrabarty et al. (2013) reported the morphology of incense smoke aerosols – a class of BrC – to be non-coalescing and weakly-bound aggregates.
15
As the day progresses, the fractal soot particles begin to increase in mass and col-lapse into a more spherical form upon coating by organics, sulfate, ammonium, nitrate, and water (Moffet and Prather, 2009). The coating on the BC particles leads to absorp-tion enhancement up to 1.6 (Moffet and Prather, 2009), while the AEA can be as high as 1.6 due to non-absorbing coating (Gyawali et al., 2009; Lack and Cappa, 2010).
Lab-20
oratory studies have also shown that organic coatings enhance BC absorption (Cross et al., 2010).
Figure 5d–f presents the daily daytime average SSA, AEA, and βabs at 355 and 870 nm. Days with NW flows exhibited lower SSA in comparison to that of SW flows both at 355 and 870 nm with values 0.7 and 0.8, respectively. The daily daytime
aver-25
ACPD
13, 7113–7150, 2013Evolution of multispectral aerosol
optical properties
M. Gyawali et al.
Title Page
Abstract Introduction
Conclusions References
Tables Figures
◭ ◮
◭ ◮
Back Close
Full Screen / Esc
Printer-friendly Version Interactive Discussion
Discussion
P
a
per
|
Dis
cussion
P
a
per
|
Discussion
P
a
per
|
Discussio
n
P
a
per
|
concurrently observed increasing mass of PM1 organics and diameter of the parti-cles. The daily daytime average AEA varied from 1.3 to 2.3, and remained∼1.8 after the 22 June, suggesting enhanced absorption at the shorter wavelengths likely due to coating by mildly absorbing organic species on BC. Rizzo et al. (2011) reported slightly lower value of average AEA of 1.5 at 370 and 880 nm for the Amazon Basin in a remote
5
forested site during the dry season when the biogenic emission and soil dust (including soot) accounted for about 75 % and 13 %, respectively, of the total aerosol mass. The
βabsat 355 nm ranged from 0.8 to 5.4 Mm−1with an overall average of 2.6 Mm−1. Simi-larly,βabsat 870 nm ranged from 0.2 to 0.9 Mm−1. The steadily increasing organic mass
from the 22 to the 28 June at T1 produced an strong impact on aerosol light scattering
10
at 355 nm with∼84 % increase in βsca, whileβabs at 355 nm increased by∼35 %. For comparison,βscaandβabs at 870 nm increased by∼5 % and by∼11 %, respectively, during the same period. This suggests that the SOA formed from the oxidation of mixed biogenic and anthropogenic emissions in the forested region (T1) developed a modest absorption at 355 nm, much less than the strong intrinsic SOA UV absorption observed
15
for biomass burning aerosols (Gyawali et al., 2009).
3.3 Black carbon mass normalized absorption cross-section
PA measurements of absorption coefficients correlated well with BC mass concentra-tions simultaneously measured with the SP2. This correlation yields BC mass normal-ized absorption cross-sections, MAC (m2g−1) as the slope of the linear regression
to-20
gether with the respective standard error levels, for T0 and T1, from near UV to near IR wavelengths (Fig. 7). Results are presented for the period from the 22 to 28 June as this was the longest time period during which all the SP2 and PA instruments were operat-ing continuously at both sites. As mentioned previously, these days were favorable for transport of the urban plume from Sacramento to the T1 site and its vicinity. Additionally,
25
ACPD
13, 7113–7150, 2013Evolution of multispectral aerosol
optical properties
M. Gyawali et al.
Title Page
Abstract Introduction
Conclusions References
Tables Figures
◭ ◮
◭ ◮
Back Close
Full Screen / Esc
Printer-friendly Version Interactive Discussion
Discussion
P
a
per
|
Dis
cussion
P
a
per
|
Discussion
P
a
per
|
Discussio
n
P
a
per
|
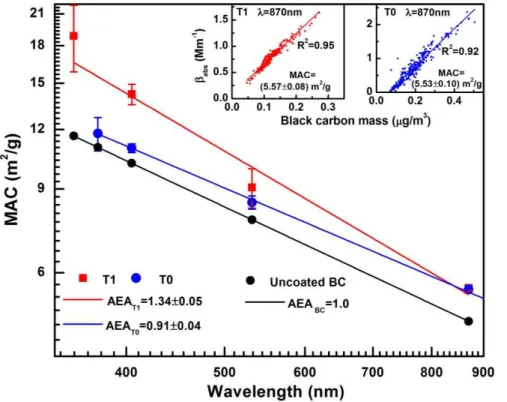
average MAC values at T0 were lower than MAC values at T1 for similar wavelengths. For example, the average MAC values at T1 are about 1 %, 8 %, 30 %, and 60 % higher than at T0. Brown carbon could account for∼10 % to 30 % of total absorption at mid-visible wavelengths to 370 nm (Yang et al., 2009). Our MAC value of ∼5.5 m2g−1 at 870 nm for T0 and T1 compares well with Bond’s and Bergstrom’s (2006) suggested
5
value of 7.5±1.2 m2g−1 for freshly emitted BC at 550 nm (or 4.7 m2g−1 at 870 nm, assuming aλ−1
dependence). Using a PA and an OCEC analyzer instrument, Doran (2007) found similar MAC values of 5.6 and 5.5 m2g−1at 870 nm for partially coated BC at sites T1 and T2 downwind of Mexico City.
A power law fit for the MAC values is presented in Fig. 7. The two distinct power law
10
fits give the averaged AEA (negative slope of the log-log plot) of 0.91±0.04 (for T0) and 1.34±0.05 (for T1), indicating that the aerosol light absorption at T0 was mainly influenced by fresh traffic emissions, while at T1 it was influenced by aged BC coated with SOA formed from interactions between anthropogenic and biogenic emissions. For comparison, an AEA value of 0.8 has been reported for a laboratory measurement of
15
freshly emitted kerosene soot particles for a similar wavelength range (355–1047 nm) by using a similar technique (Gyawali et al., 2012). The inset panels in Fig. 7 show the regression analysis ofβabs at 870 nm as a function of BC mass concentration for T0 and T1. The slopes of the regression lines, which represent the average BC mass normalized MAC, were determined to be 5.53±0.10 (for T0) and 5.57±0.08 m2g−1
20
(for T1). Even with substantially lower BC mass concentrations and βabs at 870 nm, the strong correlations (R2=0.92 and 0.95 at T0 and T1) betweenβabs and BC mass concentration suggest BC as the principal absorbing component at 870 nm. A good correlation (R2>0.60) was observed for the remaining wavelengths, except for 355 and 375 nm (R2<0.35) (not shown). This suggests wavelength dependent absorption
25
ACPD
13, 7113–7150, 2013Evolution of multispectral aerosol
optical properties
M. Gyawali et al.
Title Page
Abstract Introduction
Conclusions References
Tables Figures
◭ ◮
◭ ◮
Back Close
Full Screen / Esc
Printer-friendly Version Interactive Discussion
Discussion
P
a
per
|
Dis
cussion
P
a
per
|
Discussion
P
a
per
|
Discussio
n
P
a
per
|
at T1 may be mainly due to the formation of brown SOA. While these results are gen-erally consistent with the findings of Cappa et al. (2012), a more detailed analysis of the absorption data with the core-shell Mie theory, constrained with the observed BC coating thickness (from SP2 measurements) and morphological information (based on SEM images), is needed to estimate the relative contributions of the lensing effect and
5
brown SOA to the total multispectral absorption observations at both T0 and T1. Such a study is planned and results will be published in a separate paper.
3.4 Modeled aerosol light scattering
Mie theory scattering calculations were performed using the particle size distributions measured by the SMPS-APS system, assuming that all particles are spherical. To avoid
10
over-counting the particle size distribution in the SMPS-APS overlap range, the first 7 bins of the APS measurements were not included in the Mie theory calculations.
In the following subsections, the estimated submicronβscasub refers to the Mie theory calculations based on the SMPS measurements, whereas the estimated supermicron
βscasup refers to the Mie theory calculations based on the APS measurements. The Mie
15
theory calculations are performed with 2.5 and 5 min averages of the SMPS data at T0 and T1 and one minute averages of APS data at both sites. These values were then averaged to 30 min values to compare with the measured aerosol optical data by the PA and CRD instruments.
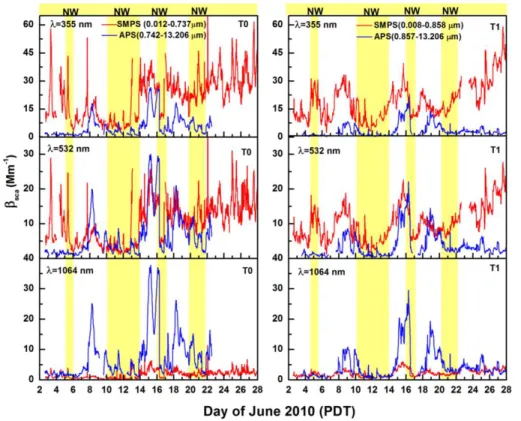
3.4.1 Submicron and supermicron aerosol light scattering
20
The time series of the estimated submicronβscasub and estimated supermicronβscasup are presented in Fig. 8 at wavelengths 355, 532 and 1064 nm for both sites for the com-parative study. The estimated supermicron βsupsca increases with wavelength for both sites. However, the magnitude of supermicronβsupsca only became significant during the SW flow events, suggesting dominant contributions of transported sea salt and dust
25
ACPD
13, 7113–7150, 2013Evolution of multispectral aerosol
optical properties
M. Gyawali et al.
Title Page
Abstract Introduction
Conclusions References
Tables Figures
◭ ◮
◭ ◮
Back Close
Full Screen / Esc
Printer-friendly Version Interactive Discussion
Discussion
P
a
per
|
Dis
cussion
P
a
per
|
Discussion
P
a
per
|
Discussio
n
P
a
per
|
After the 22 June, the estimated submicronβscasub increased continuously at all wave-lengths at T0 and T1, especially at 355 and 532 nm. Note that the estimated submicron
βscasub for T1 at 355 nm increased continuously from ∼15 Mm
−1
to∼60 Mm−1from the 22 June through the end of the campaign, while the estimated supermicronβsupsca re-mained constant at∼3 Mm−1. During the same period, both the estimated submicron
5
βscasub and supermicron β sup
sca at 1064 nm remained nearly constant at ∼4 Mm
−1
. The difference in the scattering at the two wavelengths is driven by growth in the size of ultrafine and submicron aerosols, perhaps with a small constant contribution of larger particles.
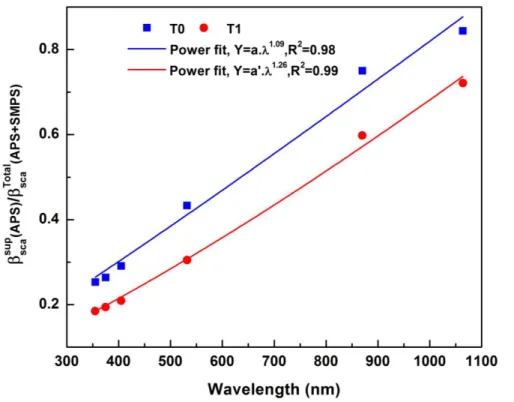
The estimated total scattering coefficient,βscaTotal(SMPS+APS), is compared with the
10
estimated super micron scattering coefficient,βsupsca(APS). Figure 9 presents the fraction of multispectral scattering due to the supermicron aerosols, i.e. the ratio of estimated scattering coefficients due to supermicron particles to the total estimated scattering coefficients. Each data point is the average value from the 3 to the 23 June 2010 when the SMPS and APS were operating successfully both at T0 and T1. The scattering
15
contribution from supermicron aerosols increased strongly as a function of wavelength for both T0 and T1 sites. Additionally, the ratio indicates that the supermicron scattering for all wavelengths is higher at T0 than at T1. This is likely due to the large particles generated from traffic and urban construction in the proximity of the T0 site, and to the fact that the relatively short atmospheric lifetime results in only a small fraction of large
20
particles reaching the T1 site.
3.4.2 Measured and estimated aerosol light scattering
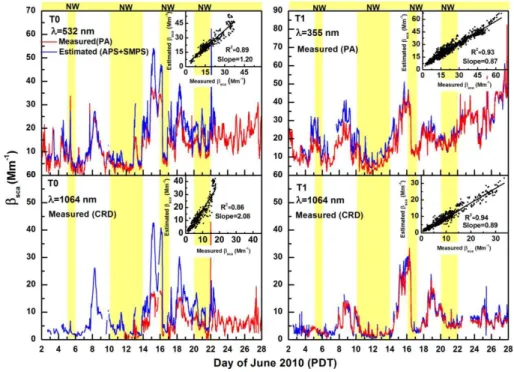
Figure 10 provides a time series of 30-min averagedβsca measurements by the PA and CRD instruments and the estimatedβsca. The PA βabs at 870 nm was used with 1064 nm CRDβextmeasurements to calculate 1064 nmβscaby assuming aλ
−1
depen-25
ACPD
13, 7113–7150, 2013Evolution of multispectral aerosol
optical properties
M. Gyawali et al.
Title Page
Abstract Introduction
Conclusions References
Tables Figures
◭ ◮
◭ ◮
Back Close
Full Screen / Esc
Printer-friendly Version Interactive Discussion
Discussion
P
a
per
|
Dis
cussion
P
a
per
|
Discussion
P
a
per
|
Discussio
n
P
a
per
|
The measured and the estimatedβscaat 532 nm compared quite well from the 2 to 14 June, while the disagreement between the two quantities were appreciably higher on 15, 16 and 18 June. For example, the difference between these quantities was as high as 20 and 10 Mm−1on the 8 June at T0 and T1, respectively. Similar trends were also observed for estimated and modeledβscaat 1064 nm with substantial deviations during
5
coarse mode events. During these days, significant amounts of coarse mode particles consisting of sea salt were transported from the Pacific Ocean to the Sacramento area (Zaveri et al., 2012; Fast et al., 2012). The largest discrepancies between the estimated and measured βsca observed during the dominant transport period of coarse mode particles suggest a partial loss of coarse mode particles in sampling lines between
10
the APS and PA instruments. The APS was located directly below the inlet, minimally impacted by any bends or elbows in the aerosol delivery system, while the PA and CRD instruments were placed inside the trailer. The regression analyses at 532 and 1064 nm were examined (inset panel, Fig. 10) when CRD, PA, SMPS, and APS were operating successfully, for the common period from the 12 to 22 June. The comparison
15
shows an excellent correlation ofR2=0.89 to 0.85, but the estimatedβscawere a factor of 1.20 and 2.06 larger at 532 and 1064 nm, respectively. In general, discrepancies between the measured and estimatedβsca for the shorter wavelengths (e.g. 355 and 532 nm) are understandable if we consider 5 % and 15 % uncertainties for βabs and
βscameasurements when using PA (Lewis et al., 2008), including other errors linked to
20
the measurements of aerosol size and concentrations. However, the more than double overestimation of theβscaat 1064 nm could have been caused by coarse mode particle loss in the inlet system, as well as the effect of nonspherical particle scattering for the coarse mode particles.
The time series as well as the regression analysis between the measured and
esti-25
matedβscafor T1 are also examined at 355 and 1064 nm and are presented in Fig. 10
ACPD
13, 7113–7150, 2013Evolution of multispectral aerosol
optical properties
M. Gyawali et al.
Title Page
Abstract Introduction
Conclusions References
Tables Figures
◭ ◮
◭ ◮
Back Close
Full Screen / Esc
Printer-friendly Version Interactive Discussion
Discussion
P
a
per
|
Dis
cussion
P
a
per
|
Discussion
P
a
per
|
Discussio
n
P
a
per
|
coefficients were a factor of 0.87 and 0.89 lower than the measured values for T1 at 355 and 1064 nm, respectively.
Electron microscopy analysis shows that relative abundance of spherical or near-spherical particles compared to total number of particles is approximately 44 % (295 of 670 particle) and 70 % (350 of 500 particles) for T0 and T1, respectively. Soot particles
5
at T1 (Fig. 6) appeared more compacted compared to T0 (Fig. 4) probably due to aging, resulting in more roundish structures. The more spherical morphology of the particles at T1 compared to that of T0 might explain the better correlation between the measured and estimatedβscausing Mie theory that assumes homogeneous spherical particles.
10
4 Summary
As part of the CARES field campaign in June 2010, multispectral measurements of aerosol light absorption, scattering, and extinction were obtained at the American River College campus (site T0) located within the Sacramento urban area, and at the North-side School campus (site T1) located in the forested Sierra Nevada foothills area, about
15
40 km to the northeast of the T0 site. The objective of this study was to characterize the evolution of the aerosol optical properties as the interactions between urban and biogenic emissions led to enhanced production of SOA during the southwesterly flow events. Under this predominant daytime flow pattern, the average SSA remained high (>0.9) at both sites due to increased SOA formation. In contrast, the SSA values were
20
appreciably lower during the occasional northwesterly flow events when both sites were impacted by fresh local emissions of BC.
During the last week of the campaign, under sustained southwesterly flow, the SOA mass increased significantly at both sites due to increased biogenic emissions coupled with intense photochemical activity and air mass recirculation in the area. This resulted
25
ACPD
13, 7113–7150, 2013Evolution of multispectral aerosol
optical properties
M. Gyawali et al.
Title Page
Abstract Introduction
Conclusions References
Tables Figures
◭ ◮
◭ ◮
Back Close
Full Screen / Esc
Printer-friendly Version Interactive Discussion
Discussion
P
a
per
|
Dis
cussion
P
a
per
|
Discussion
P
a
per
|
Discussio
n
P
a
per
|
deviations during the strong southwesterly flow events that brought coarse mode sea salt aerosols from the Pacific Ocean to the Sacramento area. Within the measure-ment uncertainties of PA, SMPS, and APS, the very good correlations (R2>0.85), with slopes ∼1 between the measured and estimated βsca, indicate that our Mie theory calculations were realistic for all wavelengths excluding 1064 nm at T0. The
overesti-5
mation of calculatedβscaat 1064 nm at T0 during the pronounced coarse-mode events appeared to be due to the loss of some coarse mode particles in the sampling lines between the APS and the optical instruments. The coarse mode scattering dominated at wavelengths≥870 nm.
The month-long daytime average ˚Angstr ¨om exponent of absorption (AEA) was∼1.6
10
for the wavelength pair 405 and 870 nm at T0, while it was∼1.8 for the wavelength pair 355 and 870 nm at T1, indicating a modest wavelength-dependence of absorption at both sites throughout the study. During the last week of the campaign (i.e. the period when SOA mass increased significantly), the BC mass-normalized absorption cross-section (MAC) for ultraviolet wavelengths at T1 increased by∼60 % compared to that of
15
the relatively less aged urban emissions at the T0 site. In contrast, the MAC values for 870 nm wavelength were nearly identical at T0 and T1. These results suggest formation of moderately brown SOA in biogenically-influenced urban air as opposed to absorption enhancement due to the lensing effect caused by SOA coating. While these results are generally consistent with the conclusions of Cappa et al. (2012), detailed model
20
analysis of the absorption data, constrained with the observed BC coating thickness and morphological information, is needed to estimate the relative contributions of brown SOA and the potential lensing effect caused by it to the total multispectral absorption observations at both sites.
Acknowledgements. This research is based upon work supported by NASA EPSCoR
un-25
der Cooperative Agreement No. NNX10AR89A and by NASA ROSES under Grant No. NNX11AB79G. We would like to acknowledge Pacific Northwest National Laboratory (PNNL) for providing the funding for data collection during the CARES campaign. This work was also supported by the US Department of Energy’s Atmospheric System Research (ASR) Program under Contract DE-AC06-76RLO 1830 at PNNL and LANLF265 to Los Alamos National
ACPD
13, 7113–7150, 2013Evolution of multispectral aerosol
optical properties
M. Gyawali et al.
Title Page
Abstract Introduction
Conclusions References
Tables Figures
◭ ◮
◭ ◮
Back Close
Full Screen / Esc
Printer-friendly Version Interactive Discussion
Discussion
P
a
per
|
Dis
cussion
P
a
per
|
Discussion
P
a
per
|
Discussio
n
P
a
per
|
ratory. Supports for AS and QZ was provided by the Office of Science (BER), US Department
of Energy, Atmospheric System Research Program, Grant No. DE-FG02-11ER65293.
References
Abu-Rahmah, A., Arnott, W. P., and Moosm ¨uller, H.: Integrating nephelometer with a low trun-cation angle and an extended calibration scheme, Meas. Sci. Technol., 17, 1723–1732,
5
doi:10.1088/0957-0233/17/7/010, 2006.
Andreae, M. O. and Crutzen, P. J.: Atmospheric aerosols: biogeochemical sources and role in atmospheric chemistry, Science, 276, 1052–1058, doi:10.1126/science.276.5315.1052, 1997.
Andreae, M. O. and Gelencs ´er, A.: Black carbon or brown carbon? The nature of light-absorbing
10
carbonaceous aerosols, Atmos. Chem. Phys., 6, 3131–3148, doi:10.5194/acp-6-3131-2006, 2006.
Arnott, W., Moosm ¨uller, H., Rogers, C., Jin, T., and Bruch, R.: Photoacoustic spectrometer for measuring light absorption by aerosol: instrument description, Atmos. Environ., 33, 2845– 2852, 1999.
15
Bond, T. and Bergstrom, R.: Light absorption by carbonaceous particles: an investigative re-view, Aerosol Sci. Tech., 40, 27–67, doi:10.1080/02786820500421521, 2006.
Cappa, C. D., Che, D. L., Kessler, S. H., Kroll, J. H., and Wilson, K. R.: Variations in organic aerosol optical and hygroscopic properties upon heterogeneous OH oxidation, J. Geophys. Res., 116, D15204, doi:10.1029/2011JD015918, 2011.
20
Cappa, C. D., Onasch, T. B., Massoli, P., Worsnop, D. R., Bates, T. S., Cross, E. S., Davidovits, P., Hakala, J., Hayden, K. L., Jobson, B. T., Kolesar, K. R., Lack, D. A., Lerner, B. M., Li, S.-M., Mellon, D., Nuaaman, I., Olfert, J. S., Pet ¨aj ¨a, T., Quinn, P. K., Song, C., Subramanian, R., Williams, E. J., and Zaveri, R. A.: Radiative absorption en-hancements due to the mixing state of atmospheric black carbon, Science 337, 1078–1081,
25
doi:10.1126/science.1223447, 2012.
Chakrabarty, R. K., Moosm ¨uller, H., Chen, L.-W. A., Lewis, K., Arnott, W. P., Mazzoleni, C., Dubey, M. K., Wold, C. E., Hao, W. M., and Kreidenweis, S. M.: Brown carbon in tar balls from smoldering biomass combustion, Atmos. Chem. Phys., 10, 6363–6370, doi:10.5194/acp-10-6363-2010, 2010.
ACPD
13, 7113–7150, 2013Evolution of multispectral aerosol
optical properties
M. Gyawali et al.
Title Page
Abstract Introduction
Conclusions References
Tables Figures
◭ ◮
◭ ◮
Back Close
Full Screen / Esc
Printer-friendly Version Interactive Discussion
Discussion
P
a
per
|
Dis
cussion
P
a
per
|
Discussion
P
a
per
|
Discussio
n
P
a
per
|
Chakrabarty, R. K., Arnold, I. J., Francisco, J. D., Hatchett, B., Hosseinpour, F., Lo-ria, M., Pokharel, A., and Woody, B. M.: Black and brown carbon fractal aggregates from combustion of two fuels widely used in Asian rituals, J. Quant. Spectrosc. Ra., doi:10.1016/j.jqsrt.2012.12.011, in press, 2013.
Charlson, R., Schwartz, S., Hales, J., Cess, R., Coakley, J., Hansen, J., and
5
Hofman, D.: Climate forcing by anthropogenic aerosols, Science, 255, 423–430, doi:10.1126/science.255.5043.423, 1992.
Chylek, P. and Wong, J.: Effect of absorbing aerosols on global radiation budget, Geophys. Res.
Lett., 22, 929–931, 1995.
Climate Change 2007: The Physical Science Basis? Contribution of Working Group I to the
10
Fourth Assessment Report of the Intergovernmental Panel on Climate Change, edited by: Solomon, S., Qin, D., Manning, M., Chen, Z., Marquis, M., Averyt, K. B., Tignor, M., and Miller, H. L., Cambridge University Press, New York, NY, USA, 2007.
Coakley, J. A., Bernstein, R. L., and Durkee, P. A.: Effect of ship-stack effluents on cloud
reflec-tivity, Science, 237, 1020–1022, doi:10.1126/science.237.4818.1020, 1987.
15
Cross, E. S., Onasch, T. B., Ahern, A., Wrobel, W., Slowik, J., Olfert, J., Lack, D., Massoli, P., Cappa, C., Schwarz, J., Spackman, R., Fahey, D., Sedlacek, A., Trimborn, A., Jayne, J., Freedman, A., Williams, L., Ng, N. L., Mazzoleni, C., Dubey, M., Brem, B., Kok, G., Subra-manian, R., Freitag, S., Clarke, A., Thornhill, D., Marr, L., Kolb, C., Worsnop, D., and Davi-dovits, P.: Soot particle studies – instrument inter-comparison – project overview, Aerosol
20
Sci. Tech., 44, 592–611, 2010.
Doran, J. C.: Corrigendum to “The T1-T2 study: evolution of aerosol properties downwind of Mexico City” published in Atmos. Chem. Phys., 7, 1585–1598, 2007, Atmos. Chem. Phys., 7, 2197–2198, 2007,
http://www.atmos-chem-phys.net/7/2197/2007/.
25
Fast, J. D., Gustafson Jr., W. I., Berg, L. K., Shaw, W. J., Pekour, M., Shrivastava, M., Barnard, J. C., Ferrare, R. A., Hostetler, C. A., Hair, J. A., Erickson, M., Jobson, B. T., Flowers, B., Dubey, M. K., Springston, S., Pierce, R. B., Dolislager, L., Pederson, J., and Zaveri, R. A.: Transport and mixing patterns over Central California during the
carbona-ceous aerosol and radiative effects study (CARES), Atmos. Chem. Phys., 12, 1759–1783,
30
doi:10.5194/acp-12-1759-2012, 2012.
ACPD
13, 7113–7150, 2013Evolution of multispectral aerosol
optical properties
M. Gyawali et al.
Title Page
Abstract Introduction
Conclusions References
Tables Figures
◭ ◮
◭ ◮
Back Close
Full Screen / Esc
Printer-friendly Version Interactive Discussion
Discussion
P
a
per
|
Dis
cussion
P
a
per
|
Discussion
P
a
per
|
Discussio
n
P
a
per
|
carbonaceous aerosols observed at Jeju Island; 3-laser photoacoustic spectrometer, par-ticle sizing, and filter analysis, Atmos. Chem. Phys., 10, 10387–10398, doi:10.5194/acp-10-10387-2010, 2010.
Gyawali, M., Arnott, W. P., Lewis, K., and Moosm ¨uller, H.: In situ aerosol optics in Reno, NV, USA during and after the summer 2008 California wildfires and the influence of absorbing
5
and non-absorbing organic coatings on spectral light absorption, Atmos. Chem. Phys., 9, 8007–8015, doi:10.5194/acp-9-8007-2009, 2009.
Gyawali, M., Arnott, W. P., Zaveri, R. A., Song, C., Moosm ¨uller, H., Liu, L., Mishchenko, M. I., Chen, L.-W. A., Green, M. C., Watson, J. G., and Chow, J. C.: Photoacoustic optical proper-ties at UV, VIS, and near IR wavelengths for laboratory generated and winter time ambient
10
urban aerosols, Atmos. Chem. Phys., 12, 2587–2601, doi:10.5194/acp-12-2587-2012, 2012. Haywood, J. M. and Ramaswamy, V.: Global sensitivity studies of the direct radiative forcing
due to anthropogenic sulfate and black carbon aerosols, J. Geophys. Res., 103, 6043–6058, doi:10.1029/97JD03426, 1998.
Kassianov, E., Pekour, M., and J. Barnard, J.: Aerosols in central California: unexpectedly large
15
contribution of coarse mode to aerosol radiative forcing, Geophys. Res. Lett., 39, L20806, doi:10.1029/2012GL053469, 2012.
Kerker, M.: The Scattering of Light, and Other Electromagnetic Radiation, Academic Press, New York, NY, USA, 1969.
Kirchstetter, T. W., Novakov, T., and Hobbs, P. V.: Evidence that the spectral dependence of
20
light absorption by aerosols is affected by organic carbon, J. Geophys. Res., 109, D21208,
doi:10.1029/2004JD004999, 2004.
Laborde, M., Mertes, P., Zieger, P., Dommen, J., Baltensperger, U., and Gysel, M.: Sensitivity
of the Single Particle Soot Photometer to different black carbon types, Atmos. Meas. Tech.,
5, 1031–1043, doi:10.5194/amt-5-1031-2012, 2012.
25
Lack, D. A. and Cappa, C. D.: Impact of brown and clear carbon on light absorption enhance-ment, single scatter albedo and absorption wavelength dependence of black carbon, Atmos. Chem. Phys., 10, 4207–4220, doi:10.5194/acp-10-4207-2010, 2010.
Lack, D. A., Langridge, J. M., Bahreini, R., Brock, C. A., Middlebrook, A. M., and Schwarz, J. P.: Brown Carbon and Internal Mixing in Biomass Burning Particles, P. Natl. Acad. Sci., 109,
30
14802–14807, doi:10.1073/pnas.1206575109, 2012.
ACPD
13, 7113–7150, 2013Evolution of multispectral aerosol
optical properties
M. Gyawali et al.
Title Page
Abstract Introduction
Conclusions References
Tables Figures
◭ ◮
◭ ◮
Back Close
Full Screen / Esc
Printer-friendly Version Interactive Discussion
Discussion
P
a
per
|
Dis
cussion
P
a
per
|
Discussion
P
a
per
|
Discussio
n
P
a
per
|
photoacoustic instrument, J. Geophys. Res., 113, D16203, doi:10.1029/2007JD009699, 2008.
Moffet, R. C. and Prather, K. A.: In-situ measurements of the mixing state and optical properties
of soot with implications for radiative forcing estimates, P. Natl. Acad. Sci. USA, 106, 11872– 11877, doi:10.1073/pnas.0900040106, 2009.
5
Moosm ¨uller, H. and Chakrabarty, R. K.: Technical Note: Simple analytical relationships
be-tween ˚Angstr ¨om coefficients of aerosol extinction, scattering, absorption, and single
scatter-ing albedo, Atmos. Chem. Phys., 11, 10677–10680, doi:10.5194/acp-11-10677-2011, 2011. Moosm ¨uller, H., Chakrabarty, R. K., and Arnott, W. P.: Aerosol light absorption and its
measure-ment: a review, J. Quant. Spectrosc. Ra., 110, 844–878, doi:10.1016/j.jqsrt.2009.02.035,
10
2009.
Moosm ¨uller, H., Chakrabarty, R. K., Ehlers, K. M., and Arnott, W. P.: Absorption ˚Angstr ¨om
coefficient, brown carbon, and aerosols: basic concepts, bulk matter, and spherical particles,
Atmos. Chem. Phys., 11, 1217–1225, doi:10.5194/acp-11-1217-2011, 2011.
Moteki, N. and Kondo, Y.: Dependence of laser-induced incandescence on physical properties
15
of black carbon aerosols: measurements and theoretical interpretation, Aerosol Sci. Tech., 44, 663–675, doi:10.1080/02786826.2010.484450, 2010.
Radney, J. G., Bazargan, M. H., Wright, M. E., and Atkinson, D. B.: Laboratory validation of
aerosol extinction coefficient measurements by a field-deployable pulsed cavity ring-down
transmissometer, Aerosol Sci. Tech. 43, 71–80, doi:10.1080/02786820802482536, 2009.
20
Ramanathan, V., Chung, C., Kim, D., Bettge, T., Buja, L., Kiehl, J., Washington, W., Fu, Q., Sikka, D., and Wild, M.: Atmospheric brown clouds: impacts on South Asian climate and hydrological cycle, P. Natl. Acad. Sci. USA, 102, 5326–5333, doi:10.1073/pnas.0500656102, 2005.
Redemann, J., Russell, P., and Hamill, P.: Dependence of aerosol light absorption and
single-25
scattering albedo on ambient relative humidity for sulfate aerosols with black carbon cores, J. Geophys. Res., 106, 27485–27495, doi:10.1029/2001JD900231, 2001.
Reid, J. S., Hobbs, P. V., Ferek, R. J., Blake, D. R., Martins, J. V., Dunlap, M. R., and Liousse, C.: Physical, chemical, and optical properties of regional hazes dominated by smoke in Brazil, J. Geophys. Res., 103, 32059–32080, doi:10.1029/98JD00458, 1998.
30
ACPD
13, 7113–7150, 2013Evolution of multispectral aerosol
optical properties
M. Gyawali et al.
Title Page
Abstract Introduction
Conclusions References
Tables Figures
◭ ◮
◭ ◮
Back Close
Full Screen / Esc
Printer-friendly Version Interactive Discussion
Discussion
P
a
per
|
Dis
cussion
P
a
per
|
Discussion
P
a
per
|
Discussio
n
P
a
per
|
Schwartz, S.: The Whitehouse effect – Shortwave radiative forcing of climate by anthropogenic
aerosols: an overview, J. Aerosol. Sci., 27, 359–382, doi:10.1016/0021-8502(95)00533-1, 1996.
Schwarz, J. P., Gao, R. S., Fahey, D. W., Thomson, D. S., Watts, L. A., Wilson, J. C., Reeves, J. M., Darbeheshti, M., Baumgardner, D. G., Kok, G. L., Chung, S. H., Schulz, M.,
5
Hendricks, J., Lauer, A., K ¨archer, B., Slowik, J. G., Rosenlof, K. H., Thompson, T. L., Lang-ford, A. O., Loewenstein, M., and Aikin, K. C.: Single-particle measurements of midlati-tude black carbon and light-scattering aerosols from the boundary layer to the lower strato-sphere, J. Geophys. Res., 111, D16207, doi:10.1029/2006JD007076, 2006.
Seinfeld, J. H. and Pandis, S. N.: Atmospheric Chemistry and Physics: From Air Pollution to
10
Climate Change, Wiley, New York, NY, 2006.
Setyan, A., Zhang, Q., Merkel, M., Knighton, W. B., Sun, Y., Song, C., Shilling, J. E., Onasch, T. B., Herndon, S. C., Worsnop, D. R., Fast, J. D., Zaveri, R. A., Berg, L. K., Wieden-sohler, A., Flowers, B. A., Dubey, M. K., and Subramanian, R.: Characterization of submicron particles influenced by mixed biogenic and anthropogenic emissions using high-resolution
15
aerosol mass spectrometry: results from CARES, Atmos. Chem. Phys., 12, 8131–8156, doi:10.5194/acp-12-8131-2012, 2012.
Shilling, J. E., Zaveri, R. A., Fast, J. D., Kleinman, L., Alexander, M. L., Canagaratna, M. R., Fort-ner, E., Hubbe, J. M., Jayne, J. T., Sedlacek, A., Setyan, A., Springston, S., Worsnop, D. R., and Zhang, Q.: Enhanced SOA formation from mixed anthropogenic and biogenic emissions
20
during the CARES campaign, Atmos. Chem. Phys., 13, 2091–2113, doi:10.5194/acp-13-2091-2013, 2013.
Sloane, C.: Optical properties of aerosols of mixed composition, Atmos. Environ., 18, 871–878, doi:10.1016/0004-6981(84)90273-7, 1984.
Smith, J. D. and Atkinson, D. B.: A portable pulsed cavity ring-down transmissometer for
mea-25
surement of the optical extinction of the atmospheric aerosol, Analyst, 126, 1216–1220, 2001.
Subramanian, R., Kok, G. L., Baumgardner, D., Clarke, A., Shinozuka, Y., Campos, T. L., Heizer, C. G., Stephens, B. B., de Foy, B., Voss, P. B., and Zaveri, R. A.: Black carbon over
Mexico: the effect of atmospheric transport on mixing state, mass absorption cross-section,
30
and BC/CO ratios, Atmos. Chem. Phys., 10, 219–237, doi:10.5194/acp-10-219-2010, 2010. Twomey, S.: The influence of pollution on the shortwave albedo of clouds, J. Atmos. Sci., 34,