ACPD
12, 15639–15674, 2012Impact of relative humidity and particles size distribution
Z. J. Lin et al.
Title Page
Abstract Introduction
Conclusions References
Tables Figures
◭ ◮
◭ ◮
Back Close
Full Screen / Esc
Printer-friendly Version Interactive Discussion
Discussion
P
a
per
|
Dis
cussion
P
a
per
|
Discussion
P
a
per
|
Discussio
n
P
a
per
|
Atmos. Chem. Phys. Discuss., 12, 15639–15674, 2012 www.atmos-chem-phys-discuss.net/12/15639/2012/ doi:10.5194/acpd-12-15639-2012
© Author(s) 2012. CC Attribution 3.0 License.
Atmospheric Chemistry and Physics Discussions
This discussion paper is/has been under review for the journal Atmospheric Chemistry and Physics (ACP). Please refer to the corresponding final paper in ACP if available.
Impact of relative humidity and particles
size distribution on aerosol light
extinction in urban area of Guangzhou
Z. J. Lin1,2, J. Tao2,3, F. H. Chai4, S. J. Fan1, J. H. Yue2, and L. H. Zhu1,2
1
Department of Atmospheric Science, Sun Yat-Sen University, Guangzhou, China
2
South China Institute of Environmental Sciences (SCIES), Guangzhou, China
3
Department of Environmental Science, Sun Yat-Sen University, Guangzhou, China
4
Chinese Research Academy of Environmental Sciences, Beijing, China
Received: 6 June 2012 – Accepted: 11 June 2012 – Published: 22 June 2012
Correspondence to: S. J. Fan (eesfsj@mail.sysu.edu.cn)
ACPD
12, 15639–15674, 2012Impact of relative humidity and particles size distribution
Z. J. Lin et al.
Title Page
Abstract Introduction
Conclusions References
Tables Figures
◭ ◮
◭ ◮
Back Close
Full Screen / Esc
Printer-friendly Version Interactive Discussion
Discussion
P
a
per
|
Dis
cussion
P
a
per
|
Discussion
P
a
per
|
Discussio
n
P
a
per
|
Abstract
In urban area of Guangzhou, an experiment was conducted at the monitoring site of SCIES in order to recognize the impact of relative humidity (RH) and particles size dis-tribution on aerosol light extinction during 2009 to 2010. Water-soluble ions and OC/EC in daily PM2.5samples was determined by the Dionex ion chromatography and the DIR
5
model 2001 carbon analyzer, respectively; particles size distribution was measured by TSI 3321 APS; and total light scattering coefficient was measured by TSI 3565 Neph-elometer. Inorganic salts that constitute PM2.5were recognized under an assumption of
the electrical charge neutrality, while chemical components as POM, EC and water con-tent were determined by means of hygroscopic growth calculation and chemical mass
10
closure. As a result, (NH4)2SO4, NaNO3, POM, EC and water content were found to be the major components. By the Mie Model, light scattering and absorption coefficient of PM0.5−2.5were estimated on the basis of the chemical composition of PM2.5and the
size distribution of number concentration of PM0.5−2.5. This estimation was evaluated by results from Nephelometer measurement and proved to have high accuracy. With
15
the knowledge of hygroscopic growth of some inorganic salts, it was realized that opti-cal properties of PM0.5−2.5greatly depended on relative humidity, while light extinction was enhanced averagely 1.23, 1.38 and 1.75 times at 70 %, 80 % and 90 % RH, re-spectively. Moreover, light extinction coefficient of PM0.5−2.5 increased averagely 1.24
to 1.28 times during wet days while merely 1.04 times in dry days. Furthermore,
com-20
bined results from Nephelometer, the knowledge of relation between EC and aerosol light absorption and the Mie Model estimation, size distribution of total light extinction coefficient was determined. PM1contributed averagely 76 %, 85 %, 94 % and 93 % to light extinction in spring, summer, autumn and winter, respectively, while the contribu-tions from PM2.5were 94 % at least.
ACPD
12, 15639–15674, 2012Impact of relative humidity and particles size distribution
Z. J. Lin et al.
Title Page
Abstract Introduction
Conclusions References
Tables Figures
◭ ◮
◭ ◮
Back Close
Full Screen / Esc
Printer-friendly Version Interactive Discussion
Discussion
P
a
per
|
Dis
cussion
P
a
per
|
Discussion
P
a
per
|
Discussio
n
P
a
per
|
1 Introduction
Atmospheric aerosol influences radiation budget of the earth-atmosphere system by scattering and absorbing solar radiation (Seinfeld and Spyros, 2006). Pollution caused by aerosol will enhance this light extinction effect. Furthermore, the aerosol impact on climate change will also be enhanced accordingly. With regard to the Mie Theory, to
5
recognize size distribution of aerosol particle numbers and light extinction efficiency of a single particle are the keys to quantify light extinction effect (Seinfeld and Spyros, 2006). Aerosol absorbs water with an increasing relative humidity (RH). It should be taken into account in a place with a damp climate for this hygroscopic property will increase aerosol size and change optical properties of aerosol population. In the past
10
century, scientists studied hygroscopic growth of some inorganic salts that constitute aerosol in order to quantify hygroscopic growth factor of aerosol population (Tang and Munkelwitz, 1994; Tang, 1996; Tang et al., 1997). Those studies related RH to aerosol size growth through laboratory measurement. Later on, a parallel observation with the Twin Differential Mobility Particle Sizer (TDMPS) and the Humidifying Differential
Mo-15
bility Particle Sizer (H-DMPS) was used to directly measure particles size distribution and hygroscopic growth of the ambient aerosol particles smaller than 1 µm (Eichler et al., 2008). Moreover, with the combination of the Micro-Orifice Uniform Deposition Impactor (MOUDI); the Aerodynamic Particle Sizer (APS) and the knowledge of hy-groscopic growth factor of some inorganic salts, it’s able to determine particles size
20
distribution and hygroscopic growth factor of the aerosol particles larger than 1 µm (Eichler et al., 2008).
Since socioeconomic developed in recent years, pollution caused by fine aerosol particles in Guangzhou and its surrounding area has attracted more and more atten-tions from the public and scientists. Lots of researches were carried out in order to
25
ACPD
12, 15639–15674, 2012Impact of relative humidity and particles size distribution
Z. J. Lin et al.
Title Page
Abstract Introduction
Conclusions References
Tables Figures
◭ ◮
◭ ◮
Back Close
Full Screen / Esc
Printer-friendly Version Interactive Discussion
Discussion
P
a
per
|
Dis
cussion
P
a
per
|
Discussion
P
a
per
|
Discussio
n
P
a
per
|
and Cao, 2009). Moreover, using methods mentioned above and the numerical simu-lation technique, integrated experiments of the PRIDE-PRD2004 in October 2004 and the PRIDE-PRD2006 in July 2006 were conducted in both urban and rural area of Guangzhou. These experiments focused on the formation mechanism of aerosol pol-lution including chemical transformation and driven force from regional meteorological
5
condition (Fan et al., 2008; Su et al., 2008; Zhang et al., 2008a, b; Fan et al., 2011), size-resolve chemical composition and pollutant sources (Gnauk et al., 2008; Liu et al., 2008a, b; Jung et al., 2009; Xiao et al., 2010; Yu et al., 2010; Yue et al., 2010), mixing state of the EC and other non-light-absorption compound in aerosol (Cheng et al., 2006, 2008b), aerosol optical properties, radiative direct forcing and their RH
de-10
pendence (Andreae et al., 2008; Cheng et al., 2008b; Eichler et al., 2008; Liu et al., 2010).
As well as in summer and autumn, it is necessary to characterize the temporal vari-ation of aerosol light extinction effect in spring and winter regarding to the connection between meteorological condition and air pollution. To what extent, the weather during
15
spring and winter in South China is frequently influenced by co-effects of cold air mass from the inland and warm air mass from the sea. Moreover, few studies were reported on a long term impact of RH and particles size distribution on aerosol light extinction in urban area of Guangzhou. For the purpose of an updated and complementary study on this topic, a series of experiment were carried out at the monitor site of SCIES during
20
ACPD
12, 15639–15674, 2012Impact of relative humidity and particles size distribution
Z. J. Lin et al.
Title Page
Abstract Introduction
Conclusions References
Tables Figures
◭ ◮
◭ ◮
Back Close
Full Screen / Esc
Printer-friendly Version Interactive Discussion
Discussion
P
a
per
|
Dis
cussion
P
a
per
|
Discussion
P
a
per
|
Discussio
n
P
a
per
|
2 Experimental
2.1 Monitoring site
The monitoring site of SCIES locates in Guangzhou city where geographical coordi-nates are 23◦07′N and 113◦21′E. It was designed for monitoring air quality influenced
by pollutant regional transport and local sources emission. For this reason, instruments
5
were installed on roof of the main building with a height of 53 m. This site was built with a clear vision over 300◦, around which there is a residential area and a park about 500 m
northeast to it. There does not seem to be any big source of air pollution but mobile emissions within circumference of 3 km. A satellite photo depicting the site’s location and its surroundings is illustrated in Fig. 1. So far, data on aerosol samples, gaseous
10
pollutants and meteorological parameters have been accumulated over a long period of time at this site. Previous works on the basis of these data can be read in open literatures (Tao et al., 2009, 2010, 2012).
2.2 Sampling and analysis
The measured aerosol properties and meteorological parameters during these
experi-15
ments are listed in Table 1. The output from Nephelometer, APS and automatic weather station were hourly averaged before further analysis.
1. PM2.5 sampling. During these experiments from 2009 to 2010, PM2.5 samples
were measured by an air sampler (BGI Corporation, Model PQ200) equipped with a cyclone that separates PM2.5 particles from the aerosol population and
20
with a vacuum pump that draws air at a rate of 16.7 l min−1. The drawn airstream
is connected to a 47 mm quartz filter (Whatman, QM-A). Before sampling, the quartz filters are baked at 800◦C for more than 3 h to remove adsorbed organic
vapors, and then equilibrated in desiccators for 24 h. Prior to the measurement in ambient, the flow rate of PM2.5 sampler is calibrated. Blank filters are collected
25
ACPD
12, 15639–15674, 2012Impact of relative humidity and particles size distribution
Z. J. Lin et al.
Title Page
Abstract Introduction
Conclusions References
Tables Figures
◭ ◮
◭ ◮
Back Close
Full Screen / Esc
Printer-friendly Version Interactive Discussion
Discussion
P
a
per
|
Dis
cussion
P
a
per
|
Discussion
P
a
per
|
Discussio
n
P
a
per
|
daily quartz-filter samples with some blank ones were collected for every 23.5 h (starting at 10:00 LST each day and ending at 09:30 LST the following day). The analysis-ready samples were stored in a freezer at about−20◦C in case of
parti-cles volatilization.
2. OC/EC determination. A punch of 0.5 cm2 from the collected quartz filter was
5
analyzed for eight carbon fractions following the IMPROVE A thermal/optical reflectance (TOR) protocol by a DIR model 2001 carbon analyzer (Atmoslytic Inc., Calabasas, CA) (Cao et al., 2007; Chow et al., 2007). This process pro-duced four OC fractions (OC1, OC2, OC3 and OC4) at 140◦C, 280◦C, 480◦C
and 580◦C, respectively, in a helium [He] atmosphere; OP (a pyrolyzed
car-10
bon fraction) was determined when transmitted laser light attained its original intensity after oxygen [O2] added to that analysis atmosphere; and three EC
fractions (EC1, EC2 and EC3) at 580◦C, 740◦C and 840◦C, respectively, in a
(2 %) O2/(98 %) [He] atmosphere. In practice, IMPROVE TOR OC is defined as OC1+OC2+OC3+OC4+OP, while EC is defined as EC1+EC2+EC3−OP
15
(Chow et al., 2007). Inter-laboratory sample comparisons between applying the IMPROVE TOR protocol and the TMO (thermal manganese dioxide oxidation) ap-proach have shown the differences being lower than 5 % for TC and 10 % for OC and EC (Chow et al., 2007). Average field blanks were 1.8 and 0.1 µg m−3for OC
and EC, respectively.
20
3. Water-soluble ions determination.One quarter of the collected quartz filter sample was used to determine the mass concentrations of water-soluble ions. Four an-ions (SO2−
4 , NO
−
3, Cl
− and F−) and five cations (Na+, NH+
4, K
+, Mg2+and Ca2+) in
aqueous extracts from the filter were determined by ion chromatography (Dionex Corp, Sunnyvale, CA, Model Dionex 600). For these extractions, each sample was
25
ACPD
12, 15639–15674, 2012Impact of relative humidity and particles size distribution
Z. J. Lin et al.
Title Page
Abstract Introduction
Conclusions References
Tables Figures
◭ ◮
◭ ◮
Back Close
Full Screen / Esc
Printer-friendly Version Interactive Discussion
Discussion
P
a
per
|
Dis
cussion
P
a
per
|
Discussion
P
a
per
|
Discussio
n
P
a
per
|
pre-cleaned tube before further analysis. Cation (Na+, NH+4, K+, Mg2+ and Ca2+) concentrations were determined with a CS12A column (Dionex Corp, Sunnyvale, CA.) and 20 mmol l−1MSA eluent. Anions (SO2−
4 , NO
−
3, Cl
− and F−) were
sepa-rated by an AS11-HC column (Dionex Corp, Sunnyvale, CA) and 20 mmol l−1KOH
eluent. The limits of detection were less than 0.05 mg l−1for both cations and
an-5
ions. Standard reference materials produced by the National Research Centre for Certified Reference Materials in China were analyzed for quality assurance pur-poses. Blank values were subtracted from sample concentrations (Shen et al., 2009).
4. Nephelometer deployment.Total light scattering coefficient of aerosol was
mea-10
sured by an integrating Nephelometer (TSI Performance Measurement Tools, Model 3563) in wavelengths of 450 nm, 550 nm and 700 nm, respectively. Neph-elometer calibration was performed by carbon dioxide (CO2) as high-span gas
and filtered air as low-span gas. Nephelometer draws ambient air through a temperature-controlled inlet at a flow rate of 20 l min−1. The inner heater controls
15
the RH of aerosol intake at a level lower than nearly 70 %. The output data were set to 1 min averaged in these experiments, and zero level data was measured continuously for 5 min after each hourly (60 min) sampling.
5. APS deployment.Size distribution of number concentration of aerosol was mea-sured by APS (TSI Aerodynamic Sizer, Model 3321) with 52 size bins in diameter
20
range from 0.5–20 µm by determining time-of-flight of individual particle in an ac-celerating flow field. A drying tube was added before drawing air to capture dry aerosol. Flow rate of 5 l min−1and 5 min data averaged were set in APS operation.
6. Weather station deployment.Ambient relative humidity had been recorded by an automatic weather station (VASALA Model QMH102) installed 3 m above the roof.
ACPD
12, 15639–15674, 2012Impact of relative humidity and particles size distribution
Z. J. Lin et al.
Title Page
Abstract Introduction
Conclusions References
Tables Figures
◭ ◮
◭ ◮
Back Close
Full Screen / Esc
Printer-friendly Version Interactive Discussion
Discussion
P
a
per
|
Dis
cussion
P
a
per
|
Discussion
P
a
per
|
Discussio
n
P
a
per
|
3 Methodology
3.1 Chemical component determination
Recognizing chemical compounds that constitute aerosol particles is necessary for determining the thermodynamic and optical properties of aerosol population. For fine aerosol, components include inorganic salts, POM, EC and the water taken up by the
5
salts.
3.1.1 Inorganic salt
Under an assumption of the electrical charge neutrality (Eichler et al., 2008), identifica-tion to associaidentifica-tions among the water-soluble ions raised a recogniidentifica-tion of the inorganic salts. The cations identified from PM2.5 samples were Na+, NH+4, K+, Mg2+ and Ca2+,
10
while the anions were SO2−
4 , NO
−
3 and Cl
−.
In the light of previous studies (Seinfeld and Spyros, 2006; Cheng et al., 2008c; Han et al., 2009; Yue et al., 2011), it is usually considered that for fine particles: (1) NH+4, SO2−
4 and NO
−
3 are mainly from secondary transformations, and NH
+
4 associates with
SO2−
4 to become (NH4)2SO4, if any remains, then it associates with NO−3 to become
15
NH4NO3; (2) biomass burn is responsible for K+ and Cl−, K+ associates with Cl− to
become KCl, if any remains, then it associates with SO2−
4 to become K2SO4; (3) Na+
associates with Cl−in sea salt to become NaCl. However, NaCl will react with gaseous
nitric acid to produce sodium nitrate in the process of atmospheric diffusion. Hence Na+ associates with NO−
3 to become NaNO3, if any remains, then it associates with SO 2−
4
20
to become Na2SO4; (4) sea salt and soil are the sources of Mg
2+ and Ca2+. Ca2+
associates with NO−
3, if any remains, it associates with SO 2−
4 and Cl
− in succession.
It’s the similar case with Mg2+. Following these associations, inorganic salts including (NH4)2SO4, NH4NO3, NaNO3, Na2SO4, KCl, NaCl, Ca(NO3)2, Mg(NO3)2, K2SO4and CaSO4can be recognized.
ACPD
12, 15639–15674, 2012Impact of relative humidity and particles size distribution
Z. J. Lin et al.
Title Page
Abstract Introduction
Conclusions References
Tables Figures
◭ ◮
◭ ◮
Back Close
Full Screen / Esc
Printer-friendly Version Interactive Discussion
Discussion
P
a
per
|
Dis
cussion
P
a
per
|
Discussion
P
a
per
|
Discussio
n
P
a
per
|
3.1.2 POM and water content
As recommended in a previous study (Hand and Malm, 2006), a factor of 1.8 for ur-ban area was adapted to “convert” the mass of OC to that of POM. Since POM, EC and other unidentified components were considered to have no hygroscopic growth, the mass of water taken up by inorganic salts can be estimated based on hygroscopic
5
growth factors of inorganic salts following Eq. (1) wheremwandρwis mass concentra-tion and density of water uptake, respectively. Moreover,Vj stands for the volume of the j-th inorganic salts in aerosol, whilefg,j is the hygroscopic growth factor at a specified
RH.
mw=ρw·
X
j
Vj·
fg,3j−1
(1)
10
For the PM2.5samples were weighted in laboratory condition of 40 % RH, the inorganic
salts, POM, EC and water content were determined at this RH as well. Hence, the unidentified part in PM2.5, named the Residual, can be determined from the difference
between the total mass and the sum mass of the identified part. Similarly, the mass of aerosol at arbitrary RH can be determined into two parts. One is the salts, POM, EC
15
and the Residual at 40 % RH, while the other one is the water uptake at that desired RH.
3.2 Light scattering and absorption coefficient estimation
In consideration of instrumental deployment during these experiments, it is likely to introduce the internal mixing, one of simplifications about aerosol mixing status
(Sein-20
ACPD
12, 15639–15674, 2012Impact of relative humidity and particles size distribution
Z. J. Lin et al.
Title Page Abstract Introduction Conclusions References Tables Figures ◭ ◮ ◭ ◮ Back Close
Full Screen / Esc
Printer-friendly Version Interactive Discussion Discussion P a per | Dis cussion P a per | Discussion P a per | Discussio n P a per |
3.2.1 EORI and EGF
The EORI (Effective Optical Refractive Index) represents the averaged ORI of internally mixing aerosol population, which can be calculated with the ORIs of each chemical component in aerosol following mixing rules of Volume Average (Lesins et al., 2002). This mixing rule considers relationship among each chemical component as equally
5
weighed by their volumes, the formulas of which were written as Eq. (2) and Eq. (3).
neff=
X
j
nj·mj/ρj
, X j
mj/ρj
(2)
keff=
X
j
kj·mj/ρj
, X j
mj/ρj
(3)
In Eqs. (2) and (3),mj stands for the mass of thej-th component in aerosol, while ρj 10
is the density. Respectively,nj is the real part of ORI of the j-th component,kj is the
imaginary part. For the EORI,neffis the real part, andkeff is the imaginary part.
The EGF (Effective Hygroscopic Growth Factor) was the averaged hygroscopic growth factor of internally mixing aerosol, which can be calculated withfgof each
chem-ical component in aerosol following Zdanovskii-Stokes-Robinson assumption (Stokes
15
and Robinson, 1966). It can be depicted by Eq. (4).
feff=
X
j
aj·fg,3j
1/3
(4)
In Eq. (4), feff is the EGF. aj is the volume fraction of the j-th component in aerosol,
while fg,j is the hygroscopic growth factor. The fg of some inorganic salts had been
determined in previous studies (Tang and Munkelwitz, 1994; Tang, 1996; Kelly and
20
ACPD
12, 15639–15674, 2012Impact of relative humidity and particles size distribution
Z. J. Lin et al.
Title Page
Abstract Introduction
Conclusions References
Tables Figures
◭ ◮
◭ ◮
Back Close
Full Screen / Esc
Printer-friendly Version Interactive Discussion
Discussion
P
a
per
|
Dis
cussion
P
a
per
|
Discussion
P
a
per
|
Discussio
n
P
a
per
|
3.2.2 Mie Model estimation
According to the Mie Theory,bsp(light scattering coefficient) andbap (light absorption
coefficient) can be estimated with Eqs. (5) and (6), respectively (Bohren et al., 1998; Seinfeld and Spyros, 2006).
bsp=
X
j
bsp,j=
X
j πDj2
4 ·Qsp,j·Nj (5)
5
bap=
X
j
bap,j =
X
j πD2j
4 ·Qap,j·Nj (6)
Dj = Da,j
pρ
dry
·feff (7)
In Eqs. (5) and (6),Dj stands for the midpoint Stokes diameter in thej-th size range
10
of aerosol, whileNj is the number concentration of aerosol population with diameter Dj. Equation (7) converted Da,j from APS size bin to Dj required by the Mie Model,
and theNj corresponding to Da,j were from APS measurement. Moreover, the feff in
Eq. (7) was used to estimate the hygroscopic growth ofDj under an assumption that no
change in particles number concentration in the process of hygroscopic growth.Qsp,j 15
represents light scattering efficiency of a single particle with diameter Dj, whileQap,j
represents light absorption efficiency. At a given light wavelength, they both are the functions ofDj and the EORI. Density of dry aerosol population, ρdry, in Eq. (7) can
be calculated with Eq. (8) whereρj is density of thej-th chemical components without water uptake. Wet aerosol density,ρwet in Eq. (9), can also be calculated with Eq. (8)
ACPD
12, 15639–15674, 2012Impact of relative humidity and particles size distribution
Z. J. Lin et al.
Title Page
Abstract Introduction
Conclusions References
Tables Figures
◭ ◮
◭ ◮
Back Close
Full Screen / Esc
Printer-friendly Version Interactive Discussion
Discussion
P
a
per
|
Dis
cussion
P
a
per
|
Discussion
P
a
per
|
Discussio
n
P
a
per
|
where water was included. Additionally, wet aerosol mass concentration,mwet, can be
calculated with Eq. (9).
ρ=
X
j mj
,
X
j
mj/ρj
(8)
mwet=ρwet·
X
j πDj3
6 ·Nj (9)
5
Practically, it’s able to estimatebsp,pm0.5–2.5by the Mie Model based on the EORI, EGF
of PM2.5 and Nj,pm0.5–2.5 from APS measurement. In order to evaluate the accuracy
of this estimation, a correlation analysis was performed between temporal variations ofbsp,pm0.5–2.5from the estimation andbsp,neph(550 nm) from Nephelometer
measure-ment. By considering an evaluation with higher temporal resolution, these two data
10
sets should be compared with each other in hourly average. However, under the cir-cumstance of no available data about diurnal variation of chemical composition, the required hourly EORI, EGF andρdrywere valued to their daily averages which were
de-termined from chemical composition of daily PM2.5sample. Furthermore, hourly values
ofbsp,neph (550 nm) were corrected with an approach stated in a previous study
(An-15
derson and Ogren, 1998) where used a linear function of Angstrom exponent ˚a450/700
(˚a450/700was calculated withbsp,neph,450 nmandbsp,neph,700 nm) as correction factors for
Angular Nonidealities. It is noted that the EGF adapted in this evaluation was calcu-lated at the RH detected by Nephelometer built-in RH sensor rather than in ambient condition.
20
3.2.3 RH dependence
For convenience, it is defined thathY(RH)=Y(RH)/Y(RH0) where Y(RH) stands for a
ACPD
12, 15639–15674, 2012Impact of relative humidity and particles size distribution
Z. J. Lin et al.
Title Page
Abstract Introduction
Conclusions References
Tables Figures
◭ ◮
◭ ◮
Back Close
Full Screen / Esc
Printer-friendly Version Interactive Discussion
Discussion
P
a
per
|
Dis
cussion
P
a
per
|
Discussion
P
a
per
|
Discussio
n
P
a
per
|
is considered to be relative dry or without obvious hygroscopic growth. Hence,hY is a
factor that quantifies the extent of hygroscopic growth. In the light of a previous study (Cheng et al., 2008b), the RH dependence ofhY can be fitted by a few functions
in-cluding Eqs. (10), (11) and (12). Having something in common, these three functions are monotone and ensurehY to be unity at RH0. However, comparing the power part
5
among them, Eq. (11) and (12) can better fit an RH dependence pattern where hygro-scopic growth activates at high RH level.
hY(RH)=
1−RH
1−RH0
a
(10)
hY(RH)=
1−RH
1−RH0
a·(RH−RH0)
(11)
10
hY(RH)=
1−RH
1−RH0
a·RH
(12)
3.2.4 Size distribution
For the purpose of determining the light extinction contribution from aerosol in diff er-ent size, it’s necessary to estimate the mass concer-entration of PM0.5, PM0.5–1, PM1–2.5
15
and PM2.5–20, then, thebspandbapof them. Regarding daily average, thebsp,pm0.5–2.5,
bap,pm0.5–2.5andmpm0.5–2.5 can be estimated by the Mie Model based on the chemical
composition of PM2.5and size distribution ofNpm0.5–2.5 at ambient RH. Regardless of
the difference in chemical composition, it’s feasible to estimatebsp,pm2.5–20,bap,pm2.5–20
andmpm2.5–20 by the Mie Model on the basis of size distribution ofNpm2.5–20.
Further-20
more, bsp,pm0.5, bap,pm0.5 and mpm0.5 can be estimated by Eqs. (13), (14) and (15).
ACPD
12, 15639–15674, 2012Impact of relative humidity and particles size distribution
Z. J. Lin et al.
Title Page
Abstract Introduction
Conclusions References
Tables Figures
◭ ◮
◭ ◮
Back Close
Full Screen / Esc
Printer-friendly Version Interactive Discussion
Discussion
P
a
per
|
Dis
cussion
P
a
per
|
Discussion
P
a
per
|
Discussio
n
P
a
per
|
condition, while bsp,neph in Eq. (14) was corrected to its value at ambient RH.
Refer-enced to a previous study (Wu et al., 2009), bap,pm2.5 =8.28mec+2.23 in Eq. (15).
mpm0.5=mpm2.5−mpm0.5–2.5 (13)
5
bsp,pm0.5=bsp,neph·
bsp,pm0.5–2.5, RHAmbient
bsp,pm0.5–2.5, RHNephelometer
!
−bsp,pm0.5–2.5−bsp,pm2.5–20 (14)
bap,pm0.5=bap,pm2.5−bap,pm0.5–2.5 (15)
4 Results and discussion
4.1 Mie Model estimation and its evaluation
10
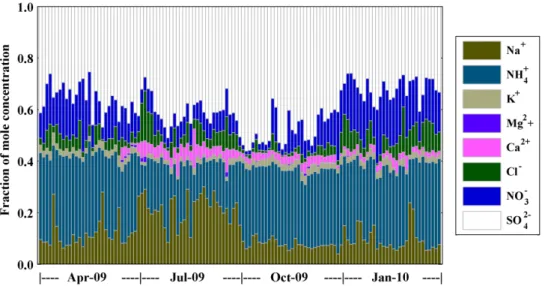
Temporal variations of mole proportion of the identified water-soluble ions in PM2.5are
illustrated in Fig. 2. On the whole, the cations were sufficient to neutralize the anions in every sample, while SO2−
4 and NH
+
4 had large amount but Mg
2+ was hardly any. In
spring, there’s hardly any Ca2+ while NH+4 and NO−
3 were high in proportion. During
summer, Na+, Ca2+ and Cl− raised their proportions while NH+
4 and K
+ lowered theirs. 15
SO2−
4 reached its maximum in autumn while NO
−
3 and Cl
−stayed in low level. NH+
4, K+,
Cl− and NO−
3 were high in proportion during winter.
Inorganic salts, POM, EC and the water content were determined based on methods discussed earlier, the temporal variations of which in mass proportion are illustrated in Fig. 3. Despite of temporal variation, (NH4)2SO4, NaNO3, POM and EC were the
20
ACPD
12, 15639–15674, 2012Impact of relative humidity and particles size distribution
Z. J. Lin et al.
Title Page
Abstract Introduction
Conclusions References
Tables Figures
◭ ◮
◭ ◮
Back Close
Full Screen / Esc
Printer-friendly Version Interactive Discussion
Discussion
P
a
per
|
Dis
cussion
P
a
per
|
Discussion
P
a
per
|
Discussio
n
P
a
per
|
Regarding other salts, Na2SO4 and NaCl raised their amount in both summer and early autumn. For the compounds of Ca2+, it was in the form of CaSO4in summer and autumn, while Ca(NO3)2in winter. It is for certain that the amount of water content was
relative low in dry days in autumn. To what extent, there was a linear relation between POM and EC, and their proportions were higher in summer and autumn than in spring
5
and winter. Limited to laboratory equipments, there were still 13 to 23 % in total mass, the Residual, where chemical composition can’t be determined
The optical parameters of chemical components for calculating the EORI were learned from some open literatures (Tang, 1996; Chazette and Louisse, 2001; Sloane, 1986; Haynes, 2011; Seinfeld and Spyros, 2006; Eichler et al., 2008) and are listed
10
in Table 2. As illustrated in Fig. 4, those inorganic salts with determined fg including
NH4NO3, NaCl, (NH4)2SO4, Na2SO4, NaNO3, KCl were plotted in the form of their RH
dependence curves. For those inorganic salts without determined fg, it’s reasonable
to neglect their hygroscopic growth as their volume concentration were small enough in this case. Moreover, the EGF of PM2.5 samples were calculated and their average
15
over a span of four months is plotted in the form of RH dependence curve in Fig. 4. Discontinuities in this curve were due to the fg considered to be unity when ambient
RH dropped to a specified salt’s crystallization point. Example is the one at 37 % RH which is the crystallization point of (NH4)2SO4. On the basis of the methods discussed
earlier, the EORI, EGF and density of dry/wet aerosol were calculated and the statistics
20
of the results are listed in Table 3.
Regarding the Mie model evaluation mentioned above, as illustrated in Fig. 5, corre-lation coefficients between thebsp,pm0.5-2.5 from the estimation andbsp,nephfrom
Neph-elometer were found to be 0.81, 0.87, 0.73 and 0.80 at 0.05 significant levels in spring, summer, autumn and winter, respectively. With this implication of a coherent temporal
25
variation between model estimation and direct measurements, it’s reliable to estimate
bsp,pm0.5–2.5with high accuracy by applying the Mie Model based on APS measurement
ACPD
12, 15639–15674, 2012Impact of relative humidity and particles size distribution
Z. J. Lin et al.
Title Page
Abstract Introduction
Conclusions References
Tables Figures
◭ ◮
◭ ◮
Back Close
Full Screen / Esc
Printer-friendly Version Interactive Discussion
Discussion
P
a
per
|
Dis
cussion
P
a
per
|
Discussion
P
a
per
|
Discussio
n
P
a
per
|
4.2 RH dependence of optical property of PM0.5–2.5
Figure 4 illustrates thatfeff increased more rapidly after ambient RH over 37 %, it’s
rea-sonable to set RH0=37 % in Eq. (10) to Eq. (12). By the Mie Model estimation, RH
dependence patterns of hbep,pm0.5–2.5 (light extinction coefficient is denoted asbep, it
is the sum of bsp and bap), hbsp,pm0.5–2.5, hbap,pm0.5–2.5 and hω0,pm0.5–2.5 (single
scat-5
tering albedo is denoted as ω0, it is the ratio of bsp to bep) were determined and
plotted in Fig. 6. It was found that Eq. (10) best fitted RH dependence patterns of
hbep,pm0.5–2.5,hbsp,pm0.5–2.5 andhω0,pm0.5–2.5. Parameter “a” and theR 2
of these curve fittings by Eq. (10) are listed in Table 4. On the contrary,hbap,pm0.5–2.5 fluctuated around
1.00 when RH increased from 37 % to 66 %, and then began to drop. It made none of
10
Eqs. (10), (11) and (12) able to fit that RH dependence pattern. Moreover, Table 4 shows hygroscopic growth enhancedbep,pm0.5–2.5averagely 1.23, 1.38 and 1.75 times
at 70 %, 80 % and 90 % RH, respectively. Regarding temporal variation of ambient RH, autumn was a relative dry season in South China while the other three were catego-rized to wet seasons. Table 5 shows thatbep,pm0.5–2.5 was enhanced by hygroscopic
15
growth averagely 1.24 to 1.28 times during wet seasons and merely 1.04 times in dry season.
4.3 Size distribution of mass concentration and light extinction coefficient
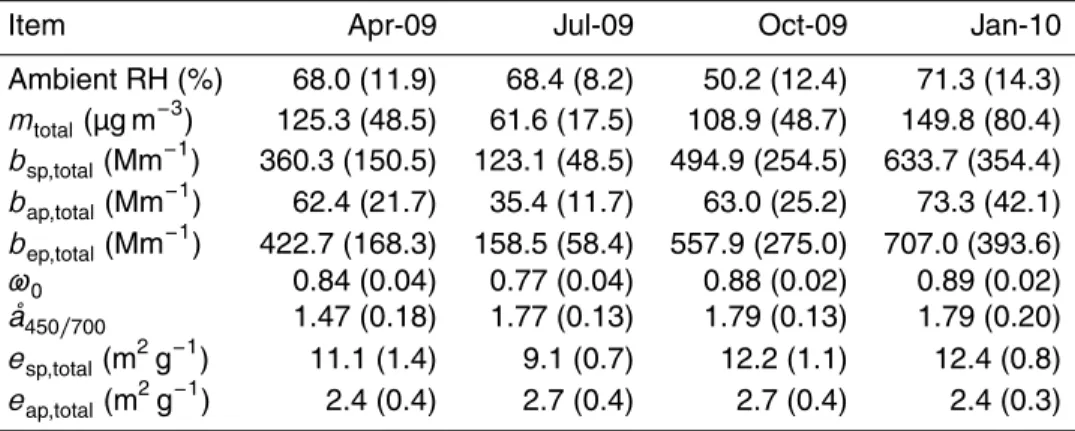
Regarding the monthly average noted in Table 6, the maximum of both mtotal and
bep,total was in winter while the minimum of them was in summer. Implied from a low
20
ω0, light absorption effect in summer was strengthened. A low ˚a450/700 indicated the
size of particles that constitute the aerosol population was larger in spring than in the other seasons. In order to recognize mass efficiency of light scattering and absorption,
esp=bspm− 1
andeap=bapm− 1
are defined. A lowesp,totaland a higheap,totalsupported
the enhanced light absorption in summer. Moreover, the sum ofesp andeap indicated
25
ACPD
12, 15639–15674, 2012Impact of relative humidity and particles size distribution
Z. J. Lin et al.
Title Page
Abstract Introduction
Conclusions References
Tables Figures
◭ ◮
◭ ◮
Back Close
Full Screen / Esc
Printer-friendly Version Interactive Discussion
Discussion
P
a
per
|
Dis
cussion
P
a
per
|
Discussion
P
a
per
|
Discussio
n
P
a
per
|
Temporal variations of size distribution ofmtotaland bep,total are illustrated in Fig. 7.
PM1contributed 58 to 79 % in total mass and 76 to 94 % in light extinction, while PM2.5 did 78 to 88 % contributions to the total mass and 94 to 98 % to light extinction. Sharing a similarity with the low ˚a450/700 in spring, PM0.5–2.5 gained much weight and carried
much contributions tobsp,totalthrough hygroscopic growth. Implied from size distribution
5
ofespandeapillustrated in Fig. 8, large particles were more efficient in light absorption
but less in light scattering than small ones.
With a less consideration of anthropogenic emissions varying much during these experiments, a lowmtotalandbep,totalin summer was probably due to a meteorological
condition in favor of a diffusion or removal of air pollutants. As the proportion of mec
10
varied relative little, an aged air mass from the sea containing more internal mixing EC explained a higher light absorption during summer. This conclusion was supported by a previous study (Cheng et al., 2006). Moreover, the high mass proportion of Na+ in summer was an evidence for that air mass from the sea. On the other hand,mtotaland
bep,totalincreased much in spring, autumn and winter. Aerosol population gained more
15
weight and its light extinction was enhanced through humidification in spring. Owing to PM0.5 having much weight and its high mass scattering efficiency,bep,totalwas even
higher whilemtotalwas a bit lower in autumn than in spring. It indicated that hygroscopic
growth had notable contributions to the rising of light extinction effect in spring, while ultra-fine particles accumulation accounted for that rising during dry days in autumn.
20
Co-effects of hygroscopic growth and particles accumulation took account for the high
bep,total andmtotalin winter.
5 Summary and conclusion
With regard to aerosol population in internal mixing status, bep,pm0.5–2.5 can be
es-timated with high accuracy by the Mie Model. The EORI and EGF required in this
25
ACPD
12, 15639–15674, 2012Impact of relative humidity and particles size distribution
Z. J. Lin et al.
Title Page
Abstract Introduction
Conclusions References
Tables Figures
◭ ◮
◭ ◮
Back Close
Full Screen / Esc
Printer-friendly Version Interactive Discussion
Discussion
P
a
per
|
Dis
cussion
P
a
per
|
Discussion
P
a
per
|
Discussio
n
P
a
per
|
enhanced up to nearly 2 times from 37 % to 92 % RH. Averagely, hygroscopic growth factor ofbep,pm0.5–2.5 was 1.24 to 1.28 during wet days and merely 1.04 in dry days.
Combined Nephelometer measurement, mass concentration of EC and the Mie Model estimation, contributions tobep from aerosol in different size can be estimated. PM1
contributed averagely 76 %, 85 %, 94 % and 93 % to bep in spring, summer, autumn
5
and winter, respectively, while the contributions from PM2.5were 94 % at least. Strong
atmospheric diffusion may be in favor of a low bep in summer. Hygroscopic growth
carried notable contribution to the rising ofbep during wet days in spring, while
ultra-fine particles accumulation was responsible for that rising during dry days in autumn. Thebep stay high in winter as the consequence to the co-effects of the high RH level
10
and fine aerosol pollution. Implied from the discussion in this paper, regional meteoro-logical condition such as surface wind field pattern may govern the pollutant regional transport which resulted in the temporal variations of aerosol chemical composition. An investigation on this will be carried out in a near study.
Acknowledgements. This work was supported by Commonwealth and Environmental
Protec-15
tion Project of the Ministry of Environmental Protection of the People’s Republic of China (200809143); China National Basic Research and Development Program (2002CB410801 and 2011CB403403) and National Natural Science Foundation (40875007).
References
Anderson, T. L. and Ogren, J. A.: Determining Aerosol Radiative Properties Using the TSI 3563
20
Integrating Nephelometer, Aerosol Sci. Tech., 29, 57–69, 1998.
Andreae, M. O., Schmid, O., Yang, H., Chand, D., Yu, J. Z., Zeng, L. M., and Zhang, Y. H.: Op-tical properties and chemical composition of the atmospheric aerosol in urban Guangzhou, China, Atmos. Environ., 42, 6335–6350, 2008.
Bergin, M., Hagler, G., Salmon, L., Zheng, M., Chameides, W., Kiang, C. S., Schauer, J., and
25
ACPD
12, 15639–15674, 2012Impact of relative humidity and particles size distribution
Z. J. Lin et al.
Title Page
Abstract Introduction
Conclusions References
Tables Figures
◭ ◮
◭ ◮
Back Close
Full Screen / Esc
Printer-friendly Version Interactive Discussion
Discussion
P
a
per
|
Dis
cussion
P
a
per
|
Discussion
P
a
per
|
Discussio
n
P
a
per
|
Bohren, C. F. and Huffman, D. R.: Absorption and scattering of light by small particles, John Wiley & Sons, Inc., 1998.
Cao, J. J., Lee, S. C.,Chow, J. C.,Watson, J. G., Ho, K. F., Zhang, R. J., Jin, Z. D., Shen, Z.X., Chen, G. C., Kang, Y.M., Zou S.C., Zhang L.Z., Qi, S. H., Dai, M.H., Cheng, Y., and Hu, K.: Spatial and seasonal distributions of carbonaceous aerosols over China, J. Geophys. Res.,
5
112, D22S11, doi:10.1029/2006JD008205, 2007.
Chazette, P. and Liousse, C.: A case study of optical and chemical ground apportionment for urban aerosols in Thessaloniki, Atmos. Environ., 35, 2497–2506, 2001.
Cheng, Y. F., Eichler, H., Wiedensohler, A., Heintzenberg, J., Zhang, Y. H., Hu, M., Herrmann, H., Zeng, L. M., Liu, S., Gnauk, T., Bruggemann, E., and He, L. Y.: Mixing state of
ele-10
mental carbon and non-light-absorbing aerosol components derived from in situ particle op-tical properties at Xinken in Pearl River Delta of China, J. Geophys. Res., 111, D20204, doi:10.1029/2005JD006929, 2006.
Cheng, Y. F., Wiedensohler, A., Eichler, H., Su, H., Gnauk, T., Br ¨uggemann, E., Herrmann, H., Heintzenberg, J., Slanina, J., Tuch, T., Hu, M., and Zhang, Y. H.: Aerosol optical properties
15
and related chemical apportionment at Xinken in Pearl River Delta of China, Atmos. Environ., 42, 6351–6372, 2008a.
Cheng, Y. F., Wiedensohler, A., Eichler, H., Heintzenberg, J., Tesche, M., Ansmann, A., Wendisch, M., Su, H., Althausen, D., Herrmann, H., Gnauk, T., Bruggemann, E., Hu, M., and Zhang, Y. H.: Relative humidity dependence of aerosol optical properties and direct radiative
20
forcing in the surface boundary layer at Xinken in Pearl River Delta of China: An observation based numerical study, Atmos. Environ., 42, 6373–6397, 2008b.
Cheng, Y. F., Zhang, Y. H., Hu, M., and Wiedensohler, A.: An observation-based method for investigating the atmospheric aerosol radiative properties in pearl river delta of China, http: //www.sciencep.com, China, 2008c.
25
Chow, J. C., Watson, J. G., Chen, L. W., Chang, M. C., Robinson, N. F., Trimble, D., and Kohl, S.: The IMPROVE A temperature protocol for thermal/optical carbon analysis: maintaining consistency with a long-term database, J. Air Waste Manage., 57, 1014–1023, 2007. Deng, X. J., Tie, X. X., Zhou, X. J., Wu, D., Zhong, L. J., Tan, H. B., Li, F., Huang, X. Y.,
Bi, X. Y., and Deng, T.: Effects of Southeast Asia biomass burning on aerosols and ozone
30
ACPD
12, 15639–15674, 2012Impact of relative humidity and particles size distribution
Z. J. Lin et al.
Title Page
Abstract Introduction
Conclusions References
Tables Figures
◭ ◮
◭ ◮
Back Close
Full Screen / Esc
Printer-friendly Version Interactive Discussion
Discussion
P
a
per
|
Dis
cussion
P
a
per
|
Discussion
P
a
per
|
Discussio
n
P
a
per
|
Deng, X. J., Tie, X. X., Wu, D., Zhou, X. J., Bi, X. Y., Tan, H. B., Li, F., and Jiang, C. L.: Long-term trend of visibility and its characterizations in the Pearl River Delta (PRD) region, China, Atmos. Environ., 42, 1424–1435, 2008b.
Eichler, H., Cheng, Y. F., Birmili, W., Nowak, A., Wiedensohler, A., Br ¨uggemann, E., Guauk, T., Herrmann, H., Althausen, D., Ansmann, A., Engelmann, R., Tesche, M., Wendisch, M.,
5
Zhang, Y. H., Hu, M., Liu, S., and Zeng, L. M.: Hygroscopic properties and extinction of aerosol particles at ambient relative humidity in South-Eastern China, Atmos. Environ., 42, 6321–6334, 2008.
Fan, S. J., Wang, B. M., Teshce, M., Engelmann, R., Althausen, A., Liu, J., Zhu, W., Fan, Q., Li, M. H., Ta, N., Song, L. L., and Leong, K. L.: Meteorological conditions and structures of
10
atmospheric boundary layer in October 2004 over Pearl River Delta area, Atmos. Environ., 42, 6174–6186, 2008.
Fan, S. J., Fan, Q., Yu, W., Luo, X. Y., Wang, B. M., Song, L. L., and Leong, K. L.: Atmospheric boundary layer characteristics over the Pearl River Delta, China, during the summer of 2006: measurement and model results, Atmos. Chem. Phys., 11, 6297–6310,
doi:10.5194/acp-11-15
6297-2011, 2011.
Guauk, T., Muller, K., Pinxteren, D., He, L. Y., Niu, Y., Hu, M., and Herrmann, H.: Size-segregated particulate chemical composition in XinKen, Pearl River Delta, China: OC/EC and organic compounds, Atmos. Environ., 42, 6296–6309, 2008.
Han, Y. M., Shen, Z. X., Cao, J. J., Li, X. X., Zhao, J. L., Liu, P. P., Wang, Y. H., and Zhou,
20
J.: Seasonal variations of water-soluble inorganic ions in atmospheric particles over Xi’an, Environ. Chem., 28, 261–266, 2009.
Hand, J. L. and Malm, W. C.: Review of the IMPROVE equation for estimating ambient light extinction coefficients. Cooperative Institute for Research in the Atmosphere, Colorado State University, ISSN 0737-5352-71, 2006.
25
Haynes, W. M. (Ed.): CRC Handbook of Chemistry and Physics 92nd Edition, CRC Press, 2011.
Kelly, J. T. and Wexler, A. S.: Water uptake by aerosol: Water activity in supersaturated potas-sium solutions and deliquescence as a function of temperature, Atmos. Environ., 40, 4450– 4468, 2006.
30
ACPD
12, 15639–15674, 2012Impact of relative humidity and particles size distribution
Z. J. Lin et al.
Title Page
Abstract Introduction
Conclusions References
Tables Figures
◭ ◮
◭ ◮
Back Close
Full Screen / Esc
Printer-friendly Version Interactive Discussion
Discussion
P
a
per
|
Dis
cussion
P
a
per
|
Discussion
P
a
per
|
Discussio
n
P
a
per
|
Liu, S., Hu, M., Slanina, S., He, L. Y., Niu, Y. W., Bruegemann, E., Gnauk, T., and Herrmann, H.: Size distribution and source analysis of ionic compositions of aerosols in polluted periods at Xinken in Pearl River Delta (PRD) of China, Atmos. Environ., 42, 6284–6295, 2008a. Liu, X. G., Cheng, Y. F., Zhang, Y. H., Jung, J., Sugimoto, N., Chang, S. Y., Kim, Y. J., Fan,
S. J., and Zeng, L. M.: Influences of relative humidity and particle chemical composition on
5
aerosol scattering properties during the 2006 PRD campaign, Atmos. Environ., 42, 1525– 1536, 2008b.
Liu, X. G., Zhang, Y. H., Wen, M. T., Wang, J. L., Jung, J. S., Chang, S. Y., Hu, M., Zeng, L. M., and Kim, Y. J.: A Closure Study of Aerosol Hygroscopic Growth Factor during the PRD 2006 Campaign, Adv. Atmos. Sci., 27, 947–956, doi:10.1007/s00376-009-9150-z, 2010.
10
Jung, J. S., Lee, H., Kim, Y. J., Liu, X. G., Zhang, Y. H., Gu, J. W., and Fan, S. J.: Aerosol chemistry and the effect of aerosol water content on visibility impairment and radiative forcing in Guangzhou during the 2006 Pearl River Delta campaign, J. Environ. Manage., 90, 3231– 3244, 2009.
Louie, P. K. K., Waston, J. G., and Chow, J. C.: Seasonal characteristics and regional transport
15
of PM2.5in Hong Kong, Atmos. Environ., 39, 1695–1710, 2005.
Seinfeld, J. H. and Spyros, N. P.: Atmospheric Chemistry and Physics: from air pollution to climate change (Second Edition), John Wiley & Sons Inc., New York, 2006.
Shen, Z. X., Arimoto, R., Cao, J. J., Zhang, R. J., Li, X. X., Du, N., Tomoaki, O., Shunsuke, N., and Shigeru, T.: Seasonal variations and evidence for the effectiveness of pollution controls
20
on water-soluble inorganic species in total suspended particulates and fine particulate matter from Xi’an, China, J. Air Waste Manage., 58, 1560–1570, 2008.
Sloane, C. S.: Effect of composition on aerosol light scattering efficiencies, Atmos. Environ., 20, 1025–1037, 1986.
Stokes, R. H. and Robinson, R. A.: Interactions in aqueous nonelectrolyte solutions. I.
Solute-25
solvent equilibria, J. Phys. Chem., 70, 2126–2131, 1966.
Su, H., Cheng, Y. F., Cheng, P., Zhang, Y. H., Dong, S. F., Zeng , L. M., Wang, X. S., Slanina, J., Shao, M., and Wiedensohler, A.: Observation of nighttime nitrous acid (HONO) formation at a non-urban site during PRIDE-PRD2004 in China, Atmos. Environ., 42, 6219–6232, 2008. Tang, I. N.: Chemical and size effects of hygroscopic aerosols on light scattering coefficients, J.
30
ACPD
12, 15639–15674, 2012Impact of relative humidity and particles size distribution
Z. J. Lin et al.
Title Page
Abstract Introduction
Conclusions References
Tables Figures
◭ ◮
◭ ◮
Back Close
Full Screen / Esc
Printer-friendly Version Interactive Discussion
Discussion
P
a
per
|
Dis
cussion
P
a
per
|
Discussion
P
a
per
|
Discussio
n
P
a
per
|
Tang, I. N. and Munkelwitz, H. R.: Water activities, densities, and refractive indices of aque-ous sulfates and sodium nitrate droplets of atmospheric importance, J. Geophys. Res., 99, 18801–18808, 1994.
Tang, I. N., Tridico, A. C., and Fung, K. H.: Thermodynamic and optical properties of sea salt aerosols, J. Geophys. Res., 102, 23269–23275, 1997.
5
Tao, J., Ho, K. F., Chen, L. G., Zhu, L. H., Han, J. L., and Xu, Z. C.: Effect of chemical composi-tion of PM2.5on visibility in Guangzhou, China, 2007 spring, Particuology, 7, 68–75, 2009. Tao, J., Zhang, R. J., Dong, L., Zhang, T., Zhu, L. H., Han, J. L., Xu, Z. C.: Characterization of
Water-soluble Inorganic ions in PM2.5and PM10in Summer in Guangzhou, Environ. Sci., 31, 1417–1424, 2010.
10
Tao, J., Cao, J. J., Zhang, R. J., Zhu L. H., Zhang, T., Shi, S., and Chan, C. Y.: Recon-structed light extinction coefficients using chemical compositions of PM2.5in winter in Urban Guangzhou, China, Adv. Atmos. Sci., 29, 359–368, 2012.
Tie, X. X. and Cao, J. J.: Aerosol pollution in China: Present and future impact on environment, Particuology, 7, 426–431, 2009.
15
Wang, T., Poon, C. N., Kwok, Y. H., and Li, Y. S.: Characterizing the temporal variability and emission patterns of pollution plumes in the Pearl River Delta of China, Atmos. Environ., 37, 3539–3550, 2003.
Wu, D., Tie, X. X., Li, C. C., Ying, Z. M., Lau, A., Huang, J., Deng, X. J., and Bi, X. Y.: An extremely low visibility event over the Guangzhou region: a case study, Atmos. Environ., 39,
20
6568–6577, 2005.
Wu, D., Mao, J. T., Deng, X. J., Tie, X. X., Zhang, Y. H., Zeng, L. M., Li, F., Tan, H. B., Bi, X. Y., Huang, X. Y., Cheng, J., and Deng, T.: Black carbon aerosols and their radiative properties in the Pearl River Delta region, Sci. China Ser. D, 52, 1152–1163, 2009.
Xiao, R., Takegawa, N., Zheng, M., Kondo, Y., Miyazaki, Y., Miyakawa, T., Hu, M., Shao, M.,
25
Zeng, L., Gong, Y., Lu, K., Deng, Z., Zhao, Y., and Zhang, Y. H.: Characterization and source apportionment of submicron aerosol with aerosol mass spectrometer during the PRIDE-PRD 2006 campaign, Atmos. Chem. Phys., 11, 6911–6929, doi:10.5194/acp-11-6911-2011, 2011.
Yu, H., Wu, C., Wu, D., and Yu, J. Z.: Size distributions of elemental carbon and its contribution
30
ACPD
12, 15639–15674, 2012Impact of relative humidity and particles size distribution
Z. J. Lin et al.
Title Page
Abstract Introduction
Conclusions References
Tables Figures
◭ ◮
◭ ◮
Back Close
Full Screen / Esc
Printer-friendly Version Interactive Discussion
Discussion
P
a
per
|
Dis
cussion
P
a
per
|
Discussion
P
a
per
|
Discussio
n
P
a
per
|
Yue, D. L., Hu, M., Wu, Z. J., Guo, S., Wen, M. T., Nowak, A., Wehner, B., Wiedensohler, A., Takegawa, N., Kondo, Y., Wang, X. S., Li, Y. P., Zeng, L. M., and Zhang, Y. H.: Variation of particle number size distributions and chemical compositions at the urban and downwind regional sites in the Pearl River Delta during summertime pollution episodes, Atmos. Chem. Phys., 10, 9431–9439, doi:10.5194/acp-10-9431-2010, 2010.
5
Yue, M. Z., Wang, Y. Z., Bian, S. F., Tian, S. L., and Lu, C.: Corrosion in the process of mixedly burning biomass with coal and preventive measures thereof, Thermal Power Generation, 40, 35–38, 2011.
Zhang, Y. H., Hu, M., Zhong, L. J., Wiedensohler, A., Liu, S.C., Andreas, M.O., Wang, W., and Fan, S. J.: Regional integrated experiments on air quality over Pearl River Delta 2004
10
(PRIDE-PRD2004): overview, Atmos. Environ., 42, 6157–6173, 2008a.
Zhang, Y. H., Su, H., Zhong, L. J., Cheng, Y. F., Zeng, L. M., Wang, X. S., Xiang, Y. R., Wang, J. L., Gao, D. F., Shao, M., Fan, S. J., and Liu, S. C.: Regional ozone pollution and observation-based approach for analyzing ozone-precursor relationship during the PRIDE-PRD 2004 campaign, Atmos. Environ., 42, 6203–6218, 2008b.
ACPD
12, 15639–15674, 2012Impact of relative humidity and particles size distribution
Z. J. Lin et al.
Title Page
Abstract Introduction
Conclusions References
Tables Figures
◭ ◮
◭ ◮
Back Close
Full Screen / Esc
Printer-friendly Version Interactive Discussion
Discussion
P
a
per
|
Dis
cussion
P
a
per
|
Discussion
P
a
per
|
Discussio
n
P
a
per
|
Table 1.Measured aerosol properties and meteorological parameters.
Available data
Relative Time in days
Property Instrument humidity resolution Apr Jul Oct Jan
-09 -09 -09 -10
1 PM2.5mass concentration BGI Corporation, Model PQ200 40 % 23.5 h 30 31 31 31 2 OC/EC mass concentration Atmoslytic Inc., Calabasas, CA, DIR 40 % 23.5 h 30 31 31 31
model 2001 carbon analyzer
3 Water-soluble ions mass Dionex Corp, Sunnyvale, CA, Model 40 % 23.5 h 30 31 31 31
concentration Dionex 600
4 Total light scattering coefficient TSI Performance Measurement 17–73 %∗ 1 min 29 31 31 31
(450 nm, 550 nm, 700 nm) Tools, Model 3563
5 Particles number concentration TSI Aerodynamic Sizer, Model 3321 <20% 5 min 30 30 29 30 in the range of 0.5–20 µm
6 Relative humidity VASALA Model QMH102 29–88 % 30 min 30 31 31 31
ACPD
12, 15639–15674, 2012Impact of relative humidity and particles size distribution
Z. J. Lin et al.
Title Page
Abstract Introduction
Conclusions References
Tables Figures
◭ ◮
◭ ◮
Back Close
Full Screen / Esc
Printer-friendly Version Interactive Discussion
Discussion
P
a
per
|
Dis
cussion
P
a
per
|
Discussion
P
a
per
|
Discussio
n
P
a
per
|
Table 2.Optical parameters of chemical components for calculating the EORI.
component ρ n k component ρ n k
(NH4)2SO4 1.760 1.530 0.000 NH4Cl 1.527 1.639 0.000
Na2SO4 2.680 1.480 0.000 NaCl 2.160 1.544 0.000
K2SO4 2.660 1.490 0.000 KCl 1.980 1.490 0.000
MgSO4 2.660 1.560 0.000 MgCl2 2.325 1.540 0.000
CaSO4 2.610 1.570 0.000 CaCl2 2.150 1.520 0.000
NH4NO3 1.725 1.554 0.000 POM 1.500 1.550 0.005
NaNO3 2.261 1.587 0.000 EC 1.500 1.950 0.660
KNO3 2.110 1.504 0.000 Water 1.000 1.333 0.000
ACPD
12, 15639–15674, 2012Impact of relative humidity and particles size distribution
Z. J. Lin et al.
Title Page
Abstract Introduction
Conclusions References
Tables Figures
◭ ◮
◭ ◮
Back Close
Full Screen / Esc
Printer-friendly Version Interactive Discussion
Discussion
P
a
per
|
Dis
cussion
P
a
per
|
Discussion
P
a
per
|
Discussio
n
P
a
per
|
Table 3.Monthly average of the parameters required in the Mie Model.
Item Apr-09 Jul-09 Oct-09 Jan-10
Ambient RH (%) 68.0 (11.9) 68.4 (8.2) 50.2 (12.4) 71.3 (14.3)
neff 1.483 (0.035) 1.495 (0.028) 1.538 (0.029) 1.490 (0.037)
keff 0.042 (0.011) 0.049 (0.013) 0.054 (0.012) 0.040 (0.010)
feff 1.222 (0.097) 1.196 (0.075) 1.093 (0.054) 1.212 (0.092)
ρdry(g cm−3) 1.799 (0.052) 1.861 (0.056) 1.833 (0.034) 1.851 (0.037)
ρwet(g cm− 3
) 1.455 (0.118) 1.515 (0.096) 1.646 (0.089) 1.493 (0.118)
ACPD
12, 15639–15674, 2012Impact of relative humidity and particles size distribution
Z. J. Lin et al.
Title Page
Abstract Introduction
Conclusions References
Tables Figures
◭ ◮
◭ ◮
Back Close
Full Screen / Esc
Printer-friendly Version Interactive Discussion
Discussion
P
a
per
|
Dis
cussion
P
a
per
|
Discussion
P
a
per
|
Discussio
n
P
a
per
|
Table 4.Parameter “a” and theR2of the curve fittings by Eq. (10).
Item a R2 RH=70 % RH=80 % RH=90 %
hbep,pm0.5–2.5 −0.2964 0.9920 1.233 (0.050) 1.378 (0.075) 1.746 (0.147)
hbsp,pm0.5–2.5 −0.3778 0.9953 1.315 (0.069) 1.514 (0.098) 2.020 (0.184)
hbap,pm0.5–2.5 – – 0.995 (0.029) 0.986 (0.040) 0.951 (0.066)
hω0,pm0.5–2.5 −0.0811 0.9948 1.066 (0.017) 1.098 (0.022) 1.157 (0.032)
ACPD
12, 15639–15674, 2012Impact of relative humidity and particles size distribution
Z. J. Lin et al.
Title Page
Abstract Introduction
Conclusions References
Tables Figures
◭ ◮
◭ ◮
Back Close
Full Screen / Esc
Printer-friendly Version Interactive Discussion
Discussion
P
a
per
|
Dis
cussion
P
a
per
|
Discussion
P
a
per
|
Discussio
n
P
a
per
|
Table 5.Monthly average ofhbep,pm0.5–2.5,hbsp,pm0.5–2.5,hbap,pm0.5–2.5 andhω0,pm0.5–2.5.
Item Apr-09 Jul-09 Oct-09 Jan-10
Ambient RH (%) 68.0 (11.9) 68.4 (8.2) 50.2 (12.4) 71.3 (14.3)
hbep,pm0.5–2.5 1.265 (0.192) 1.236 (0.128) 1.041 (0.091) 1.275 (0.171) hbsp,pm0.5–2.5 1.354 (0.258) 1.343 (0.188) 1.056 (0.118) 1.369 (0.229)
hbap,pm0.5–2.5 1.004 (0.029) 0.985 (0.035) 0.995 (0.010) 0.993 (0.020)
hω0,pm0.5–2.5 1.064 (0.040) 1.083 (0.041) 1.012 (0.026) 1.069 (0.040)
ACPD
12, 15639–15674, 2012Impact of relative humidity and particles size distribution
Z. J. Lin et al.
Title Page
Abstract Introduction
Conclusions References
Tables Figures
◭ ◮
◭ ◮
Back Close
Full Screen / Esc
Printer-friendly Version Interactive Discussion
Discussion
P
a
per
|
Dis
cussion
P
a
per
|
Discussion
P
a
per
|
Discussio
n
P
a
per
|
Table 6.Results of the Mie Model estimation and the relevant calculations.
Item Apr-09 Jul-09 Oct-09 Jan-10
Ambient RH (%) 68.0 (11.9) 68.4 (8.2) 50.2 (12.4) 71.3 (14.3)
mtotal(µg m− 3
) 125.3 (48.5) 61.6 (17.5) 108.9 (48.7) 149.8 (80.4)
bsp,total(Mm−1) 360.3 (150.5) 123.1 (48.5) 494.9 (254.5) 633.7 (354.4)
bap,total(Mm− 1
) 62.4 (21.7) 35.4 (11.7) 63.0 (25.2) 73.3 (42.1)
bep,total(Mm−1) 422.7 (168.3) 158.5 (58.4) 557.9 (275.0) 707.0 (393.6)
ω0 0.84 (0.04) 0.77 (0.04) 0.88 (0.02) 0.89 (0.02)
˚a450/700 1.47 (0.18) 1.77 (0.13) 1.79 (0.13) 1.79 (0.20)
esp,total (m 2
g−1) 11.1 (1.4) 9.1 (0.7) 12.2 (1.1) 12.4 (0.8)
eap,total(m2g−1) 2.4 (0.4) 2.7 (0.4) 2.7 (0.4) 2.4 (0.3)
ACPD
12, 15639–15674, 2012Impact of relative humidity and particles size distribution
Z. J. Lin et al.
Title Page
Abstract Introduction
Conclusions References
Tables Figures
◭ ◮
◭ ◮
Back Close
Full Screen / Esc
Printer-friendly Version Interactive Discussion
Discussion
P
a
per
|
Dis
cussion
P
a
per
|
Discussion
P
a
per
|
Discussio
n
P
a
per
|
Available data
Apr Jul
1 31
2 , DIR 31
3 odel 31
4 nt 31
5
20μm 30
Fig. 1.Satellite photo of the monitoring site and surroundings (from Google Earth).
ACPD
12, 15639–15674, 2012Impact of relative humidity and particles size distribution
Z. J. Lin et al.
Title Page
Abstract Introduction
Conclusions References
Tables Figures
◭ ◮
◭ ◮
Back Close
Full Screen / Esc
Printer-friendly Version Interactive Discussion
Discussion
P
a
per
|
Dis
cussion
P
a
per
|
Discussion
P
a
per
|
Discussio
n
P
a
per
|
, it’s
Fig. 2.Temporal variation of the identified water-soluble ions in mole proportion.
ACPD
12, 15639–15674, 2012Impact of relative humidity and particles size distribution
Z. J. Lin et al.
Title Page
Abstract Introduction
Conclusions References
Tables Figures
◭ ◮
◭ ◮
Back Close
Full Screen / Esc
Printer-friendly Version Interactive Discussion
Discussion
P
a
per
|
Dis
cussion
P
a
per
|
Discussion
P
a
per
|
Discussio
n
P
a
per
|
, it’s Fig. 3.Temporal variation of the chemical components in mass proportion. Note: OIC mean the other determined inorganic salts.
ACPD
12, 15639–15674, 2012Impact of relative humidity and particles size distribution
Z. J. Lin et al.
Title Page
Abstract Introduction
Conclusions References
Tables Figures
◭ ◮
◭ ◮
Back Close
Full Screen / Esc
Printer-friendly Version Interactive Discussion
Discussion
P
a
per
|
Dis
cussion
P
a
per
|
Discussion
P
a
per
|
Discussio
n
P
a
per
|
’
ρ ρ
1.9) (8.2) 2.4) 4.3)
0.035) 0.028) 0.029) 0.037)
1) 0.013) 0.012) 0.010)
0.097) 0.075) 0.054) 0.092)
ρ 0.052) 0.056) 0.034) 0.037)
ρ
Fig. 4.RH dependence curve of some inorganic salts and the EGF. Note: the bars in the right figure stand for the standard deviation offeffat specified RH.