www.biogeosciences.net/11/2027/2014/ doi:10.5194/bg-11-2027-2014
© Author(s) 2014. CC Attribution 3.0 License.
Biogeosciences
Implications of incorporating N cycling and N limitations on
primary production in an individual-based dynamic vegetation
model
B. Smith1, D. Wårlind1, A. Arneth2, T. Hickler3,4, P. Leadley5, J. Siltberg1, and S. Zaehle6
1Department of Physical Geography and Ecosystem Science, Lund University, 22362 Lund, Sweden
2Karlsruhe Institute of Technology, Institute of Meteorology and Climate Research/Atmospheric Environmental Research, 82467 Garmisch-Partenkirchen, Germany
3Biodiversity and Climate Research Centre (BiK-F), Senckenberg Gesellschaft für Naturforschung, Senckenberganlage 25, 60325 Frankfurt am Main, Germany
4Institute of Physical Geography, Goethe University, Altenhöferallee 1, 60438 Frankfurt am Main, Germany
5Ecology, Systematics and Evolution Laboratory, Université Paris-Sud XI, Bâtiment 362, 91405 ORSAY Cedex, France 6Max-Planck Institute for Biogeochemistry, P.O. Box 600164, 07701 Jena, Germany
Correspondence to:B. Smith ([email protected])
Received: 16 September 2013 – Published in Biogeosciences Discuss.: 28 November 2013 Revised: 25 February 2014 – Accepted: 26 February 2014 – Published: 10 April 2014
Abstract. The LPJ-GUESS dynamic vegetation model
uniquely combines an individual- and patch-based represen-tation of vegerepresen-tation dynamics with ecosystem biogeochem-ical cycling from regional to global scales. We present an updated version that includes plant and soil N dynamics, analysing the implications of accounting for C–N interac-tions on predicinterac-tions and performance of the model. Stand structural dynamics and allometric scaling of tree growth suggested by global databases of forest stand structure and development were well reproduced by the model in compar-ison to an earlier multi-model study. Accounting for N cy-cle dynamics improved the goodness of fit for broadleaved forests. N limitation associated with low N-mineralisation rates reduces productivity of cold-climate and dry-climate ecosystems relative to mesic temperate and tropical ecosys-tems. In a model experiment emulating free-air CO2 enrich-ment (FACE) treatenrich-ment for forests globally, N limitation as-sociated with low N-mineralisation rates of colder soils re-duces CO2enhancement of net primary production (NPP) for boreal forests, while some temperate and tropical forests ex-hibit increased NPP enhancement. Under a business-as-usual future climate and emissions scenario, ecosystem C storage globally was projected to increase by ca. 10 %; additional N requirements to match this increasing ecosystem C were
within the high N supply limit estimated on stoichiometric grounds in an earlier study. Our results highlight the impor-tance of accounting for C–N interactions in studies of global terrestrial N cycling, and as a basis for understanding mech-anisms on local scales and in different regional contexts.
1 Introduction
2001; Joos et al., 2001; Friedlingstein et al., 2006; Schaphoff et al., 2006; Scholze et al., 2006; O’ishi et al., 2009; Arora et al., 2013; Ahlström et al., 2013).
One important source of this uncertainty may be the fail-ure of many carbon cycle models to account for the con-straint imposed on the production of new biomass by the plant-available pool of nitrogen (N) and its replenishment under rising [CO2] (Luo et al., 2004) and climate warm-ing (Medlyn et al., 2000). Nitrogen limits plant production in many of the world’s biomes (Field, 1992), and enhanced growth in response to increasing atmospheric CO2or climate amelioration would require a corresponding net increase in the processes – deposition, fixation or mineralisation – gov-erning N supply (decreased N demand or enhanced uptake of N by plants could also contribute to enabling increased growth; Finzi et al., 2007). Based on stoichiometric assump-tions, Hungate et al. (2003) estimated upper and lower limits for possible future N supply and compared these with the in-creased demand suggested by the biomass and soil C changes projected by a suite of DVMs in the Cramer et al. (2001) study, concluding that most of the models vastly overesti-mated the potential increase in ecosystem carbon storage, especially the “fertilisation” effect of increased atmospheric CO2. In response to such criticism, ecosystem cycling of N and N constraints on plant production have been imple-mented in newer versions of some DVMs (Thornton et al., 2007; Sokolov et al., 2008; Xu-Ri and Prentice, 2008; Zaehle and Friend, 2010; Goll et al., 2012). Compared with C-only versions of the same models, the incorporation of N limi-tations generally results in lower estimates of primary pro-duction, particularly in temperature-limited ecosystems, and reduced carbon sequestration globally under future climate and [CO2] projections (Thornton et al., 2007; Sokolov et al., 2008; Churkina et al., 2009; Zaehle et al., 2010; Goll et al., 2012; see Zaehle and Dalmonech, 2011 for a review on this issue).
Others have pointed to the highly generalised representa-tion of funcrepresenta-tional diversity and spatial heterogeneity of veg-etation in many current DVMs as a hindrance to their abil-ity to accurately scale between the short-term physiological responses of individual plants to changing climate and re-sources, and long-term, large-scale shifts in vegetation com-position and structure that underlie changes in global carbon balance (Moorcroft, 2003; 2006; Purves and Pacala 2008; Fisher et al., 2010a). Most models do not keep track of size structure (demographics) of the vegetation stands they sim-ulate and consequently fail to distinguish the contrasting re-source and stress environments faced by canopy and ground-layer vegetation, which critically affect individual and pop-ulation growth, succession and functional composition in closed vegetation such as forests (Purves and Pacala, 2008) and other vegetation types having a woody element, such as shrublands and savannahs. Comparing a number of DVMs widely used in carbon cycle studies to allometric data from forests around the world, Wolf et al. (2011) showed wide
dis-crepancies between simulated and observed stand structure, even for sites where carbon fluxes were simulated accurately, concluding that this must inhibit the models from accurately simulating long-term changes in carbon sources and sinks.
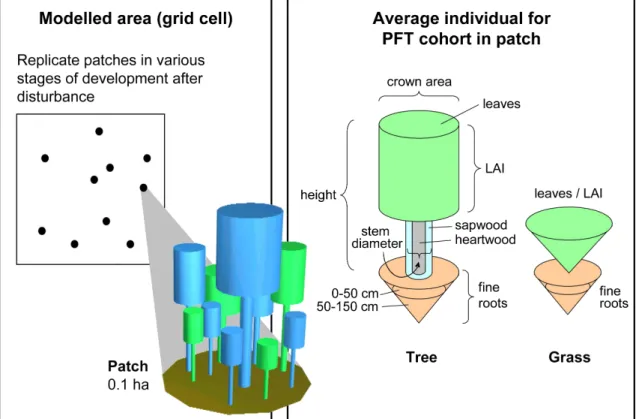
In this paper, we present a new version of the LPJ-GUESS ecosystem model (Smith et al., 2001) that uniquely combines an individual- and patch-based representation of vegetation dynamics with plant and soil N dynamics and associated con-straints on plant production and ecosystem carbon balance. We analyse the behaviour and performance of the model with respect to the main aspects of ecosystem dynamics it is de-signed to simulate, i.e. vegetation dynamics/biogeography, ecosystem productivity, and C and N biogeochemistry. We also revisit a number of questions previously addressed us-ing C-only DVMs and perform new analysis to explore the implications of accounting for N cycling and its feedbacks to whole-system dynamics. These concern the enhancement of ecosystem production under elevated CO2 and its variation among forest ecosystems globally; CO2and climate-driven future changes in biospheric carbon storage and the addi-tional N supply needed to support it; and allometric scaling relationships as benchmarks of a model’s ability to repro-duce coupled changes in ecosystem structure and function in a consistent manner. We ask whether the conclusions drawn based on analysis with the C-only version of LPJ-GUESS re-main robust or change when C–N interactions are taken into account by the model.
2 Methods
2.1 Ecosystem model
characteristics of each PFT (Hickler et al., 2004; Wramneby et al., 2008).
An overview of LPJ-GUESS is provided in Appendix B. The version of LPJ-GUESS used in the present study incor-porates N cycling in vegetation and soil, and N limitations on plant production. It is further developed from the C-only standard version of the model, version 2.1, which is fully de-scribed in Ahlström et al. (2012) and references therein. An overview of the N-cycling scheme follows; further details are provided in Appendix C.
A pool of mineral N – available to plants, via root uptake, and to soil microbes – is provided by atmospheric deposi-tion, biological N fixation and gross N mineralisation of soil organic matter (SOM). Annual N deposition was prescribed externally to the model (see below). Biological N fixation is estimated as a dynamic function of evapotranspiration (sim-ulated by the model), following a parameterisation proposed by Cleveland et al. (1999) that builds on an empirical correla-tion between N fixacorrela-tion and evapotranspiracorrela-tion at the global scale.
C and N dynamics of soils are simulated conjointly by an SOM scheme adopted from the CENTURY model (Parton et al., 1993), with modifications by Comins and McMurtrie (1993) and Kirschbaum and Paul (2002), and recent updates by Parton et al. (2010). Decomposition of 11 SOM compart-ments differing in C : N stoichiometry and resistance to de-cay results in respiration (release of CO2)and transfer of C
and N between pools, satisfying mass balance. Carbon en-tering the receiver pool drives N mineralisation or immobili-sation. Gross N mineralisation is effected as an increase in the soil mineral N pool when N transferred from a donor pool exceeds the corresponding increase dictated by the C : N ratio of a receiver pool (N “supply” exceeds “demand”); in the opposite case (N demand exceeds supply), N immobil-isation occurs, reducing mineral N. Net N mineralimmobil-isation, describing the net release of N from decaying organic mat-ter, is the balance between these two terms. Decay rates are sensitive to soil temperature and moisture, and C : N ratios for certain SOM compartments change within limits depend-ing on available N, emulatdepend-ing dominance shifts between de-composer functional groups as soil nutrient status changes (Rousk and Bååth, 2007).
Plant N uptake, computed on a daily time step, is the smaller component of the supply provided by the soil min-eral N pool, and that part of daily N demand for allocation to the leaf photosynthetic apparatus and to biomass growth that cannot be satisfied by retranslocation from storage and from leaves, fine roots and sapwood undergoing phenological turnover. N demand is driven by optimal leaf N content, com-puted following Haxeltine and Prentice (1996a) as a linear function of the carboxylation capacity estimated to maximise the net photosynthesis of the plant canopy given current plant size, phenology, architecture and microenvironment. N de-mand for allocation to growth in other tissues follow leaf N, conserving relative differences between leaves, fine roots and
sapwood in N concentration of new growth (Friend et al., 1997; White et al., 2000; Zaehle and Friend 2010). Plants retain half of the N content of shed roots and leaves and sapwood on conversion to heartwood for retranslocation to remaining tissues. The assumption of a 50 % resorption effi-ciency for N is consistent with reviews by Aerts (1996) and Vergutz et al. (2012). Excess nitrogen is retained in the nitro-gen store, which serves to buffer the effects of seasonal and to some extent interannual variations in the balance between N demand and supply.
N limitation occurs if the N demand of vegetation in a patch, net of retranslocation, cannot be met by the supply of mineral N in the soil. Under N limitation, plant individ-uals take up soil N in proportion to their fine root surface area, and photosynthesis and allocation for the current year are reduced. N limitation may result in an increased relative allocation to fine roots, promoting more efficient N uptake the following year.
To diagnose and illustrate the consequences of incorpo-rating an active N cycle in LPJ-GUESS, for a number of the model experiments described in the next section, paral-lel simulations were performed with N constraints on pri-mary production enabled and disabled. These are denoted C–N and C-only, respectively, throughout the paper. All sim-ulations were performed with the enhanced version of the model, including the CENTURY-based SOM scheme, and other modifications, as described above and in Appendix C. N constraints were disabled in the C-only simulations by arti-ficially satisfying plant demand for N, calculated on the basis of optimal carboxylation capacity, irrespective of the avail-able supply of mineral N in the soil; see Appendix C for fur-ther details.
With the exception of the simulation used to produce the N-limitation map (further detailed below), C-only simula-tions were performed with a different value of a global pa-rameter, αa, that linearly scales the quantum efficiency of photosynthesis, equally for all vegetation and at all points in time and space (see Appendix B for a further explana-tion of this parameter). The parameter was calibrated to at-tain comparable overall levels of the main ecosystem stocks and fluxes of carbon at global scale under 1961–1990 forc-ing, with and without N constraints enabled.
2.2 Model experiments
2.2.1 Global hindcast experiment
with and without N constraints enabled. Climate forcing (mean monthly temperature, precipitation and cloud fraction) was provided by the Climate Research Unit (CRU) TS 3.0 observed climate data set (Mitchell and Jones, 2005). At-mospheric CO2 concentrations, varying annually, were pre-scribed from observations (McGuire et al., 2001). The sim-ulation was initialised with a 500-year “spin-up” to build up vegetation and soil C and N pools in an approximate steady state with early-20th-century climate. CRU climate data for 1901–1930, cycled repeatedly and with any interannual tem-perature trend removed, were used to force the model during the spin-up. A CO2concentration of 296 ppmv (1901 value) was assumed throughout the spin-up.
Monthly N-deposition rates, varying decadally and across the global grid, were taken from the ACCMIP database of Lamarque et al. (2013). The values were interpolated bilin-early from their original 1.9◦×2.5°grid to the 0.5◦×0.5◦ grid of the climate data. The 1850 deposition value for each grid cell was used up to and including the simulation year corresponding to 1850 in the spin-up.
2.2.2 Forest ecosystem measurement sites
To assess in more detail interactions between stand structure and ecosystem function at the local scale at which such in-teractions occur, site-scale simulations were performed for European forest ecosystems for which measurements of for-est structure, production and N uptake are available from the Carbon and Nitrogen Cycling in Forest Ecosystems (CANIF) data set (Schulze, 2000). A subset of 10 sites, 5 dominated by evergreen conifers and 5 by winter deciduous broadleaved species, for which site climate data were available, were cho-sen for analysis. For each site, meteorological forcing data (monthly temperature, precipitation and incoming shortwave radiation) were constructed by regressing monthly values from the CRU data set on corresponding values from the available climate time series for the specific site, for the years for which the CRU and site data coincide (2–8 years de-pending on site). The resulting regression coefficients were used to construct a “site-adjusted” version of the CRU data to force the model through a 500-year spin-up and histori-cal simulation from 1901 up to and including the period of available CANIF data. Prior to 1901, the 1901–1930 data, with any temperature trend removed, were cycled repeatedly. Site-specific N-deposition data were constructed in a corre-sponding manner to the climate data, based on the Lamarque et al. (2013) data for the nearest grid point and N-deposition data for each CANIF site. N deposition and atmospheric [CO2] during the spin-up followed the same approach as in the global hindcast simulation. The PFT mixture simu-lated natively by the model (i.e. potential natural vegetation in equilibrium with the forcing climate) was retained during the spin-up. For the historical period of the simulation, actual CO2concentrations and N-deposition values from the near-est grid cell were applied. Fornear-est management history (where
available) was emulated by transferring all vegetation to litter in the historically recorded year of planting and establishing a new stand with the PFT composition and density prescribed from data, where available. For sites for which planting den-sity was not known, the value was calibrated to attain the observed density of the measurement years.
As the CANIF data set is restricted to a limited range of European forest ecosystems, NPP predictions from the model were also compared to productivity data from 132 sites across the wooded biomes of the world, compiled by Luyssaert et al. (2007). Simulation data from the nearest 0.5◦×0.5◦ grid cell for 1961–1990 from the global hind-cast experiment (above) were extracted for comparison to the Luyssaert data.
2.2.3 Forest succession experiment
To explore and demonstrate the ability of LPJ-GUESS to reproduce broad features of the structural and composi-tional evolution of forest stands during secondary succession (i.e. recovery following a disturbance event), observed data on species composition and size structure for 12 virgin bo-real forest stands in northern Sweden compiled by Linder et al. (1997) were aggregated into a chronosequence, i.e. rank ordered in terms of stand age. For comparison to these data, a model simulation was performed for the 9 nearest 0.5◦×0.5◦ grid points from the CRU climate database surrounding each observed stand. Following a standard spin-up (see above) all vegetation was removed, emulating a disturbance, and the simulation continued for 270 years forced by climate data for 1961–1990, cycled repeatedly. A 1901 CO2 concentra-tion of 296 ppmv was used to force the model initially, suc-ceeded by the CO2concentration time series for 1901–1990 for the last 90 years of the simulation. N-deposition data from the same grid points as the climate data were employed (see Sect. 2.2.1), forcing the model with the 1850 value initially, thereafter the observed time series for 1860–1990.
2.2.4 Forest stand allometry experiment
of performance in simulating conjoint changes in structure (e.g. biomass) and function (e.g. NPP) for wooded ecosys-tems. With one exception, the DVMs considered by Wolf et al. (2011) all employ large-area parameterisations of biomass accumulation that, in contrast to LPJ-GUESS, do not distin-guish age/size classes of trees and thereby cannot discrim-inate population from individual growth. To examine allo-metric scaling in the vegetation structure predicted by LPJ-GUESS we extracted data for the calendar year 2001 from the results of the global hindcast experiment (above) for those grid cells that encompassed one or more stands from the Cannell (1982) or Usoltsev (2001) databases considered by Wolf et al. (2011). Following Wolf et al. (2011), straight-line relationships were fitted by simple straight-linear regression to log-log plots of mean tree biomass (M, kg) versus population
density (individuals ha−1)and foliage versus stem biomass (kg), for this sample of grid cells. The resulting curves were compared with the observed stand data and the correspond-ing curves for the DVMs considered by Wolf et al. (2011).
2.2.5 Forest FACE experiment
In a study spanning forest ecosystems globally, Hickler et al. (2008) simulated the potential effect on NPP of rais-ing CO2 concentrations by 200 ppm in a manner emulating CO2 treatment in free-air CO2 enrichment (FACE) experi-ments. Elevated CO2 concentrations were simulated to en-hance NPP by 15–35 % depending on the biome. However, the authors conjectured that these findings might be overes-timates, because nutrient limitations, not represented in the C-only version of LPJ-GUESS they used for their simula-tions, might limit the NPP enhancement under elevated CO2, as widely discussed in the literature (e.g. Luo et al., 2004) and demonstrated empirically in some elevated-CO2 experi-ments (Hyvönen et al., 2007; Norby et al., 2010).
We repeated the same model experiment performed by Hickler et al. (2008) with N cycling enabled. The global model experiment was carried out using the gridded CRU TS 3.0 global climate data set (Mitchell and Jones, 2005). Two simulations were performed: one with actual histori-cal CO2 concentrations from 1901 to 2002 (McGuire et al., 2001), and one with historical CO2concentrations increased to 550 ppmv during 1996–2002. The chosen time period cor-responds approximately to that in which the FACE measure-ments considered by Hickler et al. (2008) were obtained. The model was run with potential natural vegetation and for all grid cells classified as forest in the Haxeltine and Pren-tice (1996b) map of global potential natural vegetation, with the exception of tropical deciduous forests, which have a savannah-like structure. Following a 500-year spin-up to es-tablish the “steady-state” vegetation, the model was driven by the observed climate from 1901 to 2002.
2.2.6 Future-climate experiment
Hungate et al. (2003) estimated upper and lower limits for possible global N supply to terrestrial ecosystems over the 21st century and compared these with the increased N de-mand suggested by the biomass and soil C changes pro-jected by a suite of six DVMs in a future-climate study by Cramer et al. (2001). They concluded that a majority of the models vastly overestimated the potential increase in ecosys-tem carbon storage, especially the fertilisation effect of in-creased atmospheric CO2, when accounting for limitations in the amount of N available for the production of additional biomass. To evaluate and compare the performance of LPJ-GUESS with and without N constraints under future-climate and [CO2] forcing, and to compare the results in terms of global N demand with other models and the limits proposed by Hungate et al. (2003), we extended the global hindcast experiment, described above, to 2100 forced by climate and [CO2] data from the RCP 8.5 climate scenario with the MPI-ESM-LR general circulation model (GCM; Giorgetta et al., 2013) and N-deposition data from Lamarque et al. (2011).
3 Results
3.1 Global C and N stocks and fluxes
Table 1.Mean global C and N stocks and fluxes simulated for 1961–1990 in the global hindcast experiment, and according to literature
estimates.
Variable1 Unit Simulated by LPJ-GUESS Literature estimates
C-only C–N DVMs refs2 Obs-based refs3
GPP Pg C yr−1 116 112 118. . .132 1,2 108. . .130 1,5,10,17
NPP Pg C yr−1 61 58 52. . .58 9,12,15 56. . .63 5,10,13,17
Rh Pg C yr−1 53 52 n/a 45. . .55 8,17
BB Pg C yr−1 7.6 5.2 2.0. . .3.5 8,10 1.5. . .3.8 13,15,16
NCB Pg C yr−1 −1.5 −0.8 −2.7. . .−0.2 6,7,11,14 −3.2. . .−1.0 11.13
Veg C Pg C 770 570 440. . .860 4,6,12,15 470. . .650 8,13
Soil + litter C Pg C 1740 1570 1130. . .2250 6,12,13,15 1270. . .2010 8,12
Veg N Pg N – 3.6 3.1. . .18.0 3,5,12,13,14,15 3.5 14
Soil + litter N Pg N – 120 68. . .250 3,5,12,13,15 95. . .118 12,14
N uptake Tg N yr−1 – 970 600. . .1130 4,9,13,14,15
NUE kg C (kg N)−1 – 60 50. . .51 9,15
N min Tg N yr−1 – 980 1030 15
N leaching Tg N yr−1 – 13 20. . .84 7,14,15 52 2
N fixation Tg N yr−1 – 34 100. . .290 3,6
1GPP = gross primary production; NPP = net primary production;R
h= heterotrophic respiration; BB = biomass burning by wildfires; NCB = net ecosystem C
balance = Rh+ BB−NPP; Veg N = vegetation N; NUE = nitrogen-use efficiency; N min = net N mineralisation.
2References: 1. Alton et al. (2007); 2. Chen et al. (2012); 3. Esser et al. (2011); 4. Fisher et al. (2010b); 5. Gerber et al. (2010); 6. Goll et al. (2012); 7. Jain et al. (2009);
8. Li et al. (2012); 9. Melillo et al. (1993); 10. Thonicke et al. (2010); 11. Thornton et al. (2007); 12. Wang et al. (2010); 13. Xu-Ri and Prentice (2008); 14. Yang et al. (2009); 15. Zaehle et al. (2010).
3References: 1. Beer et al. (2011); 2. Boyer et al. (2006); 3. Cleveland et al. (1999); 4. Cleveland and Liptzin (2007); 5. Demarty et al. (2007); 6. Galloway et al. (2004);
7. House et al. (2003); 8. IPCC (2007); 9. Ito et al. (2004); 10. Ito et al. (2011); 11. Piao et al. (2010); 12. Post et al. (1985); 13. Saugier and Roy (2001); 14. Schlesinger et al. (1997); 15. Schultz et al. (2008); 16. van der Werf et al. (2010); 17. Zhang et al., 2009.
the Cleveland et al. (1999) parameterisation is based. This results in the low N fixation estimate shown in the table.
In general, accounting for C–N interactions appears to have a minor influence on simulated stocks and fluxes of carbon under the present-day climate at global scale in LPJ-GUESS; however, it should be borne in mind that the model has been calibrated (by adjustment of the quantum efficiency scalar,αa; see Appendix B), independently for the C-only and C–N simulations, to the literature estimates shown in Ta-ble 1.
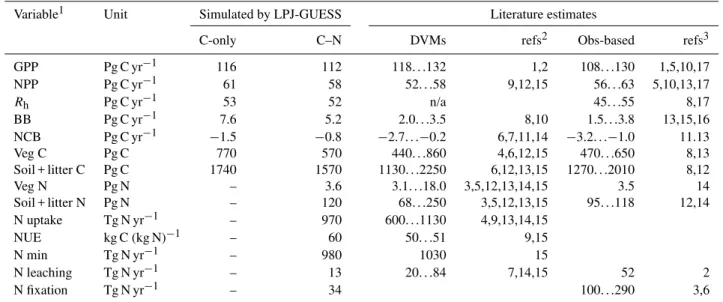
The global distribution of ecosystem NPP simulated by LPJ-GUESS C–N in the global hindcast experiment is shown in Fig. 1a. The geographic pattern is comparable to that sug-gested by other model-based studies (Schloss et al., 1999; Running et al., 2004) and inferred from observations (e.g. for gross primary production (GPP) by Jung et al., 2011), with the highest productivity simulated to occur in the wet trop-ics, intermediate levels in mesic parts of the middle latitudes, declining to negligible levels in the deserts and high Arctic. In an intercomparison study involving several DVMs, Piao et al. (2013) found that the C-only standard version of LPJ-GUESS exhibited a negative bias in GPP in the wet trop-ics compensated in part by a positive bias in high north-ern latitudes, in comparison to global GPP inferred based on ecosystem flux data by Jung et al. (2011). Mean global GPP (113±3 Pg C yr−1)was comparable to the Jung et al. (2011)
estimate of 118±1 Pg C yr−1. In the C–N simulation, N
lim-itation of production associated with low mineralisation and fixation rates results in lower productivity in cold-climate ar-eas (Fig. 1b) and a steeper gradient from high to low latitudes compared with the C-only simulation. Due to recalibration of
αa, global GPP and NPP remain relatively similar to the C-only simulation (Table 1).
Fig. 1. (A)Mean annual NPP (kg C m−2yr−1)for 1961–1990 sim-ulated by the C–N version of LPJ-GUESS in the global hindcast experiment;(B)N limitation of NPP, showing the value obtained
by dividing mean NPP in each grid cell for 1961–1990 from the C–N simulation by the value obtained in a C-only simulation with the same value of the global quantum efficiency scalarαa(see text).
Values close to 1 thus denote “no limitation”, lower values increas-ing limitation of NPP by N availability.
N limitation across the 15◦C coldest-month isotherm, most obviously in northern Australia.
3.2 Potential natural vegetation
Vegetation patterns simulated by LPJ-GUESS in the C–N simulation (Fig. 2b) are comparable to results obtained by Hickler et al. (2006) using the C-only standard version of the model run in the more generalised population mode (similar to LPJ-DGVM; Sitch et al., 2003). The main differences con-cern a lower herbaceous component at the expense of woody vegetation in water-limited ecosystems in the present study, resulting in an increased coverage of woodlands and shrub-lands and less savannah and grassland. A further difference concerns the extent of theLarix-dominated boreal deciduous forest in Siberia (see below).
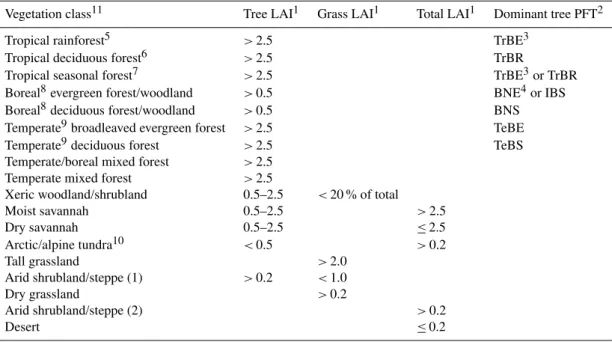
Comparison with the Haxeltine and Prentice (1996b) map of potential natural vegetation (Fig. 2a) reveals broad agree-ment in the geographic locations and ranges of major forest types versus water-limited vegetation types such as savan-nahs, shrublands and grasslands, as well as tundra. Agree-ment at the level of individual vegetation classes is poorer, but is influenced by thresholds in the classification scheme for transforming simulated PFT abundances to vegetation classes for mapping (Appendix A, Table A1). The boreal for-est tree line in the Northern Hemisphere (NH) is correctly placed by the model, with the exception of eastern Siberia, where the model predicts a more southerly transition zone
Fig. 2.Potential natural (Haxeltine and Prentice, 1996b; Hickler et
al., 2006) (A)and simulated vegetation for 1961–1990 from the
(B) C–N and(C)C-only simulations. The classification scheme
for transforming PFT abundances from the model simulation to the vegetation classes (biomes) in the legend modified from Hickler et al. (2006) (see Appendix A, Table A1).
to Arctic tundra, compared with the vegetation map. Tundra is also simulated for parts of eastern Alaska and northwest-ern Canada classified as boreal evergreen forest/woodland in the vegetation map. The C-only simulation (Fig. 2c) repro-duces the observed distribution of forest versus tundra for this area, revealing that N limitation is acting too strongly in the C–N simulation, suppressing the tree line by reducing tree productivity below the limits for continuous forest cover. A more limited extent of the SiberianLarix-dominated bo-real deciduous forest belt was predicted by LPJ-GUESS C– N compared both with the vegetation map and the Hickler et al. (2006) results. This cannot be explained by the cold-season temperature limits prescribed for boreal deciduous trees – which are in common with the Hickler et al. (2006) study – but reflects the influence of N limitation, reducing tree productivity and lowering leaf area index (LAI) below the threshold of 0.5 for boreal deciduous forest/woodland in the classification scheme. This is confirmed by the re-sults from the C-only simulation (Fig. 2c), boreal deciduous forest becoming much more extensive when N limitation is switched off.
of the Boreal Forest into dry-climate parts of North Amer-ica and Central Asia. Temperate forest of both hemispheres is correctly placed, although in the NH a comparatively low representation of deciduous broadleaved trees results in an overrepresentation of the classes temperate/boreal mixed forest and temperate broadleaved evergreen forest, when compared with the vegetation map. Water-limited (xeric) vegetation belts of western North America, Central Asia and the Mediterranean are predicted by the model; how-ever, woody PFTs are overrepresented in comparison to grasses, with the result that some steppe (Central Asia) and prairie (North America) areas are misclassified as xeric woodland/shrubland instead of grassland. This apparent bias favouring woody PFTs in drier climates may be explained in part by the arbitrary LAI thresholds that determine whether a certain mixture of trees and grasses is classified as wood-land/shrubland, grassland or savannah in the classification scheme (Table A1); presence of both trees and grasses is sim-ulated in most areas mapped as xeric woodland/shrubland in the C–N simulation. However, a general shift towards a greater representation of woody vegetation, compared with the Hickler et al. (2006) study, is apparent both in the C-only and C–N simulation results of the present study. A likely planation is an update of a parameterisation in the model ex-pressing specific leaf area (SLA, i.e. leaf area per unit leaf mass) as a function of leaf longevity (see Appendix C). As a result of this update, SLA is reduced for all PFTs, but PFTs having shorter-lived leaves, including deciduous grasses, ex-perience a proportionately greater reduction in PAR uptake capacity, and therefore NPP. The result is a competitive shift favouring woody PFTs at the expense of grasses, which is most strongly expressed in dry-climate areas such as savan-nah and steppe areas.
Equatorial rainforest of Central America and the Amazon, the Congo Basin and southeast Asia is correctly placed by the model. A high representation of tropical evergreen trees results in some areas classified as tropical seasonal forest in the vegetation map being classified as tropical rainforest by the model. For the same reason, moist savannah on the vege-tation map tends to be classified as forest by the model.
3.3 Forest ecosystem measurement sites
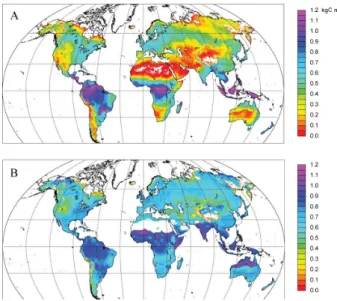
Model performance in comparison to observations from the CANIF forest measurement sites and biome averages from the Luyssaert et al. (2007) database is shown in Fig. 3. In general, the model appears successful in simulating the canopy height (Fig. 3b) for a given stand density (Fig. 3a), bearing in mind that density was calibrated to the ob-served data for each site (see Methods), while height is a free diagnostic variable in the model. In the case of NPP (Fig. 3c), the average simulated for all sites by the model (0.52 kg C m−2yr−1)may be compared to the average for the observations (0.43 kg C m−2yr−1), but there is little agree-ment between the model and observations among sites.
Sim-ilarly poor agreement between simulated and observed NPP for the CANIF sites was noted for the O-CN model by Zaehle and Friend (2010). When compared with biome-specific av-erages from the larger Luyssart database, there is moderate agreement: the model, like the Luyssaert estimates, gener-ally exhibiting higher productivities for closed forest ecosys-tems of the mid-latitudes and tropics, and lower values for strongly water- and temperature-limited ecosystems such as savannahs, grasslands and some types of boreal forest. For nitrogen-use efficiency (NUE), i.e. NPP per unit vegetation N uptake (Fig. 3d), the model results span a much wider range among sites compared to the CANIF data. Vegetation and litter C : N ratios in LPJ-GUESS are assumed to vary pro-portionately (on allocation) with leaf C : N, the latter in turn depending on the carboxylation capacity that maximises cur-rent net C assimilation subject to the amount of N needed for production of the carboxylation apparatus (largely the en-zyme rubisco) (Appendix C). This means that tissue C : N stoichiometry is allowed to vary within wide bounds de-pending on dynamic variations in plant demand versus sup-ply of N. It is possible that tissue C : N ratios in the model are thus insufficiently constrained, exaggerating the struc-tural and biochemical plasticity of real plants, and overes-timating variation in NUE. Results from an intercomparison of 11 ecosystem models, including LPJ-GUESS, with N cy-cling effects on production enhancement inferred from the results of forest FACE experiments suggest that LPJ-GUESS and other models simulating flexible stoichiometry generally overestimate the stoichiometric plasticity of trees (Zaehle et al., 2014).
3.4 Forest successional dynamics
0 500 1000 1500 2000 2500
0 500 1000 1500 2000 2500 0 5 10 15 20 25 30 35
0 5 10 15 20 25 30 35
0.0 0.2 0.4 0.6 0.8 1.0
0.0 0.2 0.4 0.6 0.8 1.0 0 20 40 60 80
0 20 40 60 80
Observed tree density (ha−1)
Modelled tree density (ha
−1)
Observed NPP (kgC m−2 yr−1)
Modelled NPP
(kgC m
−2 yr −1)
Observed tree height (m)
Modelled tree height (m
)
Observed NUE (kgC [kgN]−1)
Modelled NUE (kgC [kgN]
−1)
CANIF forest sites: broadleaf needleleaf
Luyssaert biomes: boreal deciduous forest boreal evergreen forest temperate/boreal mixed forest temperate deciduous forest temperate broadleaved evergreen temperate mixed forest tropical rainforest tropical deciduous forest moist savannah dry grassland
(A)
(B)
(C)
(D)
Fig. 3.Comparison of data on forest structure (A: tree density;B: height),(C)NPP and(D)N use efficiency (NPP per unit plant N uptake)
for the CANIF European forest sites with simulation results from LPJ-GUESS. Model runs were adjusted to match the observed tree density at each site in(A). All other quantities are simulated without site-specific calibration.(C)includes biome-average data for 132 sites from the
Luyssaert et al. (2007) database.
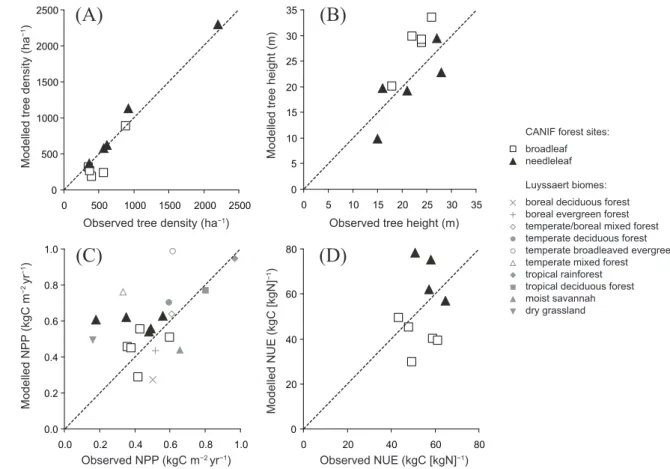
category (<5 cm stem diameter) after about one century,
persisting for longer in the canopy (larger tree size classes,
>15 cm) where shading is less pronounced. A
chronose-quence constructed by ordering 12 forest sites in order of age since the last disturbance suggests qualitatively similar successional dynamics and size structure compared with the simulation results (Fig. 4a). It should be noted that each point (stand age) in the chronosequence represents a unique site, so that the depicted variability reflects differences in popu-lation structure both in space (local edaphic and climatic en-vironment, stand composition, small-scale disturbances) and time (succession). By contrast, the model results are aver-aged among grid cells, depicting only variability due to stand development (and a small component due to stochastic pro-cesses in the model).
3.5 Forest stand allometry experiment
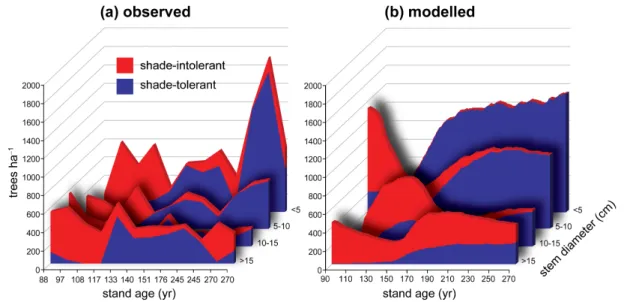
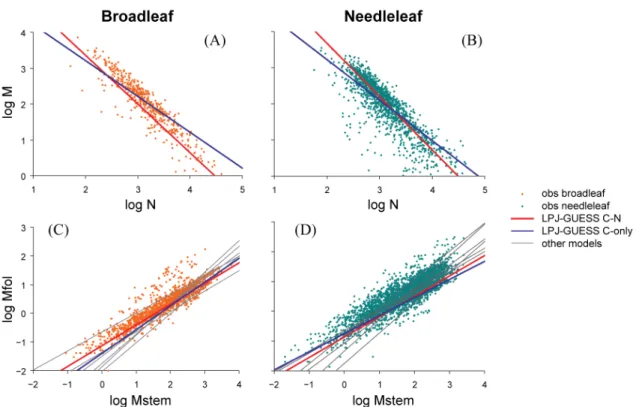
In Fig. 5, allometric scaling relationships fitted to simulated data for global forests in the forest stand allometry exper-iment are compared to observations (all panels) and to the corresponding curves relating tree foliage mass to stem mass (Fig. 5c and d) for the eight models considered by Wolf et
al. (2011). In general, the slope coefficient (β) of the depicted
Fig. 4.Size structure and generalised composition of boreal forest stands along a chronosequence constructed by ranking 12 virgin forest
stands in northern Sweden in order of age.(a)Observed data modified from Linder et al. (1997);(b)average for corresponding locations simulated under repeated 1961–1990 climate. Shade-intolerant = aggregated data forBetulaspp., other deciduous, and Pinus sylvestris; shade-tolerant =Picea abies. Note:xaxis not to scale for(a); each tick mark corresponds to a specific stand arranged in rank order of age along the axis.
Table 2.Slope (β) of the scaling relationships depicted in Fig. 5 for observed forest stands and for the C–N and C-only simulations. For symbols see caption of Fig. 5.
Observed LPJ-GUESS LPJ-GUESS
C–N C-only
log(M) : log(N)
broadleaf forest −1.39 −1.36 −1.00 needleleaf forest −1.32 −1.48 −1.12
log(Mfol) : log(Mstem)
broadleaf forest 0.70 0.72 0.83
needleleaf forest 0.66 0.68 0.60
and disturbance, making any improvements in accuracy dif-ficult to trace to any particular process or interaction in the model.
3.6 Forest FACE experiment
FACE treatment applied synthetically to wooded ecosystems across the globe resulted in a qualitatively similar global pattern in a C–N simulation compared with Hickler’s et al. (2008) analysis based on the C-only standard version of LPJ-GUESS (Fig. 6). CO2 fertilisation results in an in-creased productivity in all regions, but the percentage en-hancement of NPP is lowest in high-latitude ecosystems, increasing along a temperature gradient to the tropics. The main mechanism underlying this pattern is the greater rela-tive enhancement of leaf-level net C assimilation at higher
temperatures expected as a result of the suppression of pho-torespiration at higher temperatures in C3vegetation (Long 1991). Such a response is encapsulated in the Farquhar-based photosynthesis model adopted by LPJ-GUESS (Hickler et al., 2008). Quantitatively, however, the gradient in NPP en-hancement from high to middle latitudes is steeper in the new C–N version of the model. This is explained by N limitation at the cold end of the gradient, where the N-mineralisation-and -fixation-limited supply of soil N is unable to match an increased demand from the less [CO2]-limited canopy. NPP enhancement drops to<10 % over much of the Boreal Zone
and Arctic, compared with 5–15 % in the C-only model. Sim-ilar findings were reported from a comparison between the C–N and C-only versions of the O-CN model by Zaehle et al. (2010).
Fig. 5.Component biomass allometry for broadleaf-dominated(A, C)and needleleaf-dominated(B, D)grid cells from C–N and C-only simulations superimposed on data for forest stands from the Cannell (1982) and Usoltsev (2001) databases. Curves are fitted to model data from the 0.5◦×0.5◦grid cells encompassing stand coordinates from the observed databases. Allometric relationships from the land surface
models considered by Wolf et al. (2011) (grey curves) are reproduced from that paper.N= tree population density (ha−1);M= total biomass of average tree (kg);Mfol= foliage biomass of average tree (kg);Mstem= stem biomass of average tree (kg).
alone. The C-only version of LPJ-GUESS used by Hickler et al. (2008) accounts only for the effect on photosynthesis, not respiration: C-use efficiency remains unaffected by en-hanced [CO2]. The same mechanism can be expected to op-erate for all PFTs and climate zones, but is suppressed in ar-eas experiencing greater N limitation, such as cool temperate and boreal forests, and in areas with higher initial LAI. The latter explains why NPP enhancement is generally lower in high-LAI tropical ecosystems, e.g. in the Amazon and Congo Basin (Fig. 6c).
Whereas the majority of forest FACE experiments have been implemented in temperate forests, there is consensus based on theory and results from whole-tree chamber ma-nipulations and one tree line FACE experiment that cold-climate ecosystems may experience much lower rates of NPP enhancement under elevated CO2 compared with the 21– 25 % increase typically seen in temperate forest FACE exper-iments, at least during the first years of treatment (Norby et al., 2005; Kostiainen et al., 2009; Dawes et al., 2011). Nitro-gen limitation, allocation shifts from above- to below-ground parts of the plant as well as sink limitation for the additional assimilates resulting from a CO2-driven increase in photo-synthesis are offered as explanations (Hyvönen et al., 2007). It should be noted that the above-mentioned results con-cern the modelled influence of elevated CO2concentrations
on NPP. We do not analyse the fate of the increased C uptake within the ecosystem. Results from FACE experiments and other CO2manipulations reveal that increased photosynthe-sis or NPP will not necessarily translate into larger biomass stocks or ecosystem carbon storage, for example if the extra C is mainly allocated to pools with fast turnover rates, such as fine roots or root exudates (Norby et al., 2002; Körner et al., 2005; Finzi et al., 2007).
3.7 Future-climate experiment
Fig. 6.Geographic pattern of simulated NPP enhancement (%) (1996–2002) resulting from a step increase of atmospheric CO2concentration
from ambient to 550 ppmv;(A)pattern of NPP enhancement from C-only model in Hickler et al. (2008);(B)corresponding pattern from LPJ-GUESS C–N (present study);(C)average NPP enhancement by latitude band from Hickler et al. (2008) and present study.
10
8
6
4
2
0
−2
0 200 400 600 800
Additional C stored (Pg C)
Additio
nal N required/stored (Pg N)
High
Low N supply limits
C-only, range C-N
C-only, range C-N
CO2
CO2+climate
}
}
Fig. 7.Nitrogen required to support terrestrial carbon uptake
be-tween 2000 and 2100 simulated in the C–N and C-only simulations under CO2-only and CO2-and-climate-change scenarios based on RCP 8.5 radiative forcing of the MPI-ESM-LR general circulation model (GCM). High and low N supply limits proposed by Hungate et al. (2003) are shown. For C-only the upper N-requirement value assumes a fixed tree C : N of 200 following Hungate et al. (2003), the lower value that all new tree carbon is allocated to wood with a C : N of 500. Soil is assumed to have a fixed C : N of 15. For C–N, N requirements are as simulated by the model.
respiration and reduced soil water availability in low–mid-latitude dry-climate areas, which reduces NPP both in the C–N and C-only simulations.
The additional N requirement simulated in the C-only sim-ulation under [CO2] forcing alone only slightly exceeds the high N supply limit of Hungate et al. (2003) and is lower compared to any of the six models considered in that study. All of the latter models are “first-generation” DVMs that employ large-area parameterisations of vegetation dynam-ics and whose ability to replicate the temporal evolution of vegetation structure and biomass accumulation under rapidly changing driving conditions may be questioned (Purves and Pacala, 2008; Fisher et al., 2010a). In the LPJ model, for ex-ample, the ability for vegetation C pools to increase to absorb a CO2-driven increase in primary production is limited by a strict geometric constraint imposed by the prescribed allom-etry of “average individual” plants (Sitch et al., 2003). As a result, increased productivity may too strongly translate into increased biomass turnover (through phenology and mortal-ity) and soil C storage, requiring a steady supply of N for the continuous replacement of plant biomass.
(Miller and Smith, 2012). Demographic lags may be ex-pected, and are simulated by the model, even in areas al-ready occupied by trees but where increased productivity en-ables stand densification to occur; such effects will be simu-lated under CO2fertilisation alone, in the absence of climate change. In addition, Piao et al. (2013) show that LPJ-GUESS simulates a lower baseline (present-day) GPP globally than current versions of all but one of the models (SDGVM) anal-ysed by Hungate et al. (2003). This may reflect a low bias for GPP in the wet tropics in the C-only version of LPJ-GUESS (Piao et al., 2013), although simulated GPP in that study was consistent globally with an independent data-driven estimate (Jung et al., 2011; Piao et al., 2013).
In the C–N simulation, the additional N requirement falls between the low and high supply limits of Hungate et al. (2003). It may be argued that these limits are too low as they do not account for the influence on N supply of in-creased mineralisation in warming soils, nor for a possible increase in plant N uptake capacity at elevated CO2(Finzi et al., 2007). However, accepting the (conservative) logic of the Hungate et al. (2003) analysis, the estimates of C and N sequestration under future-climate and [CO2] forcing sug-gested by the C–N simulation appear to be realistic and mu-tually consistent.
4 Discussion
Accounting for N cycle dynamics had two main overall effects on the performance and behaviour of our model. Firstly, negative effects of low temperatures and soil mois-ture deficits on SOM dynamics and N mineralisation resulted in a soil N-mediated relative reduction in plant productivity most strongly expressed in cold-climate ecosystems of the Boreal Zone and Arctic, and dry-climate regions of middle latitudes. Forest ecosystems occupying well-watered parts of the temperate zone and tropics were less affected by N limita-tion. As a result, NPP appears to exhibit stronger large-scale geographic gradients in the C–N version of LPJ-GUESS, compared with the standard C-only version of the model. This is likely to represent an improvement in performance when compared with observation-based estimates of large-scale productivity (Piao et al., 2013). Secondly, N limitation resulted in shifts in vegetation structure, generally favouring woody PFTs and C4 grasses and disfavouring C3 grasses. This effect was most pronounced in temperate dry-climate regions such as western North America and Central Asia and would tend to amplify the primary (physiology-driven) N limitation in the model, since woody PFTs, having higher C costs due to the production of stems, exhibit lower growth efficiency (NPP per unit leaf area) than grasses when grow-ing under the same conditions. In areas where N limitation results in a marked reduction in whole-ecosystem NPP, how-ever, an opposing shift, favouring grasses at the expense of trees, arises from the release of grasses from suppression due
to shading and preemption of space by trees. In comparison to a map of potential natural vegetation of the world, account-ing for N cycle dynamics thus appeared to result in improved model agreement in some areas (e.g. western North America, Central Asia) but poorer agreement in others (e.g. equatorial rainforest margins, Siberian larch belt), depending on the de-gree of primary N limitation and the strength and direction of a shift between herbaceous and woody PFTs.
moderate drought reduces N availability, creating a transient sink for C as biomass accumulates in the stems of growing trees and shrubs. This mechanism outweighs the “primary”, negative effect of N limitation on NPP which dominates the response seen in other studies. A closer analysis of the mech-anisms of response of C and N balance to future-climate and CO2forcing is available in Wårlind et al. (2014).
A serious limitation of the current N cycle in LPJ-GUESS is the simplistic representation of biological N fixation, thought to be one of the primary processes that limit pro-ductivity of ecosystems (Luo et al., 2004), as a linear func-tion of evapotranspirafunc-tion. In addifunc-tion to predicting substan-tially lower global values compared with observation-based estimates, a concern with the adopted parameterisation from Cleveland et al. (1999) is that it is phenomenological rather than mechanistic in nature (evapotranspiration is a large-scale covariate of BNF – both tend to be higher in areas char-acterised by a warm climate with ample moisture – but not a direct driver) and can not therefore be assumed to hold true when the model is applied beyond the range of the observa-tions on which it is based: for example, under a high-CO2 future global climate (Wang and Houlton, 2009). The imple-mentation of BNF as dependent on simulated actual evapo-transpiration (AET) may also be questioned, as the relation-ship between AET and BNF, even within the range of modern observations of these two variables, may potentially change in the future as a result of down-regulation of stomatal con-ductance under elevated [CO2], increasing the water-use effi-ciency of ecosystems, and due to differential responses of N-fixing versus non-N-fixing plants to elevated [CO2] (Ainsworth and Long, 2005). A parsimonious alternative would be to force the model with a global climatology (time-independent map) of BNF, constructed for example from the Cleveland et al. (1999) correlation with AET, as performed in the O-CN model (Zaehle and Friend, 2010).
This study has focused on the role of soil-N-mediated con-straints on plant productivity in controlling ecosystem func-tioning and vegetation structure. The incorporation of N cy-cling in LPJ-GUESS also provides the basic structure for the modelling of ecosystem production and emission of N-based trace gases (e.g. N2O, NOx), allowing the model to be used
as a tool in assessments of how these climatically impor-tant gases respond to climate change and changes in N in-put in a consistent, process-based manner (Xu-Ri and Pren-tice, 2008). Feedbacks related to changes in climate, CO2 concentration, and terrestrial N2O emissions can be quanti-fied in a coupled and consistent manner (Zaehle et al., 2010). Simulating soil NOxemissions within a dynamically chang-ing environment, accountchang-ing for factors beyond soil water content or temperature (Ganzeveld et al., 2002), facilitates the conjoint analysis of terrestrial greenhouse gas emissions, and emissions of ozone and aerosol precursors in a common framework (Arneth et al., 2010).
At the aggregate global scale, accounting for N cycle dy-namics did not clearly change or obviously improve the
abil-ity of the model to reproduce C and N fluxes and stocks, compared with observational studies and results from other models. However, gradients in NPP along global tempera-ture and water availability gradients were clearly changed by the incorporation of N cycle dynamics – and these may in turn be assumed to have cascading impacts on all pools and fluxes of vegetation and soils. Such similar behaviour at global scale combined with greater contrasts between re-gions when N cycle dynamics are accounted for reveals the presence of compensating regional errors, cancelling one an-other at the global scale, in the C-only or C–N version of the model (or both). In practice, it is safe to assume that all globally parameterised models, like LPJ-GUESS, have un-dergone some degree of tuning to attain an overall “accept-able” fit to global metrics such as NCB, GPP/NPP, vegeta-tion and soil C (in LPJ-GUESS, such tuning has been lim-ited to adjustment of the global quantum efficiency scalar, as discussed above and in Appendix C). As any model, by definition, is a simplification of the real-world system it rep-resents and thus must entail some errors, such global-scale tuning will almost inevitably trade errors in different regional contexts – where different drivers and mechanisms dominate whole-system dynamics – against one another, potentially re-sulting in larger errors in any particular region, even while performance at the aggregate global scale appears to be im-proved by tuning. It is our hope that the incorporation of N cycling in LPJ-GUESS reduces regional errors by more ade-quately representing the key processes underlying vegetation and ecosystem dynamics in the major climate zones of the world. In general, the intercomparison of the simulation re-sults to benchmarks of structure and function from a range of ecosystem types in the present study provides some confi-dence that this may be so.
Acknowledgements. We thank Jean-Francois Lamarque for
gen-erously providing the ACCMIP global data set of N deposition employed as forcing in our model simulations. We acknowledge the WCRP Working Group on Coupled Modelling, the participating modelling groups, and the U.S. Department of Energy’s Program for Climate Model Diagnosis and Intercomparison for provision of the CMIP5 climate change projection adopted in our study. Development of N cycling in LPJ-GUESS was partly funded by the Mistra Swedish Research Programme for Climate, Impacts and Adaptation and by the Swedish Research Council FOR-MAS. Thomas Hickler acknowledges support from the research funding programme LOEWE-Landesoffensive zur Entwicklung Wissenschaftlich-ökonomischer Exzellenz of the Ministry of Higher Education of Hesse. This study is a contribution to the Linnaeus Centre of Excellence LUCCI, the Strategic Research Areas BECC and MERGE, and the EU-FP7 project EMBRACE (grant no. 282672).
References
Aerts, R.: Nutrient resorption from senescing leaves of perennials: are there general patterns?, J. Ecol., 84, 597–608.
Ahlström, A., Miller, P. A., and Smith, B.: Too early to infer a global NPP decline since 2000, Geophys. Res. Lett., 39, L15403, doi:10.1029/2012GL052336, 2012.
Ahlström, A., Schurgers, G., Arneth, A., and Smith, B.: Robust-ness and uncertainty in terrestrial ecosystem carbon response to CMIP5 climate change projections, Environ. Res. Lett., 7, 044008, doi:10.1088/1748-9326/7/4/044008, 2012.
Ainsworth, E. A. and Long, S. P.: What have we learned from 15 years of free-air CO2enrichment (FACE)? A meta-analytic
re-view of the reponses of photosynthesis, canopy properties and plant production to rising CO2, New Phytol., 165, 351–372, 2005.
Alton, P. B., Ellis, R., Los, S. O., and North, P. R.: Improved global simulations of gross primary production based on a separate and explicit treatment of diffuse and direct sunlight, J. Geophys. Res.-Atmos., 112, D07203, doi:10.1029/2006JD008022, 2007. Arora, V. K., Boer, G. J., Friedlingstein, P., Eby, M., Jones, C. D.,
Christian, J. R., Bonan, G., Bopp, L., Brovkin, V., Cadule, P., Hajima, T., Iljina, T., Lindsay, K., Tjiputra, J. F., and Wu, T.: Carbon-concentration and carbon-climate feedbacks in CMIP5 Earth system models, J. Climate, 26, 5289–5314, 2013. Arneth, A., Sitch, S., Bondeau, A., Butterbach-Bahl, K., Foster, P.,
Gedney, N., de Noblet-Ducoudré, N., Prentice, I. C., Sanderson, M., Thonicke, K., Wania, R., and Zaehle, S.: From biota to chem-istry and climate: towards a comprehensive description of trace gas exchange between the biosphere and atmosphere, Biogeo-sciences, 7, 121–149, doi:10.5194/bg-7-121-2010, 2010. Beer, C., Reichstein, M., Tomelleri, E., Ciais, P., Jung, M.,
Carval-hais, N., Roedenbeck, C., Arain, M. A., Baldocchi, D., Bonan, G. B., Bondeau, A., Cescatti, A., Lasslop, G., Lindroth, A., Lomas, M., Luyssaert, S., Margolis, H., Oleson, K. W., Roupsard, O., Veenendaal, E., Viovy, N., Williams, C., Woodward, F. I., and Papale, D.: Terrestrial gross carbon dioxide uptake: global dis-tribution and covariation with climate, Science, 329, 834–838, 2010.
Booth, B. B., Jones, C. D., Collins, M., Totterdell, I. J., Cox, P. M., Sitch, S., Huntingford, C., Betts, R. A., Harris, G. R., and Lloyd, J.: High sensitivity of future global warming to land carbon cy-cle processes, Environ. Res. Lett., 7, 024002, doi:10.1088/1748-9326/7/2/024002, 2012.
Boyer, E. W., Howarth, R. W., Galloway, J. N., Dentener, F. J., Green, P. A., and Vorosmarty, C. J.: Riverine nitrogen export from the continents to the coasts, Global Biogeochem. Cy., 20, GB1S91, doi:10.1029/2005GB002537, 2006.
Bugmann, H.: A review of forest gap models, Climatic Change, 51, 259–305, 2001.
Cannell, M. G. R.: World Forest Biomass and Primary Production Data, Vol. VIIII, Academic Press, London, UK, 1982.
Cao, M. K. and Woodward, F. I.: Dynamic responses of terrestrial ecosystem carbon cycling to global climate change, Nature, 393, 249–252, 1998.
Chen, J. M., Mo, G., Pisek, J., Liu, J., Deng, F., Ishizawa, M., and Chan, D.: Effects of foliage clumping on the estimation of global terrestrial gross primary productivity, Global Biogeochem. Cy., 26, GB1019, doi:10.1029/2010GB003996, 2012.
Churkina, G., Brovkin, V., von Bloh, W., Trusilova, K., Jung, M., and Dentener, F.: Synergy of rising nitrogen depositions and atmospheric CO2 on land carbon uptake moderately off-sets global warming, Global Biogeochem. Cy., 23, GB4027, doi:10.1029/2008GB003291, 2009.
Cleveland, C. C., and Liptzin, D.: C : N:P stoichiometry in soil: is there a “Redfield ratio” for the microbial biomass? Biogeochem-istry, 85, 235–252, 2007.
Cleveland, C. C., Townsend, A. R., Schimel, D. S., Fisher, H., Howarth, R. W., Hedin, L. O., Perakis, S. S., Latty, E. F., Von Fischer, J. C., Elseroad, A., and Wasson, M. F.: Global patterns of terrestrial biological nitrogen (N2)fixation in natural ecosys-tems, Global Biogeochem. Cy., 13, 623–645, 1999.
Collatz, G. J. A., Ball, J. T., Grivet, C., and Berry, J. A.: Physi-ological and environmental regulation of stomatal conductance, photosynthesis and transpiration: a model that includes a laminar boundary layer, Agr. Forest Meteorol., 54, 107–136, 1991. Collatz, G. J., Ribas-Carbo, M., and Berry, J. A.: Coupled
photosynthesis-stomatal conductance model for leaves of C4 plants, Aust. J. Plant Physiol., 19, 519–538, 1992.
Comins, H. N. and McMurtrie, R. E.: Long-term response of nutrient-limited forests to CO2 enrichment; equilibrium
be-haviour of plant-soil models, Ecol. Appl., 3, 666–681, 1993. Cosby, B. J., Hornberger, G. M., Clapp, R. B., and Ginn, T. R.: A
statistical exploration of the relationships of soil-moisture char-acteristics of the physical properties of soils, Water Resour. Res., 20, 682–690, 1984.
Cox, P. M., Betts, R. A., Jones, C. D., Spall, S. A., and Totterdell, I. J.: Acceleration of global warming due to carbon-cycle feed-backs in a coupled climate model, Nature, 408, 184–187, 2000. Cramer, W., Bondeau, A., Woodward, F. I., Prentice, I. C., Betts,
R. A., Brovkin, V., Cox, P. M., Fisher, V., Foley, J. A., Friend, A. D., Kucharik, C., Lomas, M. R., Ramankutty, N., Sitch, S., Smith, B., White, A., and Young-Molling, C.: Global response of terrestrial ecosystem structure and function to CO2and cli-mate change: results from six dynamic global vegetation models, Glob. Change Biol., 7, 357–373, 2001.
Dawes, M. A., Hättenschwiler, S., Bebi, P., Hagedorn, F., Handa, I. T., Körner, C., and Rixen, C.: Species-specific tree growth re-sponses to 9 years of CO2enrichment at the alpine treeline, J. Ecol., 99, 383–394, 2011.
Demarty, J., Chevallier, F., Friend, A. D., Viovy, N., Piao, S., and Ciais, P.: Assimilation of global MODIS leaf area index retrievals within a terrestrial biosphere model, Geophys. Res. Lett., 34, L15402, doi:10.1029/2007GL030014, 2007.
Enquist, B. J., Brown, J. H., and West, G. B.: Allometric scaling of plant energetics and population density, Nature, 395, 163–165, 1998.
Esser, G., Kattge, J., and Sakalli, A. Feedback of carbon and nitro-gen cycles enhances carbon sequestration in the terrestrial bio-sphere, Glob. Change Biol., 17, 819–842, 2011.
Field, C. B., Chapin, F. S. I., Matson, P. A., and Mooney, H. A.: Responses of terrestrial ecosystems to the changing atmosphere: a resource-based approach, Annu. Rev. Ecol. Syst. 23, 201–235, 1992.
R.: Increases in nitrogen uptake rather than nitrogen-use effi-ciency support higher rates of temperate forest productivity un-der elevated CO2, P. Natl. Acad. Sci. USA, 104, 14014–14019, 2007.
Fisher, R., McDowell, N., Purves, D., Moorcroft, P., Sitch, S., Cox, P., Huntingford, C., Meir, P., and Woodward, F. I.: Assessing uncertainties in a second-generation dynamic vegetation model caused by ecological scale limitations, New Phytol., 187, 666– 681, 2010a.
Fisher, J. B., Sitch, S., Malhi, Y., Fisher, R. A., Huntingford, C., and Tan, S. Y.: Carbon cost of plant nitrogen acquisition: a mechanistic, globally applicable model of plant nitrogen up-take, retranslocation, and fixation, Global Biogeochem. Cy., 24, GB1014, doi:10.1029/2009GB003621, 2010b.
Franzluebbers, A. J. and Stuedemann, J. A.: Soil-profile organic car-bon and total nitrogen during 12 years of pasture management in the Southern Piedmont, USA, Agr. Ecosyst. Environ., 129, 28– 36, 2009.
Friedlingstein, P., Cox, P., Betts, R., Bopp, L., Von Bloh, W., Brovkin, V., Cadule, P., Doney, S., Eby, M., Fung, I., Bala, G., John, J., Jones, C., Joos, F., Kato, T., Kawamiya, M., Knorr, W., Lindsay, K., Matthews, H. D., Raddatz, T., Rayner, P., Reick, C., Roeckner, E., Schnitzler, K.-G., Schnur, R., Strassmann, K., Weaver, A. J., Yoshikawa, C., and Zeng, N.: Climate-carbon cy-cle feedback analysis: results from the C4MIP Model Intercom-parison, J. Climate, 19, 3337–3353, 2006.
Friend, A. D., Stevens, A. K., Knox, R. G., and Cannell, M. G. R.: A process-based, terrestrial biosphere model of ecosystem dynamics (Hybrid v3.0), Ecol. Model., 95, 249–287, 1997. Fulton, M.: Adult recruitment as a function of juvenile growth rate
in size-structured plant populations, Oikos, 62, 102–105, 1991. Galloway, J. N., Dentener, F. J., Capone, D. G., Boyer, E. W.,
Howarth, R. W., Seitzinger, S. P., Asner, G. P., Cleveland, C. C., Green, P. A., Holland, E. A., Karl, D. M., Michaels, A. F., Porter, J. H., Townsend, A. R., and Vorosmarty, C. J.: Nitrogen cycles: past, present, and future, Biogeochemistry, 70, 153–226, 2004. Ganzeveld, L. N., Lelieveld, J., Dentener, F. J., Krol, M. C.,
Bouw-man, A. J., and Roelofs, G. J.: Global soil-biogenic NOx
emis-sions and the role of canopy processes, J. Geophys. Res., 107, 4321, doi:10.1029/2001JD001289, 2002.
Gerber, S., Hedin, L. O., Oppenheimer, M., Pacala, S. W., and Shevliakova, E.: Nitrogen cycling and feedbacks in a global dynamic land model, Global Biogeochem. Cy., 24, GB1001, doi:10.1029/2008GB003336, 2010.
Gerten, D., Schaphoff, S., Haberlandt, W., Lucht, W., and Sitch, S.: Terrestrial vegetation and water balance – hydrological eval-uation of a dynamic global vegetation model, J. Hydrol., 286, 249–270, 2004.
Giorgetta, M. A., Jungclaus, J., Reick, C. H., Legutke, S., Bader, J., Böttinger, M., Brovkin, V., Crueger, T., Esch, M., Fieg, K., Glushak, K., Gayler, V., Haak, H., Hollweg, H.-D., Ilyina, T., Kinne, S., Kornblueh, L., Matei, D., Mauritsen, T., Mikolajew-icz, U., Mueller, W., Notz, D., Pithan, F., Raddatz, T., Rast, S., Redler, R., Roeckner, E., Schmidt, H., Schnur, R., Segschnei-der, J., Six, K. D., Stockhause, M., Timmreck, C., Wegner, J., Widmann, H., Wieners, K.-H., Claussen, M., Marotzke, J., and Stevens, B.: Climate and carbon cycle changes from 1850 to 2100 in MPI-ESM simulations for the Coupled Model
Intercom-parison Project Phase 5, J. Adv. Model. Earth Syst., 5, 572–597, 2013.
Goll, D. S., Brovkin, V., Parida, B. R., Reick, C. H., Kattge, J., Re-ich, P. B., van Bodegom, P. M., and Niinemets, Ü.: Nutrient lim-itation reduces land carbon uptake in simulations with a model of combined carbon, nitrogen and phosphorus cycling, Biogeo-sciences, 9, 3547–3569, doi:10.5194/bg-9-3547-2012, 2012. Haxeltine, A. and Prentice, I. C.: A general model for the
light-use efficiency of primary production, Funct. Ecol., 10, 551–561, 1996a.
Haxeltine, A. and Prentice, I. C.: BIOME3: An equilibrium ter-restrial biosphere model based on ecophysiological constraints, resource availability, and competition among plant functional types, Global Biogeochem. Cy., 10, 693–709, 1996b.
Hickler, T., Smith, B., Sykes, M. T., Davis, M. B., Sugita, S., and Walker, K.: Using a generalized vegetation model to simulate vegetation dynamics in the western Great Lakes region, USA, un-der alternative disturbance regimes, Ecology, 85, 519–530, 2004. Hickler, T., Prentice, I. C., Smith, B., Sykes, M. T., and Zaehle, S.: Implementing plant hydraulic architecture within the LPJ Dynamic Global Vegetation Model, Global Ecol. Biogeogr., 15, 567–577, 2006.
Hickler, T., Smith, B., Prentice I. C., Mjöfors, K., Miller, P., Ar-neth, A., and Sykes, M. T. CO2 fertilization in temperate for-est FACE experiments not representative of boreal and tropical forests, Glob. Change Biol., 14, 1531–1542, doi:10.1111/j.1365-2486.2008.01598.x, 2008.
House, J. I., Prentice, I. C., Ramankutty, N., Houghton, R. A., and Heimann, M.: Reconciling apparent inconsistencies in estimates of terrestrial CO2 sources and sinks, Tellus B, 55, 345–363, 2003.
Huang, S., Titus, S. J., and Wiens, D. P.: Comparison of non-linear height-diameter functions for major Alberta tree species, Can. J. Forest Res., 22, 1297–1304, 1992.
Hungate, B. A., Dukes, J. S., Shaw, M. R., Luo, Y., and Field, C. B.: Nitrogen and climate change, Science, 302, 1512–1513, 2003. Huntingford, C. and Monteith, J. L.: The behaviour of a
mixed-layer model of the convective boundary mixed-layer coupled to a big leaf model of surface energy partitioning, Bound.-Lay. Meteo-rol., 88, 87–101, 1998.
Hyvönen, R., Ågren, G. I., Linder, S., Persson, T., Cotrufo, M. F., Ekblad, A., Freeman, M., Grelle, A., Janssens, I. A., Jarvis, P. G., Kellomäki, S., Lindroth, A., Loustau, D., Lundmark, T., Norby, R. J., Oren, R., Pilegaard, K., Ryan, M. G., Sigurdsson, B. D., Strömgren, M., van Oijen, M., and Wallin, G.: The likely im-pact of elevated [CO2], nitrogen deposition, increased tempera-ture and management on carbon sequestration in temperate and boreal forest ecosystems: a literature review, New Phytol., 173, 463–480, 2007.
Intergovernmental Panel on Climate Change (IPCC): Climate Change 2007 – The Physical Science Basis. Contribution of Working Group I to the Fourth Assessment Report of the IPCC, Cambridge University Press, Cambridge, UK, 2007.
Ito, A. and Penner, J. E.: Global estimates of biomass burning emis-sions based on satellite imagery for the year 2000, J. Geophys. Res., 109, D14S05, doi:10.1029/2003JD004423, 2004. Ito, A.: A historical meta-analysis of global terrestrial net primary