Volume
17,
Issue
2
Paper No
15205,
1-4 pages
2015
http://mrsej.kpfu.ru
http://mrsej.ksu.ru
Established and published by Kazan University
Sponsored by International Society of Magnetic
Resonance (ISMAR)
Registered by Russian Federation Committee on Press,
August 2, 1996
First Issue was appeared at July 25, 1997
© Kazan Federal University (KFU)
*"
Magnetic Resonance in Solids. Electronic Journal
" (
MRS
ej
) is a
peer-reviewed, all electronic journal, publishing articles which meet
the highest standards of scientific quality in the field of basic
research of a magnetic resonance in solids and related phenomena.
MRS
ej
is free for the authors (no page charges) as well as for the
readers (no subscription fee). The language of
MRS
ej
is English.
All exchanges of information will take place via Internet. Articles
are submitted in electronic form and the refereeing process uses
electronic mail. All accepted articles are immediately published by
being made publicly available by Internet (
http://
MRS
ej
.kpfu.ru
).
*
In Kazan University the Electron Paramagnetic Resonance (EPR) was discovered by
Editors-in-Chief
Jean
Jeener
(Universite Libre de
Bruxelles, Brussels)
Boris
Kochelaev
(KFU, Kazan)
Raymond
Orbach
(University of
California, Riverside)
Executive Editor
Yurii
Proshin
(KFU, Kazan)
[email protected]
[email protected]
Editors
Vadim
Atsarkin
(Institute of Radio
Engineering and Electronics, Moscow)
Yurij
Bunkov
(CNRS, Grenoble)
Mikhail
Eremin
(KFU, Kazan)
David
Fushman
(University of Maryland,
College Park)
Hugo
Keller
(University of Zürich, Zürich)
Yoshio
Kitaoka
(Osaka University, Osaka)
Boris
Malkin
(KFU, Kazan)
Alexander
Shengelaya
(Tbilisi State
University, Tbilisi)
Nonlinear FMR spectra in yttrium iron garnet
†Yu.M. Bunkov1,2
, P.M. Vetoshko3
, I.G. Motygullin1
, T.R. Safin1
, M.S. Tagirov1
, N.A. Tukmakova1,∗
1
Kazan Federal University, Kremlevskaya 18, 420008 Kazan, Russia
2
Institut Neel, CNRS et Universite Joseph Fourier, F-38042 Grenoble, France
3
Institute of Radio Engineering and Electronics, RAS, 125009, Moscow, Russia
∗E-mail: [email protected]
(Received December 15, 2015; revised December 22, 2015; accepted December 25, 2015)
Results of demagnetizing effect studies in yttrium iron garnet Y3Fe5O12thin films are reported.
Experiments were performed on X-Band of electron paramagnetic resonance spectrometer at room temperature. The ferromagnetic resonance (FMR) spectra were obtained for one-layer single crystal YIG films for different values of the applied microwave power. Nonlinear FMR spectra transformation by the microwave power increasing in various directions of magnetic field sweep was observed. It is explained by the influence of the demagnetization action of nonequilibrium magnons.
PACS: 76.30.-v, 74.25.nj, 75.50.Gg
Keywords: yttrium iron garnet, EPR, magnons
The FMR spectra investigations of yttrium iron garnet (YIG) Y3Fe5O12single crystal thin
films are presented. Experiments were performed on X-band of electron paramagnetic resonance (EPR) spectrometer Varian E-12 (f ≈ 9.3 GHz) at room temperature. The sample was pre-pared in Carat company (Lvov, Ukraine) by standard isothermal liquid phase epitaxial (LPE) method during the joint work with the RAS Institute of Kotelnikov Radio Engineering and Electronics [1]. The yttrium iron garnet is a well-studied crystal with a ferrimagnetic ordering (Tc = 560 K). The 2D gadolinium gallium garnet (460÷490µm) was used as a substrate for the thin film (6 ÷ 9µm) of yttrium iron garnet. The typical FMR spectrum in the perpendicular orientation of the external magnetic field H to the surface is shown in Fig. 1a. The experiments were performed at the microwave pump power P of 10 mW, modulation amplitude of 5 mOe. Fig. 1b shows the corresponding integrated spectrum. The integrated spectra are presented in Fig. 2a and 2b.
The characteristic “collapse” points in all spectra can be seen. These points correspond to such value of a magnetic field, where the sharp decrease of adsorption is observed. With the increasing of microwave pumping powerP the position of “collapse”H0 shifts to the lower fields.
This shift depends linearly on the microwave pumping power (see Fig. 3a). Furthermore, the spectra strongly depend on the field sweep direction (Fig. 3b).
Fig. 3 shows integrated spectra for the various microwave power values in different directions of the magnetic field sweep.
The non-linearity of FMR spectra corresponds to the big value of magnetization deflection angle and decreased demagnetization factor. This effect is clearly seen in the Fig. 2, where the FMR lines at small excitations show the inhomogeneous broadening. With the increasing of
†This paper material was selected at XVIII International Youth Scientific School “Actual problems of magnetic resonance and its application”, Kazan, 26 – 30 October 2015. The paper was recommended to publication in our journal and it is published after additional MRSej reviewing.
Nonlinear FMR spectra in yttrium iron garnet
3975 4000 4025 4050 4075
-5 0 5 10 15 20 25 I ( a . u . ) H (Oe) a)
3975 4000 4025 4050 4075
-5 0 5 10 15 20 25 I ( a . u . ) H (Oe) b)
Figure 1. The differential FMR spectrum of YIG thin film in perpendicular orientation of magnetic field to the surface (a) and corresponding integrated spectrum (b).
4025 4030 4035 4040
0 5 10 15 20 25 0.1 mW 10 mW I ( a . u . ) H (Oe) Increasing of magnetic field
a)
30 mW
4020 4025 4030 4035 4040
0 10 20 30 40 I ( a . u . ) H (Oe) 0.1 mW 10 mW 30 mW
Decreasing of magnetic field
b)
Figure 2. Integrated spectra for various microwave power P in increasing (a) and decreasing (b) of magnetic field.
0 5 10 15 20 25 30
4025 4030 4035 H ( O e ) P (mW) a)
4020 4025 4030 4035 4040
0 5 10 15 20 25 30 35 40 I ( a . u . ) H (Oe) b) 30 mW Decreasing of magnetic field Increasing of magnetic field
Yu.M. Bunkov, P.M. Vetoshko, I.G. Motygullin, et al.
excitation the line asymmetry is observed. This asymmetry can be explained by a relatively large angle of magnetization deflection β, which decreases the demagnetization field 4πMscosβ and, consequently, increases the frequency of FMR at given field [2]:
ωres=γ(H0−4πMscosβ). (1)
The creation of magnon leads to a reducing the sample magnetization Ms to one Bohr magneton βM. The number of stationary nonequilibrium magnons NM is proportional to the absorption and microwave power. As a result the signal shifts to the lower field:
∆H0= 4π∆Mscosβ, (2) where ∆Ms=NMβM. The excited state has a relaxation rate. At some magnetic fieldH0 value
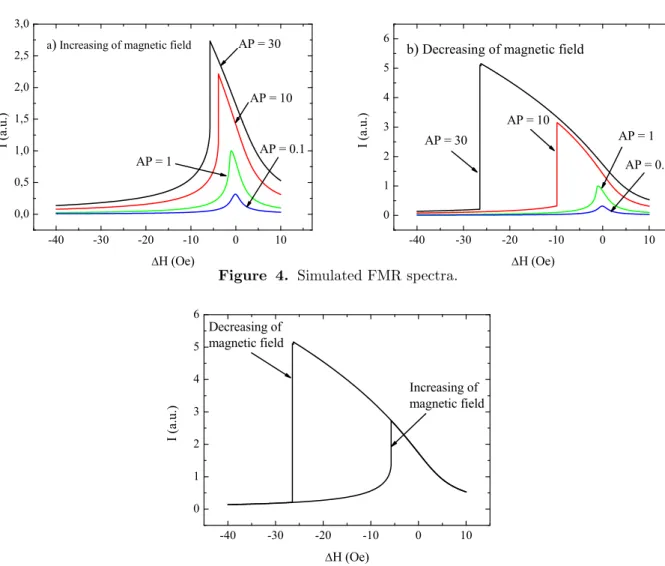
the signal disappears (“collapse” points). It can be explained as the microwave pumping power is not enough for supporting the necessary amount of nonequilibrium magnons NM. In Fig. 2 and Fig. 3 the signal shift from the resonance is seen, which is described in good agreement with equations (1) and (2). The described FMR spectrum behavior was simulated. The results of simulation are shown in Fig. 4 and Fig. 5, AP = ∆H0, where P is a microwave power, A is a
dimensional coefficient.
It is clearly seen an excellent match of simulated spectrum transformation with experimental behavior, but for the total understanding of all nonlinear effects and, consequently, for sugges-tion of theoretical model it is necessary to provide some addisugges-tional investigasugges-tions of magnons dynamics.
-40 -30 -20 -10 0 10
0,0 0,5 1,0 1,5 2,0 2,5 3,0 I ( a . u . ) H (Oe)
AP = 0.1 AP = 1
AP = 10 a) Increasing of magnetic field AP = 30
-40 -30 -20 -10 0 10
0 1 2 3 4 5 6 I ( a . u . ) H (Oe) AP = 10
AP = 1
AP = 0.1 AP = 30
b) Decreasing of magnetic field
Figure 4. Simulated FMR spectra.
-40 -30 -20 -10 0 10
0 1 2 3 4 5 6 I ( a . u . ) H (Oe) Increasing of magnetic field Decreasing of magnetic field
Figure 5. Simulated FMR spectra at the different magnetic field sweep directions (AP = 30).
Nonlinear FMR spectra in yttrium iron garnet
Acknowledgments
The work is performed according to the Russian Government Program of Competitive Growth of Kazan Federal University. The work of P.M. Vetoshko is supported by RSF grant No.14-22-00279.
References
1. Syvorotka I. I., Vetoshko P. M., Skidanov V. A., Shavrov V. G., Syvorotka I. M.,IEEE Trans.
Magn.51, 7029234 (2015).