The infrared spectra of amine collectors used in the flotation
of iron ores
R.M.F. Lima
a, P.R.G. Brandao
b,*, A.E.C. Peres
caDepartment of Mining Engineering/UFOP, Ouro Preto, MG, Brazil
bDepartment of Mining Engineering/UFMG, Rua Espirito Santo 35, sala 702, Belo Horizonte, MG 30160-030, Brazil
cDepartment of Metallurgical and Materials Engineering/UFMG, Rua Espirito Santo 35, sala 702, Belo Horizonte, MG 30160-030, Brazil
Received 13 September 2004; accepted 15 October 2004
Abstract
Inverse froth flotation is the most used concentration method for itabiritic iron ores, where the quartz gangue is floated, and the iron oxides are kept depressed by starches; medium-chain etheramine acetates are the cationic collectors used. Since there is a lack of thorough studies on the infrared spectroscopy of these reagents (and by other similar techniques), an investigation on the band assignment in the infrared spectra of a typical etheramine acetate was carried out by Fourier-transform infrared spectrom-etry. To distinguish the bands due to the cationic amine ion from the acetate anion ones, a molecular decyletheramine was also studied, as well as its salts, after some degrees of neutralisation, by acetic or hydrochloric acids; also, potassium acetate was included, to assess the anion bands alone. From this approach, all the significant bands were successfully assigned to the important functional groups in the collectorÕs molecule: NHx, C H2, C H3, –O–, and the acetate bands. A confirmation of
this method was the identification of the amine cation bands alone, without the presence of the previously associated ace-tate bands, after adsorption onto the surface of quartz particles, from an aqueous solution of a decyletheramine aceace-tate, at pH = 10.5.
2004 Elsevier Ltd. All rights reserved.
Keywords:Iron ores; Flotation reagents; Mineral processing
1. Introduction
Froth flotation is the most used concentration method in itabiritic iron ores beneficiation, and it is also exten-sively used in the processing of similar ores, such as tac-onites (Hout, 1983;Uwadiale, 1992). In the past, direct flotation methods have been proposed, but presently the one largely employed is the inverse flotation method, in which the quartz gangue is floated, while the iron oxi-des/hydroxides are kept depressed, with the help of
starches (Iwasaki, 1983; Numela and Iwasaki, 1986). Medium hydrocarbon chain amines (having 10–12 car-bon atoms) are the cationic collectors used in iron ore re-verse flotation (Iwasaki, 1989;Lima and Brandao, 1999). Amine solubility in water is very low; so for this re-agent to be used successfully, it has to be neutralised (at least partially) by acetic acid, in order to increase its solubility (Leja, 1982;Fuerstenau et al., 1985). This partial neutralisation consists in the formation of a pri-mary amine salt, in which acetate is the anionic radical; the alkyl aminium ion is obviously the cationic counter-part. In order to increase the collectorÕs solubility even further, ether groups have been incorporated into its structure, so the resulting chemical formulae are the following:
0892-6875/$ - see front matter 2004 Elsevier Ltd. All rights reserved.
doi:10.1016/j.mineng.2004.10.016
* Corresponding author. Tel.: +55 31 3238 1967; fax: +55 31 3238
1966.
E-mail address:pbrandao@demin.ufmg.br(P.R.G. Brandao).
by means of other similar techniques), so their identifica-tion and characterizaidentifica-tion is not readily done. Some clas-sical textbooks on infrared spectrometry (Nakanishi and Solomon, 1977; Socrates, 1980; Smith, 1999) do assess the band assignment of many amines and related sub-stances, but the above-mentioned specific compounds actually used in quartz gangue flotation in industrial plants have not received the same type of study or the existing information has not been published.
2. Experimental
Therefore, an investigation on the bandsÕassignment in the infrared spectrum of a typical etheramine acetate was carried out by Fourier-transform infrared spectrom-etry (Giesekke, 1983). An initial problem was to distin-guish the bands that could be due to the amine cation and/or to the acetate anion. To overcome this difficulty, the following procedure was obeyed:
(a) the spectrum of the typical alkyl etheramine acetate was recorded; its hydrocarbon chain had mainly 10 carbon atoms;
(b) a molecular (neutral) etheramine, having otherwise the same characteristics of the acetate amine salt, also had its spectrum registered;
(c) this neutral etheramine was reacted with acetic acid, and also with hydrochloric acid, to 10, 20, 30, 40 and 50% neutralisation degrees, at the temperature
pounds and KBr pressed pellets for potassium acetate (Chia and Ricketts, 1988). The instrument was a Per-kin-Elmer FTIR spectrometer, model 1760-X.
In order to verify the nature of the species adsorbed in the quartz–aqueous solution interface, the following experiment was carried out, and corresponding infrared spectra were recorded:
(a) fine quartz particles (specific surface area = 11.0 m2/g) were put in contact with an aqueous solution of a commercial grade etheramine acetate collector (the same used in the infrared band assignment tests), with a concentration of 1.14·102 moles/
litre, at pH = 10.5;
(b) after contact for 60 min, the particles were separated by filtration, thoroughly rinsed with water at the same pH (10.5) and dried at room temperature; (c) KBr pellets were prepared, containing suitable
amounts of these quartz particles, which were expected to carry on their surfaces the adsorbed species.
3. Results and discussion
3.1. Reference spectra and neutralisation studies
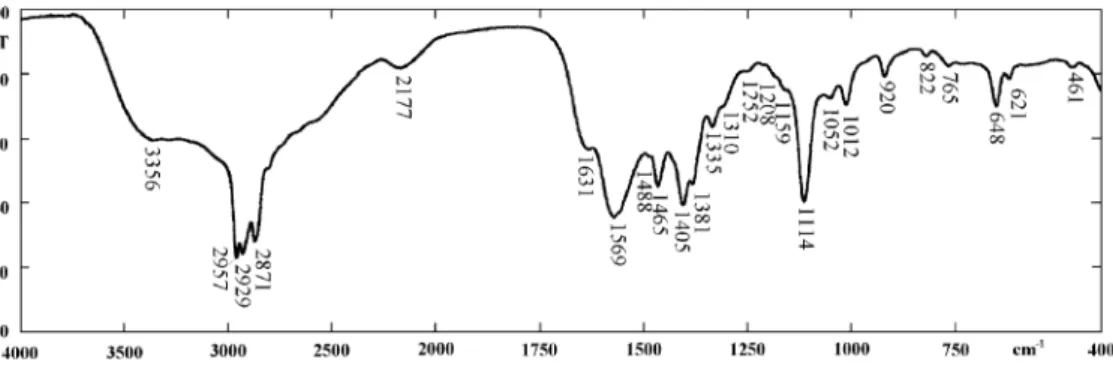
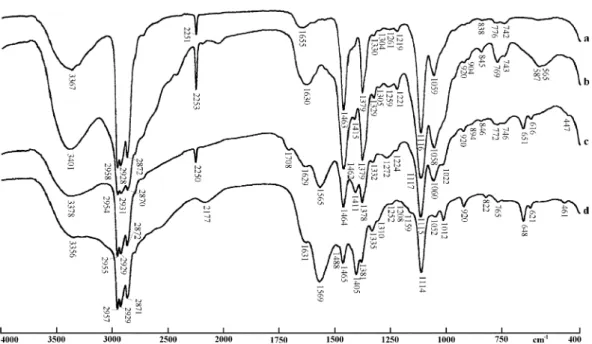
Figs. 1–7display the spectra recorded for all cases of interest in this study.Fig. 1is the spectrum of the typical
commercial decyletheramine acetate, which is the sub-ject of the band assignments and adsorption studies in this investigation. Figs. 2 and 3 show the spectrum of the molecular etheramine and the spectra of the neutral-isation products upon reaction with hydrochloric and acetic acids, respectively.Fig. 5is the spectrum of pure potassium acetate.
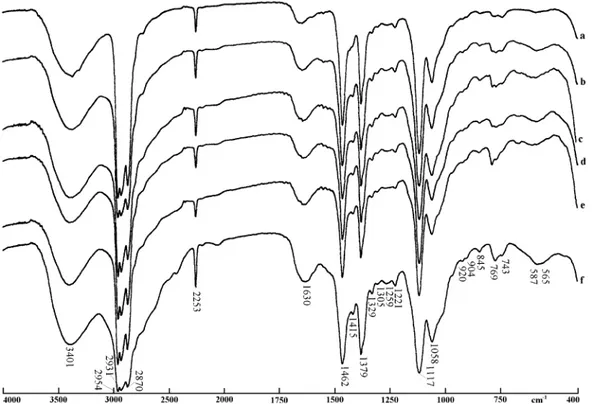
Fig. 4summarizes the results obtained, since it shows the spectra of the original molecular amine and that of the decyletheramine acetate. Between these, are dis-played the spectra of the neutralisation products, ob-tained in this work, with hydrochloric and acetic acid, at the 50% level.
The main difference between the spectra of the neu-tralised amines and the spectrum of the original molec-ular amine is the broadening of the region between 3200 and 2220 cm1; this is called ‘‘the ammonium band’’ and is diagnostic of the protonation of the former amine, i.e. the formation of an ammonium salt (Nakanishi and Solomon, 1977;Socrates, 1980). As can be observed in Figs. 2 and 3, this peak broadening is gradual according to the degree of neutralisation, but is noticeable even in the 10% samples. In the 50% neutralisation spectra it is very conspicuous, despite the superposition with other strong peaks in this spectral region.
The spectra of the original amine and the neutralisa-tion products with hydrochloric acid are remarkably similar (Figs. 2 and 4). The only significant differences
are the above mentioned ‘‘ammonium band’’ and a small displacement of the band originally at 1655 cm1 to 1630 cm1. This peak is assigned to the bending vibrations of the NH2 group. More than the proton-ation, the presence of water causes this displacement to shorter wavelengths; the water is introduced by the acid solution used in neutralisation.
The neutralisation with acetic acid (Figs. 3 and 4), in addition to the peaks mentioned above, introduces other bands, mainly in the 1750 cm1 to 1250 cm1 range. These bands are possibly due to vibrations of the acetate group and other evidences about this are presented ahead.
By comparing all these spectra, including the potas-sium acetate spectrum in Fig. 5, it is evident that only two bands can be unambiguously assigned to the ether-amine cation, in the important spectral region where the bending vibrations of the CH2and CH3groups occur: the peaks at 1465 cm1and at 1381 cm1. Due to the marked difference in chain length between the ether-amine (10 + 3 carbon atoms) and the short acetate chain (with only a methyl group), these bending vibrations are distinguished. The other bands in the 1750 cm1 to 1250 cm1 range and lower wavenumber spectral re-gions in the etheramine acetate spectrum are assigned to the carboxilate group.
Fig. 4. Infrared transmission spectra (ordinates in % transmittance): (a) molecular etheramine; (b) etheramine chloride, at 50%; (c) etheramine acetate, at 50%; (d) commercial etheramine acetate.
group, being therefore diagnostic of the etheramine cat-ion (Papini et al., 2001).
As expected, the group of strong bands between 3000 and 2750 cm1are assigned to the stretching vibrations of the CH2and CH3groups. Therefore, they are charac-teristic of the amine cation, but they do not yield any clue on the presence and absence of the acetate anion, as opposed to the ones in the 1700–1250 cm1range.
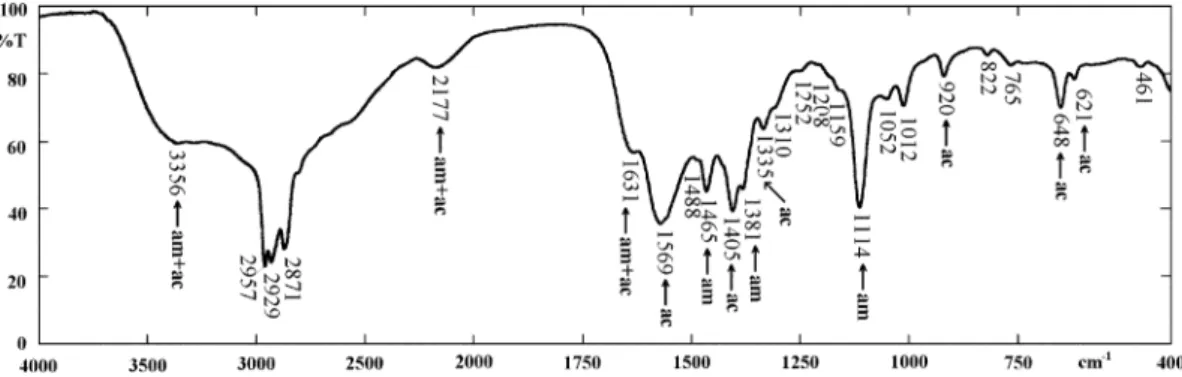
Therefore, etheramine acetate band assignment can be accomplished, with a high degree of confidence, from the results of the present work and from the general data in the literature, in the following way (Nakanishi and Solomon, 1977;Socrates, 1980;Smith, 1999):
• Decyletheramine cation bands: 3356*, 2957, 2929, 2871, 1631*, 1465, 1381, 1114 cm1
.
The ones deserving specific assignment explanation are the following:
3356 cm1!undifferentiated stretching of NHx (*interference with water);
2957 cm1!asymmetric stretching of CH3; 2929 cm1!asymmetric stretching of CH2; 2871 cm1!symmetric stretching of CH3; 2850 cm1!symmetric stretching of CH2;
1631 cm1!undifferentiated bending of NHx (*interference with water);
1465 cm1!asymmetric bending of CH3+ scissor-ing (in-plane symmetric bendscissor-ing) of CH2;
1381 cm1!symmetric bending of CH3;
1114 cm1!stretching of C–O–C (ethereal oxygen).
• Acetate anion bands (see Fig. 5): 1569, 1405, 1335,
1050, 1012, 648, 621 cm1.
The ones deserving specific assignment explanation are the following:
1569 cm1!asymmetric stretching of COO; 1405 cm1!symmetric stretching of COO+ asym-metric bending of CH3;
1335 cm1!symmetric bending of CH3.
The asterisk denotes the bands having a high chance of interference by water vibrations: approxi-mately 3356 cm1, stretching modes; approximately 1631 cm1, bending modes.
All the other bands appearing in the spectra are not worth special mention because of any of the following reasons: (a) they occur in both spectra of the etheramine and the acetate; (b) they correspond to or are highly influenced by water; (c) they are too small or not reproducible.
Fig. 5. Infrared transmission spectrum of potassium acetate.
3.2. Adsorption studies
An elegant confirmation of the assignment of these diagnostic infrared bands study was obtained from the adsorption tests, as follows (Fig. 7):
(a) in the infrared spectra obtained, clearly defined bands, including the diagnostic peaks of the ether-amine cation were observed; the most important of these bands were the ones located at 1463 cm1 and 1378 cm1;
(b) no bands assigned to the anionic acetate species could be observed, in the same spectra.
Therefore, these results prove that only the alkyle-theramine cations were adsorbed to the quartz sub-strate. That is exactly what is expected from the currently accepted models of amine cations adsorption
important functional groups in the collectorÕs molecule in their different vibration modes: NHx, C H2, C H3, –O–, and the acetate bands.
The important and diagnostic etheramine bands were located at the following positions: 1462 cm1–1465 cm1, 1378 cm1–1381 cm1, due to bending vibrations of CH3 and CH2; 1114 cm1–1117 cm1, due to the vibration of the ethereal oxygen.
The typical acetate bands were positioned at the fol-lowing frequencies: 1565 cm1–1569 cm1, 1405 cm1– 1411 cm1, 1012 cm1–1018 cm1, 920 cm1–923 cm1, 648 cm1651 cm1.
Other bands were strong and important, but they were not essentially diagnostic, e.g. the hydrocarbon chain CH stretching vibrations occurring from 2960 cm1 to 2870 cm1, and the NH stretching and bending vibrations at 3400 cm1–3350 cm1 and 1655 cm1–1630 cm1, respectively.
An elegant confirmation of this method was the iden-tification of the amine cation bands alone, without the presence of the previously associated acetate bands, after adsorption onto the surface of quartz particles, from an aqueous solution of an amine acetate, at pH = 10.5. The acetate ion, therefore, stayed away from the inner interface region, thus behaving as an indiffer-ent species.
Acknowledgments
The authors are indebted to many companies and individuals for the supply of samples and reagents. They also thank the Brazilian Agencies CNPq and CAPES for the scholarships and financial support.
References
Chia, L., Ricketts, S., 1988. Basic Techniques and Experiments in Infrared and FT-IR Spectroscopy. Perkin-Elmer Corp, Norwalk. Fuerstenau, M.C., Miller, J.D., Khun, M.C., 1985. Chemistry of
Flotation. SME-AIME, New York.
Giesekke, E.W., 1983. A review of spectroscopic techniques applied to the study of interactions between minerals and reagents in Fig. 7. Infrared transmission spectra (ordinates in % transmittance):
flotation systems. International Journal of Mineral Processing 11, 9–56.
Hout, R., 1983. Beneficiation of iron ore by flotation—review of industrial and potential applications. International Journal of Mineral Processing 10, 183–204.
Iwasaki, I., 1983. Iron ore flotation, theory and practice. Mining Engineering 35 (June), 622–631.
Iwasaki, I., 1989. Bridging theory and practice in iron ore flotation. In: Chander, S., Klimpel, R.R. (Eds.), Advances in Coal and Mineral Processing. SME Inc, Littleton, pp. 177–190.
Leja, J., 1982. Surface Chemistry of Froth Flotation. Plenum Press, New York.
Lima, R.M.F., Brandao, P.R.G., 1999. Investigation on the selectivity in the inverse flotation of iron ores by infrared spectrometry. In: Laskowski, J.S. (Ed.), Polymers in Mineral Processing. CIM, Montreal, pp. 139–152.
Nakanishi, K., Solomon, P.H., 1977. Infrared Absorption Spectros-copy, second ed. Holden-Day, San Francisco.
Numela, W., Iwasaki, I., 1986. Iron ore flotation. In: Somasundaran, P. (Ed.), Advances in Mineral Processing. SME Inc, Littleton, pp. 308–342.
Papini, R.M., Brandao, P.R.G., Peres, A.E.C., 2001. Cationic flotation of iron ores: amine characterization and performance. Minerals and Metallurgical Processing 17 (2), 5–9.
Smith, B., 1999. Infrared Spectral Interpretation—A Systematic Approach. CRC Press, Boca Raton.
Socrates, G., 1980. Infrared Characteristic Group Frequencies. Wiley-Interscience, Chichester.