www.nonlin-processes-geophys.net/20/179/2013/ doi:10.5194/npg-20-179-2013
© Author(s) 2013. CC Attribution 3.0 License.
Nonlinear Processes
in Geophysics
Geoscientific
Geoscientific
Geoscientific
Geoscientific
A typical wave wake from high-speed vessels: its group structure
and run-up
I. Didenkulova1,2and A. Rodin1,2
1Laboratory of Wave Engineering, Institute of Cybernetics at Tallinn University of Technology, Akadeemia tee 21, 12618 Tallinn, Estonia
2Nizhny Novgorod State Technical University, Nizhny Novgorod, Russia Correspondence to: I. Didenkulova ([email protected])
Received: 2 September 2012 – Revised: 4 February 2013 – Accepted: 4 February 2013 – Published: 26 February 2013
Abstract. High-amplitude water waves induced by high-speed vessels are regularly observed in Tallinn Bay, the Baltic Sea, causing intense beach erosion and disturbing ma-rine habitants in the coastal zone. Such a strong impact on the coast may be a result of a certain group structure of the wave wake. In order to understand it, here we present an experimental study of the group structure of these wakes at Pikakari beach, Tallinn Bay. The most energetic vessel waves at this location (100 m from the coast at the water depth 2.7 m) have amplitudes of about 1 m and periods of 8–10 s and cause maximum run-up heights on a beach up to 1.4 m. These waves represent frequency modulated packets where the largest and longest waves propagate ahead of other smaller amplitude and period waves. Sometimes the groups of different heights and periods can be separated even within one wave wake event. The wave heights within a wake are well described by the Weibull distribution, which has differ-ent parameters for wakes from differdiffer-ent vessels. Wave run-up heights can also be described by Weibull distribution and its parameters can be connected to the parameters of the distri-bution of wave heights 100 m from the coast. Finally, the run-up of individual waves within a packet is studied. It is shown that the specific structure of frequency modulated wave pack-ets, induced by high-speed vessels, leads to a sequence of high wave run-ups at the coast, even when the original wave heights are rather moderate. This feature can be a key to un-derstanding the significant impact on coasts caused by fast vessels.
1 Introduction
Waves induced by high-speed vessels, the depth Froude num-ber (the ratio of the ship’s speed and the maximum phase speed of linear water waves for the given depth) of which during the regular sailing regime exceeds 0.6, have become a subject of intensive study in the last ten years after the new generation of large and powerful ships operating at cruise speeds up to 30 knots has been introduced (Parnell and Kofoed-Hansen, 2001; Parnell et al., 2007, 2008; Soomere, 2007; Kurennoy et al., 2009, 2011; Torsvik et al., 2009; Ra-paglia et al., 2011). It has been demostrated that these waves can be a major contributor of energy to sections of coasts that are exposed to significant natural hydrodynamic loads (Soomere, 2005a). The actual effect depends upon the fea-tures of the coastal environment and the existing hydrody-namic loads. In this context, specific types of disturbances, such as high leading waves, monochromatic packets of rela-tively short waves, solitary and cnoidal wave trains ahead of the vessel and associated depression areas, all qualitatively different from the usual wind waves or constituents of the linear Kelvin wake, are extremely important (Brown et al., 1989; Neuman et al., 2001; Garel et al., 2008). These specific wave disturbances have been observed, for example, in the Venice Lagoon, Italy (Rapaglia et al., 2011), Savannah River, Georgia (Houser, 2011), New Zealand and Denmark (Parnell and Kofoed-Hansen, 2001) and Tallinn Bay, Estonia (Parnell et al., 2008).
All of these cases are characterized by the seri-ous damage of coastal environment. In the Marlborough Sounds, New Zealand, the introduction of high-speed fer-ries was accompanied by rapid and significant accretion
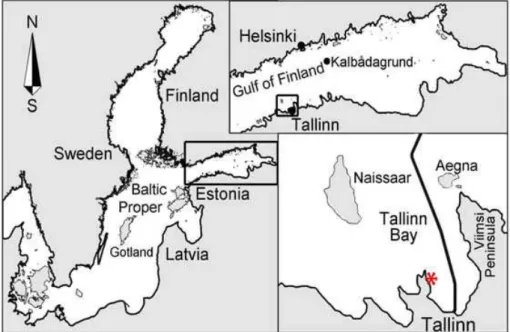
Fig. 1. Location scheme of the Baltic Sea and the study site.
‐
Fig. 2. High-speed vessel wakes at the Pikakari beach, Tallinn Bay, Baltic Sea.
(Parnell and Kofoed-Hansen, 2001). In contrast, in Tallinn Bay, Estonia, long and energetic groups of vessel waves resulted in dramatic erosion of initially accreting beach at Aegna Island (Parnell et al., 2008; Soomere et al., 2009). These groups could easily smooth out the emerging berm and sometimes exert very large run-up events (Didenkulova et al., 2009a; Soomere et al., 2009). The highest and longest ship waves from the first group reached over 1 m above still wa-ter level with several examples going over 1.5 m above still water level (Didenkulova et al., 2009a; Torsvik et al., 2009). However, on a few days there was evidence of overwash de-posits at heights about 2 m above water level (Soomere et al., 2009). The loss of sediments caused by one vessel wake was up to 1 m3 per meter of the coastline (Soomere et al., 2009). At Pikakari beach in Tallinn Bay, wake-induced sed-iment transport produced a stable convex nearshore beach profile (Didenkulova and Soomere, 2011) similar to a
spe-cific shape of the coast, which allows anomalous “nonreflect-ing” wave behavior (Didenkulova et al., 2009b).
Even though the significant effect of waves from high-speed vessels on low-energy coasts has been demonstrated for different basins and environments, the reason of its such strong impact still remains unclear. It can be partially con-nected to the net transport of water, excited by ships sail-ing at transcritical speeds, which may produce water level set-up under groups of high vessel waves and result in a rapid reaction of the coast (Soomere et al., 2011). This ef-fect may also be reinforced by the specific group structure of vessel-induced waves, when the largest, the longest and the most asymmetric waves come first and more symmetric waves of smaller amplitude and period come after. The char-acteristic properties of these groups are experimentally stud-ied in this paper for Pikakari beach in Tallinn Bay, the Baltic Sea.
0 2 4 6 8 10 12
-0.4 -0.2 0 0.2 0.4
Time, min
Wa
te
r d
isp
la
c
e
m
e
n
t, m
a
0 2 4 6 8 10 12
-0.4 -0.2 0 0.2 0.4
Time, min
b
Fig. 3. Vessel wakes from (a) SuperStar (18 June 2009), (b) Star (20 June 2009).
2 Experimental set-up
Tallinn Bay is a semi-sheltered bay in the almost tideless Baltic Sea, which is characterized by the relatively mild wind wave climate. The peak periods of wind waves are usually well below 3 s, reaching 4–6 s in strong storms and only in exceptional cases exceeding 7–8 s (Soomere, 2005b). The significant wave height in the bay exceeds 0.5 m with a prob-ability of 10 % (Soomere, 2005b).
In contrast to this low wind wave activity, Tallinn Bay reg-ularly hosts fast vessel traffic, with fairways located close to the shoreline and vessels operating at cruise speeds up to 30 knots (Parnell et al., 2008; Torsvik et al., 2009; Soomere et al., 2011). Fast vessel generated waves considerably exceed typical periods and heights of wind waves (Soomere, 2005a; Parnell et al., 2008). The periods of the highest waves are of 8–15 s and their heights are up to 2 m depending on location (Parnell et al., 2008; Kurennoy et al., 2009, 2011).
An experiment focusing on the properties of vessel wakes and their impact on coasts was performed at the Pikakari beach, Tallinn Bay (Fig. 1) during the high traffic period from 12 June till 1 July 2009. The environmental conditions in the period of the experiment were rather low, with the wind wave background mostly of about 10 cm and reaching 40 cm during three days. The vessels of our interest were the high-speed ferries Star, SuperStar and Viking XPRS, follow-ing routes Helsinki–Tallinn. All three vessels are large con-ventional ships with lengths of about 200 m and operational speeds of 30 knots, which are capable to generate large-amplitude, long and long-crested waves in Tallinn bay. How-ever, due to the variability in ship track and its speed along the track, the parameters of ship generated waves may vary, their averaged values are described in Kurennoy et al. (2009). Vessel generated waves were recorded using a downward-looking ultrasonic echo sounder (LOG aLevel®) with a sam-pling frequency of 5 Hz, mounted on a stable tripod approx-imately 100 m from the shoreline, 2.4 km from the sailing line at a water depth of about 2.7 m from 17 June till 1 July 2009, and were studied overall and with respect to the type of the vessel. The record contains 66 clearly identifiable wakes:
29 from Star, 23 from SuperStar and 14 from Viking XPRS. Maximum wave heights (up to 1 m) occurred exclusively for the longest waves with periods∼10 s whereas typical wind wave periods were 2–3 s.
In addition, maximum run-ups of all wake waves were measured at the coast manually, by following the inunda-tion of each wake wave and using video recording from 12 June till 1 July 2009. Since the distance between the echo sounder and coastal measurements was rather short (slightly more than 2 wavelengths), it was easy to follow the propaga-tion of each particular wave up to the coast. A wake shoaling on the beach at the experiment site is shown in Fig. 2. On the coast, one can see a pole for the run-up measurements and farther offshore a tripod, where sea level oscillations were recorded.
The time of video-recording was synchronized with the time of the echo sounder, so it was possible to link the wave height measured at the echo sounder and run-up at the coast for each wave in the wake. In total, run-ups from 86 wakes were measured: 36 of them from Star, 31 from SuperStar and 19 from Viking XPRS.
3 Statistics of waves and corresponding run-ups in the wake
The data set at Pikakari beach, Tallinn Bay, allows for a de-tailed study of the statistics of vessel-induced waves and cor-responding run-ups. The most energetic vessel waves at this location have amplitudes of about 1 m and periods of 8–10 s with maximum run-up heights up to 1.4 m.
All measured wave wakes have a specific structure of fre-quency modulated packets, where the largest and longest waves come first and waves of smaller amplitude and period after (Fig. 3). Sometimes the groups of different heights and periods can be separated even within one wake, as it is shown in Fig. 3a, where three groups of waves can be clearly iden-tified. The highest waves (with a height of up to 1 m) usually belong to the first group and occur after the passage of sev-eral long, high-amplitude waves.
0 0.1 0.2 0.3 0.4 0.5 0.6 0.7 0
1 2 3 4 5 6
p
d
f, m
-1
Wave height, m
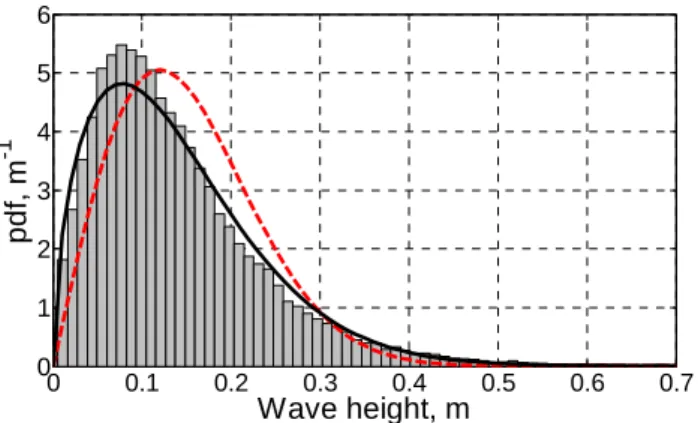
Fig. 4. Averaged distribution of wave heights within the wave wake; red dashed line corresponds to the Rayleigh distribution (σ=0.12 m), black solid line corresponds to the Weibull distribu-tion (σ=0.16 m,q=1.53) fitted using the maximum likelihood estimate.
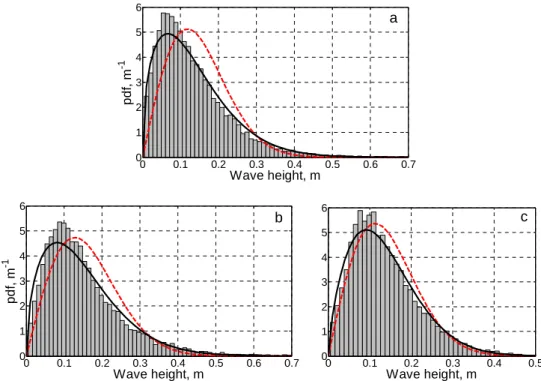
The averaged distributions of wave heights within the vessel wake, computed by the up-crossing method, are demonstrated in Figs. 4 and 5. The averaging was performed over all 66 recorded events (Fig. 4) and for each specific ship that crossed the bay several times during the time of the observations (Fig. 5). The average distribution gather-ing the data from all ships might be reasonable, since all studied vessels are characterized by similar lengths, widths, draughts and operational speeds and induce similar wave wakes, and, therefore, can be considered as an averaged wake wave height distribution. It can be seen that most of wave heights are distributed within the interval<30 cm and the number of particularly high waves in the wake is rather low. For example, the waves whose heights are larger than 40 cm constitute just 2 % of the wave heights within one wake. For wakes from different vessels it varies from 1 % for Viking XPRS, 2 % for Star and 3 % for SuperStar.
The obtained distributions of wave heights H within a wave wake are approximated by the mostly used probability density functions (pdf) in wave statistics: the one-parametric Rayleigh pdf
fR(H, σ )=
H σ2exp
"
−H 2
2σ2
#
, (1)
described by the only one scale parameterσ, measured in m, and two-parametric Weibull pdf
fW(H, σ, q)=
q σ
H
σ
q−1
exp
−
H
σ
q
, (2)
described by a scale parameter σ and a shape parame-ter q, using a nonlinear least squares method. Rayleigh distribution describes amplitudes of narrow-band Gaussian processes. However, sea wave measurements often deviate from Rayleigh. This is why, in oceanology, e.g. for wind
wave fields, a generalization of Rayleigh distribution – two-parametric Weibull distribution is used. Since Rayleigh dis-tribution fails to describe ship-generated waves, we fol-low the same scheme as for wind waves and apply two-parametric Weibull distribution for a better fit. Both approx-imated distributions are plotted in Figs. 4 and 5. It can be seen that Rayleigh pdf does not work well for description of the waves in the vessel wake. The best observed fit is for the Viking XPRS. However, Weibull pdf seems to be a fairly good model describing distribution of wave heights within a single vessel wake. Even though it underestimates the height of the distribution for waves of small (∼10 cm) amplitude, it describes well the distribution of all larger wave heights >15 cm. The mentioned discrepancy for small amplitude waves can be related to the existence of wind wave back-ground, whose amplitudes were<15 cm during most of the time of the experiment except a few days.
Approximated scale parameter σ remains the same for overall wave distribution (Fig. 4) and for distributions found for particular vessel types (Fig. 5) and is of the same order for both Rayleigh and Weibull pdfs. It changes from 0.1 m till 0.13 m for Rayleigh distribution and from 0.15 m to 0.16 m for Weibull distribution.
The shape parameterqin Weibull distribution varies more significantly. It is equal to 1.53 for overall distribution and reaches the value of 1.45 for Star, 1.52 for SuperStar and 1.71 for Viking XPRS vessels. This variety can be explained if we consider a physical meaning of the parameterq com-paring Weibull distribution with Glukhovsky distribution ob-tained for description of sea wave statistics at intermedi-ate wintermedi-ater depth (Glukhovsky, 1966). Glukhovsky distribu-tion has been obtained semi-empirically for wind waves in the coastal zone of the Caspian Sea by including an addi-tional parameter, the water depth. Since both Weibull and Glukhovsky distributions represent a generalization of the Rayleigh distribution, we use this analogy and apply it to ship-generated waves in shallow water. For this purpose it is more convenient to consider cumulative distribution func-tions (cdf). For Weibull distribufunc-tions it has the following form
FW(H, σ, q)=1−exp
−
H
σ
q
. (3)
The Glukhovsky cdf is described by the following expression (Glukhovsky, 1966)
FG H,H, h¯
=1−exp
−
π
41+√H¯
2π h
H
¯ H
2
1− ¯H / h
,
(4) whereH¯ is the mean wave height andhis the water depth. Comparing Eqs. (3) and (4) we find a connection between pa-rameterσ andq in Eq. (3) and characteristics of wave field:
0 0.1 0.2 0.3 0.4 0.5 0.6 0.7
0 1 2 3 4 5 6 p d f, m -1
Wave height, m
a
0 0.1 0.2 0.3 0.4 0.5 0.6 0.7
0 1 2 3 4 5 6 p d f, m -1
Wave height, m
b
0 0.1 0.2 0.3 0.4 0.5
0 1 2 3 4 5 6
Wave height, m
c H
Fig. 5. Averaged distribution of wave heights within the wave wake of (a) Star, (b) SuperStar and (c) Viking XPRS; red dashed line corre-sponds to the fitted Rayleigh distribution with corresponding parameterσ(a) 0.12 m, (b) 0.13 m, (c) 0.11 m; black solid line corresponds to the fitted Weibull distribution with corresponding parameters (σ,q)(a) (0.15 m, 1.45), (b) (0.16 m, 1.52), (c) (0.15 m, 1.71) fitted using the maximum likelihood estimate.
q= 2
1− ¯H / h, σ= ¯H 4 π+
2
π
3/2H¯
h
!1− ¯H / h2
. (5)
Taking into account the water depth at the location of con-ducted measurements (h=2.7 m) and applying the mean wave height (H¯ =0.14 m), parameters of the Weibull dis-tribution can be estimated asσ≈0.16 m andq≈2.1, which are close to the values calculated from the original data.
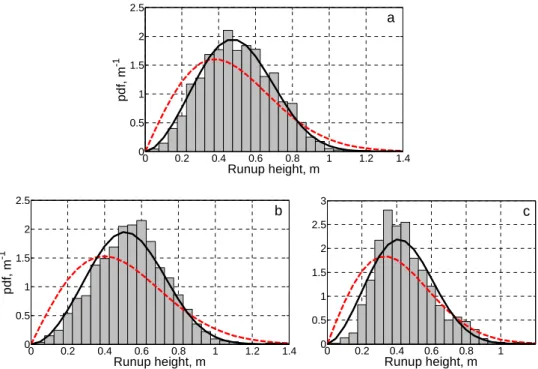
The averaged distributions of corresponding run-up heights on a beach, caused by a single wave wake are shown in Figs. 6 and 7 for overall run-up distribution and with re-spect to vessels of different types. Similar to wave heights, these distributions can also be approximated by Rayleigh and Weibull pdfs, which are marked by the corresponding lines in Figs. 6 and 7, and it can be seen that the Weibull distribu-tion works quite well even for descripdistribu-tion of run-up heights. However, the shape parameters are more diversed for run-up heights. For the Rayleigh distribution,σ=0.38 m for over-all distribution and for Star, 0.40 m for SuperStar and 0.33 m for Viking XPRS vessels. Similar to wave heights, scale pa-rameter in Weibull distribution for run-ups is slightly larger than the one for the Rayleigh pdf:σ=0.56 m for overall dis-tribution and for Star, 0.59 m for SuperStar and 0.49 m for Viking XPRS vessels. The shape parameterq=2.77 for
over-
0 0.2 0.4 0.6 0.8 1 1.2 1.4 0 0.5 1 1.5 2 2.5
Runup height, m
p d f, m -1
Fig. 6. Averaged distribution of run-up heights within the wave wake; red dashed line corresponds to the Rayleigh distribution (σ=0.38 m), black solid line corresponds to the Weibull distribu-tion (σ=0.56 m,q=2.77) fitted using the maximum likelihood estimate.
all distribution, 2.75 for Star, 2.93 for SuperStar and 2.70 for Viking XPRS vessels.
Knowing parameters of distributions, we can calculate the corresponding mean wave and run-up heights straight from the distribution: ¯ H= ∞ Z 0
Hf (H ) dH , (6)
0 0.2 0.4 0.6 0.8 1 1.2 1.4
0 0.5 1 1.5 2 2.5
Runup height, m
p
d
f,
m
-1
a
0 0.2 0.4 0.6 0.8 1 1.2 1.4
0 0.5 1 1.5 2 2.5
Runup height, m
p
d
f,
m
-1
b
0 0.2 0.4 0.6 0.8 1
0 0.5 1 1.5 2 2.5 3
Runup height, m
c
Fig. 7. Averaged distribution of run-up heights within the wave wake of (a) Star, (b) SuperStar and (c) Viking XPRS; red dashed line corresponds to the Rayleigh distribution with corresponding parametersσ (a) 0.38 m, (b) 0.40 m, (c) 0.33 m; black solid line corresponds to the Weibull distribution with corresponding parameters (σ,q)(a) (0.56 m, 2.75), (b) (0.59 m, 2.93), (c) (0.49 m, 2.70) fitted using the maximum likelihood estimate.
0.13 0.14 0.15 0.16 0.17
0.4 0.45 0.5 0.55
Wave height, m
Runup height
, m
Fig. 8. Mean run-up and wave height in the wake, calculated from the original data (red squares) and reconstructed from Rayleigh (blue circles) and Weibull (black triangles) distributions; blue solid and black dashed lines correspond to the regression curve fitted heights calculated from the Rayleigh and Weibull distributions, re-spectively.
and consider an average wave amplification on a beach. The calculated values of mean wave and run-up heights, calcu-lated from the original data and reconstructed from the ob-tained Rayleigh and Weibull distributions for overall statis-tics and for each vessel separately are presented in Fig. 8.
It is remarkable that original values of mean wave and run-up heights and those reconstructed from the Weibull
distri-bution are so close to each other that they practically coin-cide, which strongly indicates that Weibull distribution is an appropriate model for description of waves within a vessel wake. The heights reconstructed from Rayleigh distributions underestimate run-up observations by 10–20 %. Based on the calculated data, the corresponding regression curves of wave amplification at the coast can be plotted (Fig. 8). Though re-gression lines, based on four points only, are not satisfactory, they can still indicate some trend. In the case of the Rayleigh and Weibull distributions they can be described by the fol-lowing expressions
¯
R=3.1H,¯ (7)
¯
R=3.5H.¯ (8)
As it has been noticed before, the Rayleigh approximation gives smaller amplification at the coast and underestimates run-up heights.
For comparison, we estimate the amplification of non-breaking sinusoidal waves with a periodT =10 s, which cor-responds to the period of the largest vessel waves, by the shallow water formula for long wave run-up on a plane beach (Didenkulova et al., 2007)
R H =π
s
2L √
ghT ≈6. (9)
0 2 4 6 8 10 12 14 16 18
0 0.2 0.4 0.6 0.8 1
Time, min
W
a
v
e
/r
un
up heigh
ts
,
m a
0 2 4 6 8 10 12
0 0.2 0.4 0.6 0.8 1 1.2
W
a
ve/
ru
nup height
s
, m
Time, min
b
0 1 2 3 4 5 6 7 8 9
0 0.2 0.4 0.6 0.8
Time, min
c
Fig. 9. Wave heights (blue circles) and corresponding run-up heights (red triangles) within the wake from (a) SuperStar (19 June 2009), (b) Star (20 June 2009) and (c) Viking XPRS (21 June 2009).
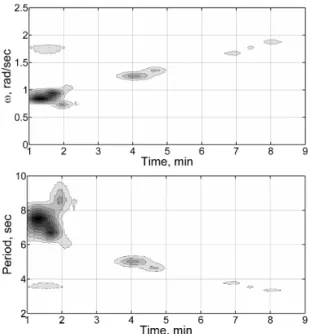
Fig. 10. Time-frequency spectrum for SuperStar (19 June 2009).
HereLis the distance to the shore (in our caseL=100 m), gis the gravity acceleration and his the water depth (h= 2.7 m).
Thus, averaged amplification of vessel waves is almost twice as smaller than the one predicted by Eq. (9). This can be explained by strong dissipation during wave breaking, as very often vessel wakes break before reaching the coast (see Fig. 2).
4 Run-up of individual waves in the vessel wake
In order to better understand the details of individual wave run-up within the wake, we consider the run-up of three pack-ets corresponding to three different types of vessels. As it has been mentioned before, the time at the echo sounder and at video recording was synchronized, making possible to iden-tify the run-up of most of waves in the wake, except waves of very small amplitude (<10 cm at the echo sounder record).
For this analysis we select a wave wake from SuperStar, which occurred on 19 June 2009 at 19:15; from Star, curred on 20 June 2009 at 12:10; and from Viking XPRS, oc-curred on 21 June 2009 at 13:50. Corresponding wave and run-up heights for all of them are shown in Fig. 9.
It can be concluded from Fig. 9 that there is a fairly good correlation between wave and run-up data. Increase in the wave height generally corresponds to the increase in the run-up height. However, the maximum run-run-up in the wake does not always correspond to the maximum wave height. This is clearly seen in Fig. 9b and c, where the absolute maximum wave heights are not so pronounced as in Fig. 9a and are just slightly larger than for other waves.
At the same time Fig. 9a, with an outstanding peak for the highest wave, demonstrates numerous waves of much smaller height, which result in almost the same (just slightly smaller) run-up. This can be partially explained by different periods of wake waves, which is reflected in the time-frequency spectrum in Fig. 10.
The approach of three different groups with different peri-ods is clearly seen in Fig. 10. The first group of waves, with peak period at 8 s, appears at the time moment of 1 min.
0 0.1 0.2 0.3 0.4 0.5 0.6 0.7 0.8 0.9 0
2 4 6 8
A
m
p
lif
ic
at
ion
Wave height, m
a
0 0.1 0.2 0.3 0.4 0.5 0.6 0.7 0
2 4 6 8
A
m
p
lif
ic
at
ion
Wave height, m
b
0 0.1 0.2 0.3 0.4 0
2 4 6 8
A
m
pl
if
ic
a
tion
Wave height, m c
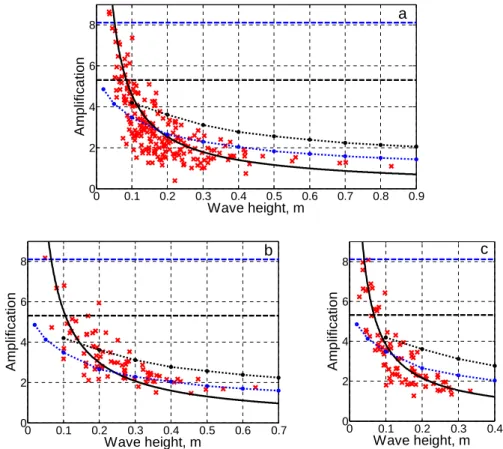
Fig. 11. Wave amplification on the beach plotted against wave height for wake waves from (a) SuperStar (19 June 2009), (b) Star (20 June 2009) and (c) Viking XPRS (21 June 2009). Dashed lines correspond to Eq. (9) and dotted lines correspond to calculation of breaking run-up with the characteristic period of 6 (blue) and 14 s (black). Black solid line corresponds to the power approximation described by Eq. (10).
Then, 3 min after, the second group with peak period at 5 s approaches. And finally, after 3 more minutes, the third group of waves with 4 s periods comes.
So, the structure of the wave packet is such that waves of longer period come first. At the same time the run-up height increases with decrease in the wave period (see Eq. 9) and this may explain why waves of the second group, which have smaller periods than the largest waves of the first group, pro-duce the same run-up (see, time interval 4–8 min in Fig. 9a). This effect may also be a key to the understanding of rapid beach erosion caused by fast-vessel wakes. The group struc-ture of the wake works so that waves with the largest run-up heights come one after another resulting in the anomalous impact on the coast.
Another factor, which influences run-up height, is wave breaking, which affects waves of large amplitudes reducing their run-up. Observations show that very often the largest vessel induced waves break before they reach the coast (see, Fig. 2). Waves of larger amplitude break farther from the coast and dissipate stronger than smaller amplitude waves. This can be seen in Fig. 11 for wave amplification at the coast (R/H), where waves of smaller amplitude amplify stronger than the larger ones. For comparison, blue and black dashed horizontal lines correspond to the non-breaking
run-up on a plane beach (Eq. 9), calculated for waves with peri-ods of 6 and 14 s. It can be seen that some smaller (probably, non-breaking) waves with wave heights<20 cm may have the same amplification, but the majority of wake waves lie below this threshold.
The dotted lines in Fig. 11 represent the result of nu-merical simulation of wave amplification along a Pikakari beach profile. The numerical simulation is performed us-ing the CLAWPACK (Conservation Laws Package) pack-age (LeVeque, 2004), which models shallow water equations in the form of laws of conservation and allows formation and propagation of breaking waves parameterized by the shock waves. The propagation of such waves along a flat bottom is described in Pelinovsky and Rodin (2011); and Di-denkulova et al. (2011). The calculated amplification curve decreases with an increase in the wave height, which is in a good agreement with the behavior of the experimental data. Waves of larger amplitude, which are more subject of wave breaking, are closer to the “breaking” curve, while smaller-amplitude waves are closer to the “non-breaking” line, what corresponds to our expectations.
The data from all three vessels in Fig. 11 can be very well described using the power regression curve (see, solid line in
Figs. 11) R H =aH
−b, (10)
where the power coefficient varies within 0.75≤b≤0.95 depending on the type of the vessel and dimensional co-efficient changes within the range 0.4≤a≤1.0. Obtained experimentally, Eq. (10) can be used for estimates of run-up heights from vessel generated waves.
5 Conclusions
The anomalous impact of waves from high-speed vessels on coasts is considered with respect to their specific group struc-ture. The intensive vessel-induced waves and their run-ups are studied experimentally at the Pikakari beach in Tallinn Bay, the Baltic Sea, in summer 2009. In total, 66 wave wakes were recorded and 86 run-ups were measured from three dif-ferent high-speed vessels: Star, SuperStar and Viking XPRS. It is shown that Weibull distribution can be a good model describing the distribution of wave heights in a single wake and corresponding run-up heights. This works for the over-all distribution, as for wakes from different vessels. Both parameters of the Weibull distribution for wave heights can also be estimated from the Glukhovsky distribution for wind waves in shallow or intermediate water (Glukhovsky, 1966) and these estimates are in a good agreement with measured data. The mean wave and run-up heights, reconstructed from the Weibull distributions, demonstrate a great coincidence with the measurements. There is also a correspondence be-tween mean wave and run-up heights showing that increase in one results in the increases in the other. It is found that, on average, vessel wave heights are amplified 3.5 times during 100 m of propagation to the coast.
The run-up of three particular wake waves, which cor-respond to three different vessels, is studied in detail. It is demonstrated that group structure of the wake, where the largest and the longest waves come first and waves of smaller amplitude and period come after, works so that waves with largest run-up heights come one after another resulting in the anomalous impact on the coast. This effect may be a key to understanding of the rapid beach erosion caused by fast ves-sel wakes.
Wave amplification varies significantly within a wake. Waves of large amplitude have very little amplification, which is explained by the influence of the wave breaking. At the same time small amplitude (<20 cm) waves amplify significantly at the coast and can be described by the run-up of long non-breaking waves on a plane beach in the shallow water framework. Waves of moderate amplitude represent an intermediate case where wave breaking effects are still im-portant, but they are influenced by wave dispersion and dis-sipation in the near bottom layer. For the description of these waves an empirical formula based on experimental data is provided.
Acknowledgements. This research was partially supported by the Federal Targeted Program “Research and educational per-sonnel of innovation Russia” for 2009-2013, targeted financing by the Estonian Ministry of Education and Research (grant SF0140007s11), Estonian Science Foundation (Grant 8870), grants MK-1440.2012.5 and RFBR-12-05-33087. ID acknowledges the support provided by the Alexander von Humboldt Foundation and AR thanks DoRA 4 program. Authors thank Kevin Parnell and the team of Institute of Cybernetics (Tallinn, Estonia) for their help in organizing the experiment.
Edited by: E. Pelinovsky
Reviewed by: two anonymous referees
References
Brown, E. D., Buchsbaum, S. B., Hall, R. E., Penhune, J. P., Schmitt, K. F., Watson, K. M., and Wyatt, D. C.: Observations of a nonlinear solitary wave packet in the Kelvin wake of a ship, J. Fluid Mech., 204, 263–293, 1989.
Didenkulova, I., Parnell, K. E., Soomere, T., Pelinovsky, E., and Kurennoy, D.: Shoaling and runup of long waves induced by high-speed ferries in Tallinn Bay, J. Coast. Res., Special Issue, 56, 491–495, 2009a.
Didenkulova, I., Pelinovsky, E., and Soomere, T.: Long surface wave dynamics along a convex bottom, J. Geophys. Res. Oceans, 114, C07006, doi:10.1029/2008JC005027, 2009b.
Didenkulova, I., Pelinovsky, E., Soomere, T., and Zahibo, N.: Runup of nonlinear asymmetric waves on a plane beach, in: Tsunami & Nonlinear Waves, edited by: Kundu, A., Springer, 175–190, 2007.
Didenkulova, I., Pelinovsky, E., and Rodin, A.: Nonlinear interac-tion of large-amplitude unidirecinterac-tional waves in shallow water, Eston. J. Eng., 17, 289–300, 2011.
Didenkulova, I. and Soomere, T.: Formation of two-section cross-shore profile under joint influence of random short waves and groups of long waves, Mar. Geol., 289, 29–33, 2011.
Garel, E., Fern´andez, L. L., and Collins, M.: Sediment resuspension events induced by the wake wash of deep-draft vessels, Geo.-Mar. Lett., 28, 205–211, 2008.
Glukhovsky, B. H.: Issledovanie morskogo vetrovogo volnenia (Study of sea wind waves), Leningrad, Gidrometeoizdat, 1966 (in Russian).
Houser, C.: Sediment Resuspension by Vessel-Generated Waves along the Savannah River, Georgia. J. Waterway, Port, Coastal Ocean Eng., 137, 246–257, 2011.
Kurennoy, D., Soomere, T., and Parnell, K. E.: Variability in the properties of wakes generated by high-speed ferries, J. Coast. Res. Special Issue 56, 519–523, 2009.
Kurennoy, D., Parnell, K. E., and Soomere, T.: Fast-ferry generated waves in south-west Tallinn Bay, J. Coast. Res., Special Issue 64, 165–169, 2011.
LeVeque, R. J.: Finite-volume methods for hyperbolic problems, Cambridge Univ. Press, 2004.
Neuman, D. G., Tapio, E., Haggard, D., Laws, K. E., and Bland, R. W.: Observation of long waves generated by ferries, Canadian J. Remote Sens., 27, 361–370, 2001.
Parnell, K. E. and Kofoed-Hansen, H.: Wakes from large high-speed ferries in confined coastal waters: Management approaches with
examples from New Zealand and Denmark, Coast. Manag., 29, 217–237, 2001.
Parnell, K. E., McDonald, S. C., and Burke, A. E.: Shoreline effects of vessel wakes, Marlborough Sounds, New Zealand. J. Coast. Res., Special Issue 50, 502–506, 2007.
Parnell, K. E., Delpeche, N., Didenkulova, I., Dolphin, T., Erm, A., Kask, A., Kelpˇsaite, L., Kurennoy, D., Quak, E., R¨a¨amet, A., Soomere, T., Terentjeva, A., Torsvik, T., and Zaitseva-P¨arnaste, I.: Far-field vessel wakes in Tallinn Bay, Estonian J. Eng., 14, 273–302, 2008.
Pelinovsky, E. N. and Rodin, A. A.: Nonlinear deformation of a large-amplitude wave on shallow water, Doklady Phys., 56, 305– 308, 2011.
Rapaglia, J., Zaggia, L., Ricklefs, K., Gelinas, M., and Boku-niewicz, H.: Characteristics of ships’ depression waves and as-sociated sediment resuspension in Venice Lagoon, Italy, J. Mar. Syst., 85, 45–56, 2011.
Soomere, T.: Fast ferry traffic as a qualitatively new forcing factor of environmental processes in non-tidal sea areas: a case study in Tallinn Bay, Baltic Sea, Environ. Fluid Mech., 5, 293–323, 2005a.
Soomere, T.: Wind wave statistics in Tallinn Bay, Boreal Environ. Res., 10, 103–118, 2005b.
Soomere, T.: Nonlinear components of ship wake waves, Appl. Mech. Rev., 60, 120–138, 2007.
Soomere, T., Parnell, K. E., and Didenkulova, I.: Implications of fast ferry wakes for semi-sheltered beaches: a case study at Aegna Is-land, Baltic Sea. J. Coast. Res., Special Issue 56, 128–132, 2009. Soomere, T., Parnell, K. E., and Didenkulova, I. Water transport in wake waves from high-speed vessels, J. Mar. Syst., 88, 74–81, 2011.
Torsvik, T., Didenkulova, I., Soomere, T., and Parnell, K. E.: Vari-ability in spatial patterns of long nonlinear waves from fast fer-ries in Tallinn Bay, Nonlin. Processes Geophys., 16, 351–363, doi:10.5194/npg-16-351-2009, 2009.