Differential Ratios of Omega Fatty Acids (AA/
EPA+DHA) Modulate Growth, Lipid
Peroxidation and Expression of Tumor
Regulatory MARBPs in Breast Cancer Cell
Lines MCF7 and MDA-MB-231
Prakash P. Mansara1, Rashmi A. Deshpande1, Milind M. Vaidya2, Ruchika Kaul-Ghanekar1*
1Cell and Translational Research Lab, Interactive Research School for Health Affairs (IRSHA), Bharati Vidyapeeth University Medical College Campus, Dhankawadi, Pune, 411043, India,2Advanced Centre for Treatment, Research & Education in Cancer (ACTREC), Tata Memorial Centre, Kharghar, Navi Mumbai, 410210, India
Abstract
Omega 3 (n3) and Omega 6 (n6) polyunsaturated fatty acids (PUFAs) have been reported to exhibit opposing roles in cancer progression. Our objective was to determine whether dif-ferent ratios of n6/n3 (AA/EPA+DHA) FAs could modulate the cell viability, lipid peroxida-tion, total cellular fatty acid composition and expression of tumor regulatory Matrix Attachment Region binding proteins (MARBPs) in breast cancer cell lines and in non-cancerous, MCF10A cells. Low ratios of n6/n3 (1:2.5, 1:4, 1:5, 1:10) FA decreased the via-bility and growth of MDA-MB-231 and MCF7 significantly compared to the non-cancerous cells (MCF10A). Contrarily, higher n6/n3 FA (2.5:1, 4:1, 5:1, 10:1) decreased the survival of both the cancerous and non-cancerous cell types. Lower ratios of n6/n3 selectively induced LPO in the breast cancer cells whereas the higher ratios induced in both cancerous and non-cancerous cell types. Interestingly, compared to higher n6/n3 FA ratios, lower ratios increased the expression of tumor suppressor MARBP, SMAR1 and decreased the expres-sion of tumor activator Cux/CDP in both breast cancer and non-cancerous, MCF10A cells. Low n6/n3 FAs significantly increased SMAR1 expression which resulted into activation of
p21WAF1/CIP1in 231 and MCF7, the increase being ratio dependent in
MDA-MB-231. These results suggest that increased intake of n3 fatty acids in our diet could help both in the prevention as well as management of breast cancer.
a11111
OPEN ACCESS
Citation:Mansara PP, Deshpande RA, Vaidya MM, Kaul-Ghanekar R (2015) Differential Ratios of Omega Fatty Acids (AA/EPA+DHA) Modulate Growth, Lipid Peroxidation and Expression of Tumor Regulatory MARBPs in Breast Cancer Cell Lines MCF7 and MDA-MB-231. PLoS ONE 10(9): e0136542. doi:10.1371/journal.pone.0136542
Editor:Clarissa Menezes Maya-Monteiro, Fundação Oswaldo Cruz, BRAZIL
Received:January 12, 2015
Accepted:August 5, 2015
Published:September 1, 2015
Copyright:© 2015 Mansara et al. This is an open access article distributed under the terms of the
Creative Commons Attribution License, which permits unrestricted use, distribution, and reproduction in any medium, provided the original author and source are credited.
Data Availability Statement:All relevant data are within the paper and its Supporting Information files.
Funding:This work was supported by Department of Biotechnology, Government of India, Grant Number: BT/PR-11868/FNS/20/402/2009. The funders had no role in study design, data collection and analysis, decision to publish, or preparation of the manuscript.
Introduction
Breast cancer is the most common malignancy and one of the leading cause of cancer-related deaths in women worldwide [1,2]. Several factors have shown promise in reducing breast can-cer incidence rates wherein change in lifestyle, especially diet, has proven to be the most popu-lar measure. The role of nutrition in the prevention of cancer has been well established and it has been shown to suppress the transformative, hyper-proliferative and inflammatory pro-cesses that initiate carcinogenesis [3].
During the past few years, there has been a wealth of information regarding the role of long chain polyunsaturated fatty acids (LCPUFAs) in health and disease [4–7]. n3 FA such as ALA
(Alpha-linolenic acid) [8], EPA (Eicosapentaenoic acid) [9] and DHA (Docosahexaenoic acid) [10] have been reported to exhibit anti-cancer activity whereas n6 PUFAs such as linoleic acid (LA) and arachidonic acid (AA)[11–13] have been reported to contribute towards the
develop-ment of cancer. EPA and DHA are essential fatty acids, which human body cannot synthesize and thus should be obtained from diet. AA, EPA and DHA occur in the diet in animal tissue lipids [14]. Fish oil is highly rich in EPA and DHA, and has been suggested for different popu-lations due to health benefits [15]. EPA and DHA together have been recommended in various conditions such as coronary, CVD, CHD, Alzheimer, postpartum depression and bipolar depression, rheumatoid arthritis, pregnancy, lactation and infancy and even cancer [15]. In our recent study, we found that supplementation of fish oil capsules, containing EPA:DHA in the ratio of 1.5:1, in breast cancer patients undergoing chemotherapy, significantly improved their serum antioxidant levels as well as quality of life parameters [16].
Various mechanisms have been proposed for the anti-proliferative effect of n-3 PUFAs [17]. These include alterations in eicosanoid formation [18], lipid peroxidation initiated by free radi-cals [8,19], accumulation of cytotoxic lipid droplets [20], and specific changes in gene expres-sion patterns [8,17]. Recently, we have reported that ALA regulated the growth of breast and cervical cancer cells through decrease in NO generation and increase in LPO, leading to caspase 3-dependent apoptosis [8]. The activity of several nuclear transcription factors, like peroxisome proliferator-activated receptors (PPARα/δ/γ), liver X receptors (LXRα/β), and sterol regulatory element-binding proteins (SREBP1/2), has been shown to be regulated by dietary PUFAs and their metabolites [21–23]. Moreover, tumor suppressor proteins such as p53 [24,25], BRCA1
[26], BRCA2 [26], syndecan-1 (SDC-1) [22] as well as PTEN [27] have also been reported to be upregulated in cells challenged with n3 fatty acids.
cell cycle regulatory protein p21WAF1/CIP1was modulated in MDA-MB-231 and MCF7 cells treated with different n6/n3 FA ratios. This is the only study in vitro showing the effect of high and low ratios of n6/n3 FAs on cellular mechanisms in cancerous and non-cancerous cells.
Materials and Methods
Materials
Tissue culture plastic ware was purchased from BD Bio-sciences (CA, USA). Dulbecco's Modi-fied Eagles Medium (DMEM), penicillin and streptomycin were obtained from Gibco BRL (CA, USA). Fetal bovine serum (FBS) was purchased from SAF (USA). Bovine serum albumin (BSA) fatty acid free, 3-(4,5-Dimethylthiazol-2-yl)-2,5-diphenyl tetrazolium bromide (MTT), Epidermal Growth Factor(EGF), Insulin, Hydrocortisone and the other reagents were obtained from Sigma-Aldrich (St. Louis, MO, USA). EPA was purchased from MERCK whereas DHA and AA were purchased from Cayman.α-Tubulin, p21WAF1/CIP1and Cux/CDP antibodies were obtained from Santa Cruz Biotechnology Inc.(CA, USA). SMAR1 antibody was pur-chased from Bethyl laboratories, Montgomery, USA. All other common reagents were pro-cured from Qualigens Fine chemicals and Himedia (Mumbai, India).
Cell culture
The human breast adenocarcinoma (MCF7 and MDA-MB-231) cell lines used in the study were obtained from National Centre for Cell Science (NCCS), Pune, India. The cells were grown in DMEM containing 2 mM L-glutamine supplemented with 10% fetal bovine serum (FBS), 20 U/ml penicillin and 20μg/ml streptomycin [8]. Immortalized non-tumourigenic human breast epithelial cells, MCF10A was cultured under standard conditions in 1/1 (v/v) mixture of DMEM and Ham’s F12 medium (DMEM/F12) containing 2 mM L-glutamine, 10%
FBS, 20 U/ml penicillin, 20μg/ml streptomycin, 10μg/ml insulin, 20 ng/ml EGF and 0.5 mg/ ml hydrocortisone [38]. The cells were incubated in a humidified 5% CO2incubator at 37°C.
Conjugation of BSA with Omega Fatty Acids
Eicosapentaenoic acid (EPA), Docosahexanoic acid (DHA) and Arachidonic acid (AA) were dissolved in absolute ethanol and stored at -20°C. The fatty acids were conjugated with delipi-dated, endotoxin-free serum albumin (3mM) to give a concentration of 10 mM stock with a ratio of fatty acids to BSA as 3/1 [8,39]. The conjugated omega fatty acids were incubated at 37°C for 30 min in CO2incubator and stored at -20°C and before use; they were diluted to the required concentration with 10% DMEM.
Cell viability study by MTT dye reduction assay
The cell viability was determined by MTT assay in breast cancer cell lines (MCF7 and
MDA-MB-231) in presence of different concentrations of n3 and n6 fatty acids and compared with non-cancerous immortalized MCF10A cell lines. The cells were seeded at a density of 2×10⁴cells/well density in 96-well plates and grown for 24 h. The cells were treated with differ-ent ratios (1/1, 2.5/1, 4/1, 50 and 10/1) of n3 (EPA and DHA) and n6 (AA) fatty acids.Table 1 shows the various ratios of fatty acids that were used in the experiment. After 24h, media was removed, MTT solution (5 mg/ml) was added to each well and the cells were cultured for another 4 h at 37°C in 5% CO2incubator. The formazan crystals formed were dissolved in 90μl of SDS-DMF (20% SDS in 50% DMF)[40]. After 15 min, the amount of colored formazan derivative was determined by measuring optical density (OD) at 570 nm (OD 570–630 nm)
Cell growth analysis
The assay was performed as described previously [22]. Briefly, MCF7, MDA-MB-231 and MCF10A cells were seeded at a density of 2×10⁴cells/well in 24-well plates in triplicates. Next day, the cells were treated with different concentrations of n3 and n6 FA ratios for 24 h as shown inTable 2. The cells were harvested and counted for viability using trypan blue dye exclusion method.
Lipid peroxidation assay
All the cells were seeded at density 2×10⁴cells/well in a black 96-well plate and incubated at 37°C in CO2incubator. Next day, the cells were treated with various n3 and n6 FA ratios and incubated in CO2incubator at 37°C for 24 h. The following day, the medium was removed and the cells were washed with 1X PBS and incubated with fluorescent indicator, cis-parinaric acid (CPNA) (Invitrogen) as described previously [41]. Briefly, the cells were incubated with 10μM cis-parinaric acid and incubated for 60 min at 37°C in dark. 20μM tert-butyl hydroperoxide (TBHP) was kept as a positive control and was incubated with CPNA dye. After incubation, cells were washed twice with 1X PBS. 100μl 1X PBS was added to each well, and the fluores-cence readings were immediately taken on FLUOstar Omega-Multi-mode micro plate reader (BMG LABTECH) with maximum excitation and emission wave length of 320 nm and 420 nm, respectively. Decreased fluorescence reflects increased lipid peroxidation.
Cellular fatty acid analysis
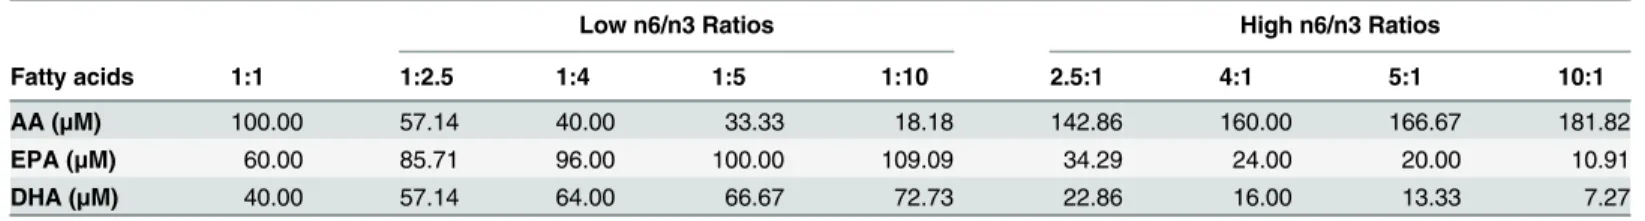
Breast cancer cell lines were plated at 8×10⁵cells/well density in 6 well plates and were incu-bated in 10% DMEM supplemented with n3 and n6 fatty acids for 24 h. The procedure for fatty acid analysis used in our study was adapted from the Manku et al [42]. Trans-esterifica-tion of total cellular lipid fracTrans-esterifica-tions was carried out with hydrochloric acid-methanol using a Perkin Elmer gas 118 chromatograph (SP 2330, 30m capillary column, Supelco, PA, USA). Briefly, cell pellets were dissolved in 500μL 1X PBS and mixed with 4 ml of Methanol/HCl/ BHT (94.7/5.3/0.0005, v/v/w) in a 15-ml screw cap vial. The vials were sealed and incubated at 80°C for 2 h and then cooled on ice for 30 min. The total methylated fatty acids were extracted by adding 2 ml hexane (2N), and the layers were separated by centrifugation in a swinging Table 1. Concentrations of n6 (AA) and n3 (EPA, DHA) fatty acids used in different ratios at 200μM total fatty acid concentration.
Low n6/n3 Ratios High n6/n3 Ratios
Fatty acids 1:1 1:2.5 1:4 1:5 1:10 2.5:1 4:1 5:1 10:1
AA (μM) 100.00 57.14 40.00 33.33 18.18 142.86 160.00 166.67 181.82
EPA (μM) 60.00 85.71 96.00 100.00 109.09 34.29 24.00 20.00 10.91
DHA (μM) 40.00 57.14 64.00 66.67 72.73 22.86 16.00 13.33 7.27
doi:10.1371/journal.pone.0136542.t001
Table 2. Concentrations of n6 (AA) and n3 (EPA, DHA) fatty acids used in different ratios at 280μM total fatty acid concentration.
Low n6/n3 Ratios High n6/n3 Ratios
Fatty acids 1:1 1:2.5 1:4 1:5 1:10 2.5:1 4:1 5:1 10:1
AA (μM) 140.00 80.00 56.00 46.67 25.45 200.00 224.00 233.33 254.55
EPA (μM) 84.00 120.00 134.40 140.00 152.73 48.00 33.60 28.00 15.27
DHA (μM) 56.00 80.00 89.60 93.33 101.82 32.00 22.40 18.67 10.18
rotor at 3000 rpm for 15 min at room temperature. The hexane layers were carefully removed and collected in a separate vial. The hexane extract was completely dried by passing argon gas and stored at -20°C until analyzed. The methylated fatty acids were re-suspended in 100μL of chloroform, and 1μL was injected in GC column. Helium was used as carrier gas at 1 ml/min. Oven temperature was held at 150°C for 10 min, programmed to rise from 150 to 220°C at10°C/min, and at 220°C for 10 min. The detector temperature was 275°C, and the injector temperature was 240°C. The column was calibrated by injecting the standard fatty acid mixture in approximately equal proportion. The data was recorded and the peaks were identified as per the retention time of the standard fatty acids (Sigma, USA) run under the identical conditions. Individual fatty acids were expressed as a relative percentage of total analyzed fatty acids.
Western blotting
Total cellular protein isolation and western blotting were performed as previously described by Wani et al [40]. Cell extracts were prepared from control (untreated) as well as cells treated with different n3 and n6 ratios (1/1, 2.5/1, 4/1, 5/1 and 10/1). Briefly, the cell pellet was resuspended in 50μl lysis buffer containing 50 mM Tris (pH 7.4), 5 mM EDTA, 0.5% NP40, 50 mM NaF, 1 mM DTT, 0.1 mM PMSF, 0.5μg/ml leupeptin, 1μg/ml pepstatin, 150 mM NaCl, 0.5μg/ml apro-tinin and protease inhibitor cocktail and incubated on ice for 1 h with intermittent mixing. The protein extract was centrifuged for 20 min at 4°C at 12,000 rpm. The protein was estimated by using Bradford reagent (Biorad Laboratories Inc, CA, USA). Equal amount of protein was loaded onto a 10% SDS-polyacrylamide gel and transferred to Amersham Hybond-P PVDF membrane (GE Healthcare, UK). The membrane was blocked in 10% BSA in Tris-buffered saline containing 0.1% Tween-20 (TBST) and incubated at room temperature for 4 h. Primary antibodies such as mouse monoclonal antibody alpha-tubulin 5286, 1:500 dilution), p21 817, 1:500 dilution); rabbit polyclonal SMAR1 (A300-279A, 1:1000 dilution) and Cux/CDP (sc-13024, 1:1000 dilution) were incubated with the membrane for 4 h. The membrane was washed in TBST and incubated with either donkey anti-mouse IgG-HRP conjugated (for alpha-tubulin, p21) or donkey anti-rabbit IgG-HRP conjugated (for SMAR1 and Cux/CDP). Proteins were visualized using a chemiluminescence kit (Amersham ECL Advance western blotting detection kit, GE Healthcare, UK) and densitometry analysis of X-ray films was performed on ImageJ software (Image Processing and Analysis in Java; NIH, Bethesda, MD, USA).
Data analysis
The data analysis was done by using GraphPad prism 5 (San Diego, USA). The results have been presented as mean±SEM. Data was analyzed by using analysis of variance (ANOVA) test to compare the means. A significant F test was followed by post hoc Turkey’s multiple
compar-ison test. Kruskal–Wallis test was used wherever the homogeneity of variance test failed. For
the comparisons between effect of low and high n6/n3 FAs, data was analyzed by unpaired stu-dent’s t-test. The level of significance used was p<0.05.
Results
Differential ratios of n6 and n3 FA regulated the viability and proliferation
of breast cancer cells
We first analyzed the effect of low and high ratios of n6 and n3 fatty acids (AA/EPA+DHA) on the regulation of viability and growth of breast cancer cell lines, MDA-MB-231 and MCF7.
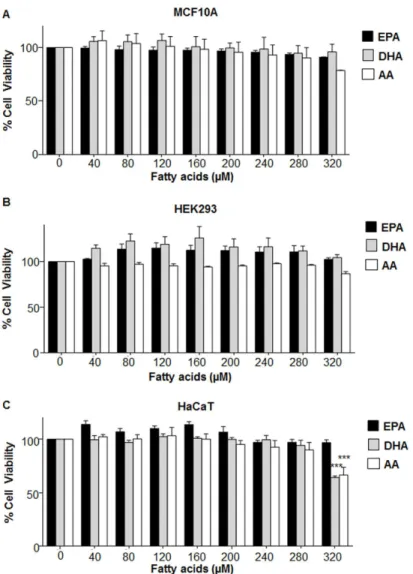
was found that upto 280μM concentration, the individual fatty acids (EPA, DHA and AA) were almost non-toxic to MCF10A, HEK 293 and HaCaT (Fig 1); as well as MDA-MB-231 and MCF7 (Fig 2).
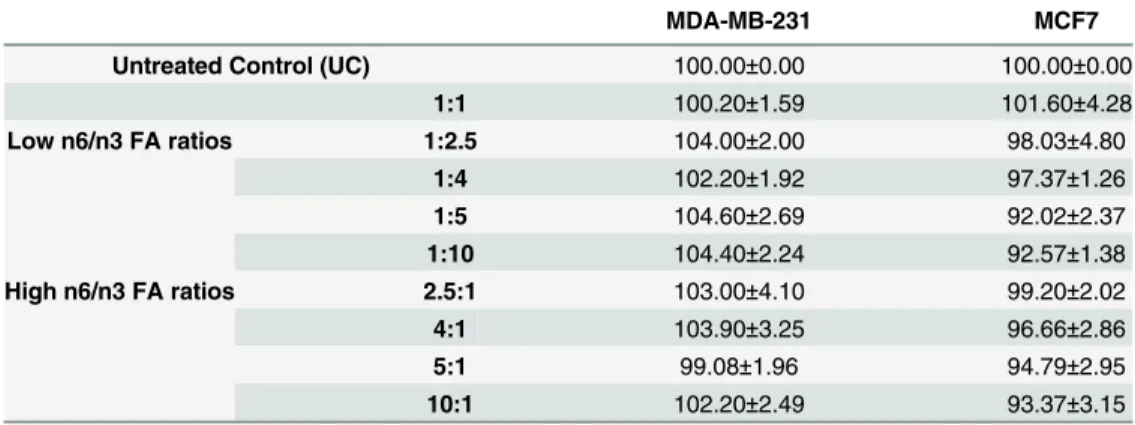
To determine the effective ratios of AA/EPA+DHA that would decrease cell viability, we tested two different concentration, 200 and 280μM, of total fatty acids wherein the ratio of n6 (AA) and n3 (EPA and DHA) FAs that was used has been mentioned in Tables1and2, respec-tively. We initially kept the total FA concentration (of each n6/n3 ratio) at 200μM (Table 1) and treated the cells with different ratios. After performing MTT assay, we didn’t find any
effect on cell viability of MDA-MB231 and MCF7 (Table 3). So, we increased the total FA con-centration to 280μM (Table 2), which was found to affect the cell viability of breast cancer cells significantly (Fig 3) and thus further experiments were performed with 280μM concentrations of total FAs. In the experiments, EPA:DHA was maintained at 1.5:1 ratio based on the compo-sition of standard commercial fish oil supplements [15] as well as our recent report[16].
It was observed that at equal ratio (1:1) of n6/n3 fatty acids, MDA-MB-231, MCF7 and MCF10A showed upto 84, 80 and 92% survival (p<0.05) compared to the untreated control (UC) cells, respectively (Fig 3). However, with decreasing n6/n3 FA ratios, a significant ratio-dependent decrease in cell survival of only breast cancer cell lines (MDA-MB-231 and MCF7) (Fig 3A and 3B) was observed, with almost no reduction in cell viability of MCF10A (p<0.05) (Fig 3C). It was observed that compared to equal ratio (1:1) of n6/n3, 1:10 ratio showed significant decrease in the viability of breast cancer cells, MDA-MB-231 (p<0.001) and MCF7 (p<0.01). On the other hand, with increasing ratios of n6/n3fatty acids, a ratio-dependent decrease in the cell survival was observed not only in the breast cancer (Fig 3A and 3B) but also in MCF10A (Fig 3C). Similar results were obtained in non-cancerous transformed cell lines, HaCaT and HEK293, wherein low n6/n3 did not affect their viability compared to higher ratios (S1 Fig).
Next, we evaluated the effect of different ratios of n6/n3 FAs on the proliferation of both cancerous and non-cancerous cells by trypan blue dye exclusion method. Compared to the untreated control cells, significant reduction in cell growth was observed in all the cell lines after treatment with 1:1 ratio of n6/n3 fatty acids (Fig 4). However, low n6/n3 FA ratios selec-tively reduced the proliferation of only breast cancer cells (Fig 4A and 4B) and not MCF10A (Fig 4C) compared to the untreated control cells. At 1:10 ratio, there was a profound decrease in the proliferation of breast cancer cells (Fig 4A and 4B)(p<0.001). On the other hand, increasing ratios of n6/n3 induced a ratio-dependent decrease in the proliferation of both the breast cancer (Fig 4A and 4B) and non-cancerous cell lines (Fig 4C). Similar results were obtained in HaCaT and HEK293 cells wherein low ratios didn’t affect their proliferation
com-pared to higher ratios (S2 Fig).
Thus, compared to lower ratios of n6/n3, higher ratios decreased the viability and prolifera-tion of both the breast cancer and non-cancerous cell lines.
Varying n6/n3 FA modulated lipid peroxidation in breast cancer cells
It was observed that with low n6/n3 FA, there was a ratio-dependent decrease in cis-parinaric acid fluorescence intensity that is inversely proportional to lipid peroxidation levels [41]. Thus, there was increase in LPO activity in breast cancer cells compared to untreated control cells, the increase being more pronounced in MDA-MB-231 (Fig 5A) compared to MCF7 (Fig 5B). How-ever, there was no lipid peroxidation in MCF10A (Fig 5B). Contrarily, increasing n6/n3 fatty acid ratios induced a significant increase in LPO not only in breast cancer cells (Fig 5A and 5B) but also in MCF10A (Fig 5C) compared to the untreated control cells (p<0.001). Interestingly, 1:1 ratios of n6/n3 didn’t induce any LPO in the treated cell lines. It was interesting to note that
~60% in MDA-MB-231 from 2.5/1 to 10/1 (Fig 5A); ~25% to 29% in MCF7 cells from 2.5/1 to 5/1 and 56% for 10/1 (Fig 5B). Similar trend was observed in HaCaT and HEK293 cells wherein low n6/n3 didn’t induce any LPO in the cells whereas high n6/n3 induced LPO in all the ratios
(S3 Fig). Interestingly, 1:5 and 1:10 ratios of n6/n3 induced significant increase in the LPO in both MDA-MB-231 and MCF7 (p<0.001) (Fig 5A and 5B). Tert-butyl hydroperoxide (TBHP) was used as a positive control in the experiment. Thus, low n6/n3 FA ratios specifically induced LPO in breast cancer cells without affecting the non-cancerous cells.
Omega 3 fatty acids regulated the expression of MAR binding tumor
regulatory proteins
We wanted to evaluate the effect of varying n6/n3 ratios on the expression of MAR binding proteins since they are recently considered as primary diagnostic and/or prognostic markers [43]. We found that in both MDA-MB-231 and MCF7, all the ratios of n3 and n6 FAs Fig 1. Effect of different concentrations of EPA, DHA and AA on viability of non-cancerous
transformed cells.(A) MCF10A, (B) HEK293 and (C) HaCaT cells were exposed to different concentrations (0–320μM) of either EPA, DHA, AA and MTT assay was performed. Data has been presented as mean±SEM of three independent experiments, performed in 96 well plates. Statistical significance was assayed by one-way ANOVA, followed by a Dunnett's test.***p<0.01.
Fig 2. Effect of different concentrations of EPA, DHA and AA on viability of breast cancer cells.(A) MDA-MB-231 and (B) MCF7 cells were treated with different concentration of EPA, DHA and AA for 24 h, followed by cell viability analysis by MTT assay. Data has been presented as mean±SEM of three
independent experiments, each performed in 96 well plates. Statistical significance was assayed using one-way ANOVA, followed by a Dunnett's test.*p<0.05,***p<0.001.
doi:10.1371/journal.pone.0136542.g002
Table 3. Effect of differential ratios of n6 (AA) and n3 (EPA+DHA) fatty acids on breast cancer cell via-bility at 200μM total FA concentration.
MDA-MB-231 MCF7
Untreated Control (UC) 100.00±0.00 100.00±0.00
1:1 100.20±1.59 101.60±4.28
Low n6/n3 FA ratios 1:2.5 104.00±2.00 98.03±4.80
1:4 102.20±1.92 97.37±1.26
1:5 104.60±2.69 92.02±2.37
1:10 104.40±2.24 92.57±1.38
High n6/n3 FA ratios 2.5:1 103.00±4.10 99.20±2.02
4:1 103.90±3.25 96.66±2.86
5:1 99.08±1.96 94.79±2.95
10:1 102.20±2.49 93.37±3.15
significantly increased the expression of tumor suppressor MARBP SMAR1, compared to the untreated control cells (Fig 6A–6D). The expression of SMAR1 was significantly increased in
MDA-MB-231 treated with low n6/n3 ratios (Fig 6A) compared to those treated with high n6/ n3 (Fig 6B) (p<0.05). In MCF7, SMAR1 expression was increased after treatment with low n6/ n3; however with high n6/n3, expression of SMAR1 was not significantly reduced (p = 0.069) (Fig 6C and 6D). Interestingly, there was a significant decrease in the expression of tumor acti-vator MARBP Cux/CDP in low n6/n3 FA ratios in both MDA-MB-231 and MCF7, compared to the untreated control cells (Fig 6A and 6C, respectively) (p<0.05). On the other hand, the higher ratios of n6/n3 (from 4/1 upto 10/1) were found to significantly increase the expression Fig 3. Differential ratios of n6 and n3 fatty acids regulate the viability of breast cancer and non-cancerous cells.Breast cancer cell lines, (A) MDA-MB-231 and (B) MCF7 as well as immortalized non-tumorigenic human breast epithelial, MCF10A cells (C) were treated with low and high n6/n3 ratios and analyzed for cell viability by MTT assay. Data has been presented as mean±SEM of five independent experiments, each conducted in triplicates.ƍp<0.01 and*p<0.001 compared to UC; ¥p<0.01 and¤p<0.001 compared to 1:1;Θp<0.001 compared to 1:2.5; #p<0.05,Λp<0.01 andØp<0.001 compared to 1:4;Up<0.01 andϙp<0.001 compared to 1:5;βp<0.05, ×p<0.01 and ßp<0.001 compared to 1:10;1p<0.01 andΔp<0.001
compared to 2.5:1.
of Cux/CDP in both MDA-MB-231 and MCF7 (Fig 6B and 6D, respectively) compared to the untreated control cells (p<0.05). Among all the tested n6/n3 ratios, 1:10 ratio showed pro-found decrease in Cux/CDP expression in both the breast cancer cell lines.
In MCF10A, compared to the untreated control cells, SMAR1 expression was increased in all the ratios of low n6/n3, the increase being more significant in 1:4, 1:5 and 1:10 ratios (Fig 6E). However, high n6/n3 FAs, particularly, 5:1 and 10:1 ratios, decreased the expression of Fig 4. Various ratios of n6 and n3 regulate the cell proliferation of breast cancer and non-cancerous cell lines.MDA-MB-231(A), MCF7 (B) as well as MCF10A (C) cell lines were treated with low and high n6/n3 ratios for 24h. Next day, the number of viable cells was counted using the trypan blue dye exclusion assay. Data has been presented as mean±SEM of three independent experiments, each conducted in triplicates. ƍp<0.01 and*p<0.001 compared to UC;Ϫp<0.05, ¥p<0.01 and¤p<0.001 compared to 1:1;Φp<0.01 and
Θp<0.001 compared to 1:2.5; #p<0.05,Λp<0.01 andØp<0.001 compared to 1:4; $p<0.05,Up<0.01 and
ϙp<0.001 compared to 1:5;βp<0.05, ×p<0.001 and ßp<0.001 compared to 1:10;ρp<0.05 compared to 2.5:1;
‡p<0.01 compared to 4:1.
SMAR1 significantly (Fig 6F). Surprisingly, 1:1 and 1:2.5 of low n6/n3 showed increase in the expression of Cux/CDP that was later decreased in 1:4, 1:5 and 1:10 n6/n3 ratios (Fig 6E). On the contrary, high n6/n3 increased the expression of Cux/CDP more significantly at 4:1, 5:1 and 10:1 ratios (Fig 6F).
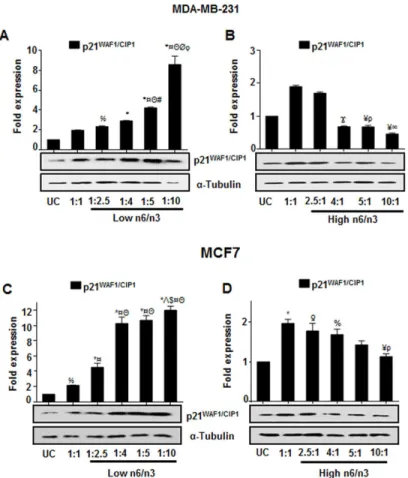
Differential ratios of n6/n3 regulate p21
WAF1/CIP1expression in breast
cancer cells
It was found that there was a significant increase in p21WAF1/CIP1expression in MDA-MB-231 (Fig 7A) and MCF7 (Fig 7C) cells treated with low n6/n3 FAs; the increase being ratio
Fig 5. Different ratios of n6 and n3 regulate the lipid peroxidation in breast cancer and non-cancerous cells.(A) MDA-MB-231, (B) MCF7 and (C) MCF10A cells were treated with low and high n6/n3 ratios for 24h. Next day, lipid peroxidation was analyzed by using cis-parinaric acid and the values have been plotted in terms of percentage fluorescent intensity. Decrease of cis-parinaric acid fluorescence is proportional to increase in lipid peroxidation. Data has been presented as mean±SEM of three independent experiments, each conducted in triplicates.ƍp<0.01 and*p<0.001 compared to UC; ¥p<0.01 and¤p<0.001 compared to 1:1;₭p<0.01,Φp<0.01 andΘp<0.001 compared to 1:2.5; #p<0.05,Λp<0.01 andØp<0.001 compared to 1:4; $p<0.05,Up<0.01 andϙp<0.001 compared to 1:5;βp<0.05, ßp<0.001 as compared to 1:10;1p<0.01 and
Δp<0.001 compared to 2.5:1;‡p<0.01 as compared to 4:1;Ŧp<0.05 compared to 5:1;μp<0.01 compared to 5:1;€p<0.01 compared to 10:1.
dependent in MDA-MB-231. However, expression of p21WAF1/CIP1decreased with increasing ratios of n6/n3 fatty acids (Fig 7Bfor MDA-MB-231 andFig 7Dfor MCF7). Thus activation of SMAR1, by n3 fatty acids, lead to the activation of p21WAF1/CIP1that could regulate the cell growth.
Fig 6. Regulation of MAR binding tumor regulatory proteins by n6/n3 ratios in breast cancer and non-cancerous cells.Expression of SMAR1 and Cux/CDP proteins was analyzed in MDA-MB-231 (A, B); MCF7 (C,D) and MCF10A (E,F). The effect of low (A, C, E) and high (B, D, F) n6/n3 FA ratios has been shown in MDAMB231, MCF7 and MCF10A cell lines, respectively. The bands were quantified by densitometry using ImageJ 1.44p (National Institutes of Health, USA,http://imagej.nih.gov/ij) and have been presented as mean ±SEM of three different experiments.Ώp<0.05, @p<0.01 and*p<0.001 compared to UC;αp<0.05, ¥p<0.01 and¤p<0.001 compared to 1:1;₭p<0.01andΘp<0.001 compared to 1:2.5; #p<0.05 andØp<0.001 compared to 1:4; $p<0.05 compared to 1:5;ρp<0.05,1p<0.01 andΔp<0.001 compared to 2.5:1;‡p<0.01 andΣp<0.001
compared to 4:1,μp<0.01 andπp<0.001 compared to 5:1.
Different n6/n3 FAs induced changes in fatty acid composition of the
breast cancer cells
To detect whether treatment with different ratios of n6 and n3 fatty acids induced any specific changes in the fatty acid composition of the cells, we analyzed the fatty acid profile of the total cell lipid extract of the samples.Fig 8shows the relative fatty acid percentage of EPA, DHA and AA in the lipid fractions of MDA-MB-231 and MCF7 after treatment with different n6/n3 FA.
Both the cell lines showed efficient incorporation of respective fatty acids (EPA, DHA and AA) since supplementation of each fatty acid increased its own level in MDA-MB-231 and MCF7 cells (Fig 8). In MDA-MB-231, compared to untreated control cells, there was an increase in EPA and DHA content in low n6/n3 FA ratios, which decreased with increasing ratios (Fig 8A). Interestingly, there was a reduction of AA in presence of low n6/n3 FA, which increased in higher ratios (Fig 8A) compared to both untreated control cells as well as 1/1 ratio of n6/n3.
Similarly, in MCF7 cells, compared to untreated control cells, there was an increase in EPA and DHA content at low n6/n3 with a concomitant decrease at higher ratios (Fig 8B). An inter-esting observation was that MCF7 cells showed high AA in all the FA ratios compared to the untreated control cells (Fig 8B) as reported earlier [44]. However, compared to 1/1 ratio, with Fig 7. Differential ratios of n6/n3 regulate p21WAF1/CIP1expression in breast cancer cells.Expression of
p21WAF1/CIP1protein was analyzed in MDA-MB-231 (A, B) and MCF7 (C, D) that show the effect of low (A, C)
and high (B, D) n6/n3 FA ratios. The bands were quantified by densitometry using ImageJ 1.44p (National Institutes of Health, USA,http://imagej.nih.gov/ij) and have been presented as mean±SEM of three different experiments. %p<0.05,ƍp<0.01 and*p<0.001 compared to UC;Ϫp<0.05, ¥p<0.01 and¤p<0.001 compared to 1:1;Θp<0.001 compared to 1:2.5; #p<0.05 compared to 1:4;Λp<0.01 compared to 1:4;Øp<0.001as compared to 1:4; $p<0.05 as compared to 1:5;ρp<0.05 and1p<0.01 compared to 2.5:1.
lower n6/n3 ratios, there was a decrease in AA and non-significant increase in higher ratios (Fig 8B). Nevertheless, compared to the untreated control cells, there was a significant increase in AA levels.
We further analyzed the effect of different ratios on the total n6/n3 FA and EPA+DHA/AA ratios in both MDA-MB-231 and MCF7 (Fig 9). In MDA-MB-231, the untreated control cells as well as those treated with 1:1 ratio of n6/n3 showed a high content of total n6/n3 FA (Fig 9A). However, when cells were treated with low ratios of n6/n3, there was a significant decrease in total n6/n3 that remained almost constant in 1:2.5, 1:4 and 1:5 ratios with more decrease at 1:10 ratio (Fig 9A). In MCF7, the untreated control cells didn’t have high total n6/n3 (Fig 9B).
However, at 1:1 ratio, there was a significant increase in total n6/n3 that decreased with lower ratios of n6/n3 (Fig 9B). At higher n6/n3 ratios, there was increase in total n6/n3 in both MDA-MB-231 and MCF7 (Fig 9A and 9B).
In MDA-MB-231, EPA+DHA/AA was found to increase at low n6/n3 compared to untreated control cells or 1:1 ratio, the increase being more at 1:10 (Fig 9A). In MCF7, EPA +DHA/AA was found to increase compared to 1:1 ratio, Interestingly, the untreated control Fig 8. Relative percentage of EPA, DHA and AA in breast cancer cell lines.The cells were treated with different ratios of n6 and n3 FA for 24h. The levels of EPA, DHA and AA has been shown in MDA-MB-231 (A) and MCF7 (B) cells treated with low and high n6/n3 ratios. Each value represents mean±SEM of three independent experiments. %p<0.05,ƍp<0.01 and*p<0.001 compared to UC;Ϫp<0.05, ¥p<0.01 and ¤p<0.001 compared to 1:1;Φp<0.01 andΘp<0.001 compared to 1:2.5; #p<0.05,Λp<0.01 andØp<0.001 compared to 1:4; $p<0.05,Up<0.01 andϙp<0.001 compared to 1:5;βp<0.05, ×p<0.001 and ßp<0.001 compared to 1:10;Δp<0.001 compared to 2.5:1;Σp<0.001 compared to 4:1;μp<0.01 compared to 5:1.
cells had more EPA+DHA/AA that decreased at 1:1 ratio, but retained its original level at 1:5 ratio of low n6/n3, and increased significantly at 1:10 ratio (Fig 9B). At high n6/n3, EPA+DHA/ AA decreased significantly compared to untreated control and 1:1 ratios (Fig 9A and 9B).
Among all the ratios tested, 1:10 ratio of low n6/n3 showed significant increase in EPA and EPA+DHA/AA compared to untreated control and 1:1 ratio in both the breast cancer cell lines. On the other hand, compared to 1:1 ratio of low n6/n3, AA and total n6/n3 were signifi-cantly decreased at 1:10 ratio.
Discussion
Various sources of information suggest that human beings have evolved on a diet with a ratio of omega-6 to omega-3 essential fatty acids (EFA) of 1 [32]. However, nowadays, the ratio has drastically increased due to change in dietary pattern having high propensity towards Fig 9. Relative percentage of total n6/n3 and EPA+DHA/AA ratio in breast cancer cells.The cells were treated with different ratios of n6 and n3 FA for 24h. The levels of total n6/n3 and EPA+DHA/AA has been shown in MDA-MB-231 (A) and MCF7 (B) cells treated with low and high n6/n3 ratios, respectively. Total n6 fatty acids include Linoleic acid (LA) (18:2n6), Gamma-linolenic acid (GLA) (18:3n6), Dihomo-gamma-linolenic acid (DGLA) (20:3n6), Arachidonic acid (AA) (20:4n6); Total n3 fatty acids include ALA (18:3n3), EPA (20:5n3), DHA (22:6n3), DPA(22:5n3). Each value represents mean±SEM of three independent experiments. %p<0.05 and*p<0.001 compared to UC;Ϫp<0.05, ¥p<0.01 and¤p<0.001 compared to 1:1;
₭p<0.01,Φp<0.01 andΘp<0.001 compared to 1:2.5; #p<0.05,Λp<0.01 andØp<0.001 compared to 1:4; $p<0.05,Up<0.01 andϙp<0.001 compared to 1:5;βp<0.05, ×p<0.001 and ßp<0.001 compared to 1:10.
westernized diet that has n6/n3 ratio of 15/1–16.7/1 [45,46]. Thus, in the present study, for the
first time high and low ratios of n6/n3 FAs were used to mimic diets of different populations [32,47] in vitro to evaluate their effect on cellular responses. Equal ratio (1:1) of n6/n3 was chosen to mimic the ancestral diet; 4:1 and 5:1 ratios were chosen to mimic Japanese and Indian rural diet, respectively; 10:1 was chosen to mimic US, UK and European dietary pattern that showed excessive intake (between 15–16) of n6 FAs [32,47]. 1:2.5 ratio of n6/n3 FAs was
chosen based upon previous research in animal models [35,36,48,49]. Moreover, our com-mon diet generally consist of varying levels of n3 and n6 fatty acids, and thus, it becomes essen-tial to systematically analyze the effects of varying ratios of these fatty acids on growth
regulation of breast cancer cells. In the current study, we found that low ratios of n6/n3 fatty acids preferentially killed the breast cancer cells; modulated their lipid peroxidation and criti-cally controlled the expression of tumor regulatory MARBPs.
Low n6/n3 FAs were preferentially cytotoxic to the breast cancer cells and not to the non-cancerous cells. Contrarily, higher ratios affected the viability of all the cell lines similar to that of chemotherapeutic drugs that can not differentiate between normal and cancerous cells. Vari-ous studies have reported that PUFAs such as AA, GLA, EPA and DHA are differentially metabolized by normal and tumor cells as well as drug-sensitive and drug resistant cells [50–
54]. This explains as to how different ratios of n6/n3 exhibited differential effect on cell viability of different cell lines. The normal cells metabolize PUFAs to produce cytoprotective lipids such as lipoxins, resolvins and protectins whereas cancerous cells generate toxic hydroperoxy fatty acids [50,51]. Earlier studies have reported unesterified arachidonic acid as a signal for induc-tion of apoptosis in cells. Exogenous AA has been shown to induce apoptosis in colon cancer and other cell lines including HEK 293 [55]. This could be one of the reasons as to how high n6/n3 ratios could affect the viability and proliferation of all the cell types compared to the lower ratios.
We have previously reported that ALA increased lipid peroxidation in both the breast and cervical cancer cell lines with a simultaneous decrease in cell proliferation [8]. A similar trend was observed in the breast cancer cell types treated with different n6/n3 ratios. The decrease in cell proliferation was found to positively correlate with the increase in lipid peroxidation levels. AA has been reported to generate more thiobarbituric acid-reactive material (TBARM) [56] thereby inducing more cytotoxicity compared to DHA. Interestingly, MCF7 cells (ER/PR posi-tive), showed less lipid peroxidation compared to MDA-MB-231 (ER/PR negaposi-tive), in response to fatty acid treatment. The reason could be that estrogen is known to increase the resistance towards ROS generation [57,58]. Recently, it was shown that supplementation of 1/1 ratio of fish/corn oil in rats, induced with colon cancer, decreased ROS, thioredoxin reductase (TrxR) and apoptosis with a concomitant increase in the antioxidant activity [48] in the initiation phase. The absence of LPO in cells treated with 1/1 ratio of n6/n3 FAs, observed in the current report, could be probably due to generation of antioxidants that neutralized the free radicals. The cytotoxic action of omega 3 fatty acids seems to depend on their ability to increase free radical generation and lipid peroxidation [50,52,59] that damage a variety of enzymes, pro-teins and DNA, thereby, leading to cell death. Thus, a right balance between n6 and n3 fatty acids is highly important in regulating the tumor growth.
AA more in MDA-MB-231 than in MCF7, which has been reported earlier [44]. High fat diet (primarily in the form of n6 PUFAs) has been known to be one of the factors that elevates estrogen (E2) levels and its circulating levels during pregnancy has been reported to increase the risk of developing breast cancer [62].
In the present report, we are for the first time showing that the omega fatty acids modulate the expression of MARBPs such as SMAR1 and Cux/CDP. MARBPs help in attachment of MARs, AT-rich DNA sequences, to the nuclear matrix (NM) resulting into organization of genomic DNA into topologically independent loop domains that are implicated in transcrip-tion, replicatranscrip-tion, repair, recombinatranscrip-tion, demethylation and chromatin accessibility [63,64]. Changes in chromatin structure could modulate gene expression resulting into genomic insta-bility that may lead to cellular transformation and malignant outgrowth. Thus, MARBPs that control chromatin organization play key role in cancer progression. Aberrant expression of MARBPs such as PARP, CUTL1, HMG (I/Y), RUNX1-3, SATB1, SATB2, PcG (polycomb group of proteins), SAFB1/2, SMAR1 etc. has been implicated in several cancers [65–67].
SMAR1, a tumor suppressor MARBP, is down regulated in majority of cancers including breast cancer [64,68] as well as in MCF7 and MDA-MB-231 [69]. Cux/CDP/CUTL1/Cux-1 is another MARBP that is significantly increased in high-grade carcinomas and its expression is inversely correlated with breast cancer survival [70]. Cux/CDP has been shown to enhance tumor cell invasion and migration, besides causing malignancies in several organs and cell types [70,71]. After treatment of the breast cancer cells with the low n6/n3, there was an enhanced expression of SMAR1 with a simultaneous decrease in the expression of Cux/CDP. Interestingly, the endogenous level of Cux/CDP was quite high in untreated control cells that were reduced after treatment with low n6/n3 ratios. The expression of SMAR1 has been reported to be inversely correlated with that of Cux/CDP in breast cancer [64]. It was interest-ing to note that MCF10A cells showed increased expression of SMAR1 when treated with low n6/n3 ratios and decreased expression in presence of high ratios. Moreover, Cux/CDP was decreased in presence of low n6/n3 ratios and increased in higher ratios. Surprisingly, 1:1 and 1:2.5 of low n6/n3 FAs increased the expression of Cux/CDP that was later decreased in cells treated with 1:4, 1:5 and 1:10 n6/n3 ratios (Fig 6E). The up-regulated Cux/CDP expression could be justified by its role in organ development such as brain, limb, lung, kidney, cell differ-entiation, adhesion, motility and invasiveness [72,73]. A recent report has shown that ectopic expression of CDP/Cux in MCF10A cells stimulated cell migration and invasion capacity com-pared to the non-expressing cells [74]. These results suggest that if non-cancerous cells are exposed to higher concentrations of n6 fatty acids, they may tend to acquire cancerous pheno-type through deregulation of tumor marker proteins. Thus, regulation of MARBPs by omega 3 fatty acids could be a potential therapeutic target for regulation of cancer growth.
It is known that SMAR1 activates p53 and induces p21 expression that in turn regulates G1 or G2checkpoints of the cell cycle [63]. In this context, we found that in untreated breast can-cer cells, SMAR1 and p21WAF1/CIP1expressions were highly reduced compared to that of Cux/ CDP. However, low n6/n3 FAs not only induced expression of SMAR1 but also activated cell cycle regulatory protein, p21WAF1/CIP1, which in turn regulated breast cancer growth. Con-trarily, high n6/n3 ratios not only increased CDP/Cux but also decreased SMAR1 and p21WAF1/CIP1expressions, thereby promoting breast cancer growth.
Conclusion
Varying ratios of n6 and n3 fatty acids in the diet can modulate the intrinsic signal transduc-tion mechanisms that in turn can regulate the cell growth. Even though it is quite impossible to revert back to our ancestral diet, however, efforts can be made to reduce the ratio of n6/n3 fatty acids in our diet. By modifying the fatty acid composition of the cells, many aspects of cancer cell metabolism could be regulated. Thus, the risk of cancer would be reduced by restricting the intake of n6 fatty acids in our diet.
Supporting Information
S1 Fig. Differential ratios of n6and n3fatty acids regulate the viability of non-cancerous cells.HaCaT and HEK293 cells were treated with different ratios of n6 (AA) and n3 (EPA +DHA) fatty acids and analyzed for viability by MTT assay. Data has been presented as mean ±SEM of three independent experiments, each conducted in triplicates. %p<0.05,ƍp<0.01 and
p<0.001 compared to UC; ¥p<0.01 and ¤p<0.001 compared to 1:1;Fp<0.01 and
Θp<0.001 compared to 1:2.5;Λp<0.01 and Øp<0.001 compared to 1:4;Up<0.01 and ϙp<0.001 compared to 1:5;βp<0.05, ×p<0.001 and ßp<0.001 compared to 1:10. (TIF)
S2 Fig. Differential ratios of n6and n3regulate the cell proliferation of non-cancerous cell lines.HaCaT and HEK293 cells were treated with different ratios of n6 (AA) and n3 (EPA +DHA) FA for 24h. Next day, the number of viable cells was counted using trypan blue dye exclusion assay. Data has been presented as mean±SEM of three independent experiments, each conducted in triplicates.ƍp<0.01 and
p<0.001 compared to UC; ¤p<0.001 compared to 1:1;Fp<0.01 andΘp<0.001 compared to 1:2.5;Λp<0.01 and Øp<0.001 compared to 1:4;
Up<0.01 andϙp<0.001 compared to 1:5; ×p<0.001 and ßp<0.001 compared to 1:10; ρp<0.05 andΔp<0.001 compared to 2.5:1;‡p<0.01 andSp<0.001 compared to 4:1,μp<0.01 compared to 5:1.
(TIF)
S3 Fig. Differential ratios of n6and n3regulate the lipid peroxidation in non-cancerous cells.HaCaT and HEK293 cells were treated with different ratios of n6 (AA) and n3 (EPA +DHA) ratios for 24h. Next day, lipid peroxidation was analyzed by using cis-parinaric acid and the values have been plotted in terms of percentage fluorescent intensity. Decrease of cis-parinaric acid fluorescence is proportional to increase in lipid peroxidation. Data has been pre-sented as mean±SEM of three independent experiments, each conducted in triplicates. % p<0.05,ƍp<0.01 and
p<0.001 compared to UC; ¥p<0.01 compared to 1:1;₭p<0.01,
Fp<0.01 andΘp<0.001 compared to 1:2.5;Λp<0.01 and Øp<0.001 compared to 1:4; $p<0.05,Up<0.01 andϙp<0.001 compared to 1:5;βp<0.05, ×p<0.001 and ßp<0.001 com-pared to 1:10.
(TIF)
Acknowledgments
We thank our Director, Dr. A. C. Mishra for his constant support.
Author Contributions
References
1. Jemal A, Center MM, DeSantis C, Ward EM. Global patterns of cancer incidence and mortality rates and trends. Cancer epidemiology, biomarkers & prevention: a publication of the American Association for Cancer Research, cosponsored by the American Society of Preventive Oncology. 2010; 19 (8):1893–907.
2. Ferlay J, Shin HR, Bray F, Forman D, Mathers C, Parkin DM. Estimates of worldwide burden of cancer in 2008: GLOBOCAN 2008. International journal of cancer Journal international du cancer. 2010; 127 (12):2893–917. doi:10.1002/ijc.25516PMID:21351269
3. Aggarwal BB, Ichikawa H, Garodia P, Weerasinghe P, Sethi G, Bhatt ID, et al. From traditional Ayurve-dic meAyurve-dicine to modern meAyurve-dicine: identification of therapeutic targets for suppression of inflammation and cancer. Expert opinion on therapeutic targets. 2006; 10(1):87–118. PMID:16441231
4. German JB, Roberts MA, Watkins SM. Genomics and metabolomics as markers for the interaction of diet and health: lessons from lipids. The Journal of nutrition. 2003; 133(6 Suppl 1):2078s–83s. PMID: 12771369
5. Skerrett PJ, Hennekens CH. Consumption of fish and fish oils and decreased risk of stroke. Preventive cardiology. 2003; 6(1):38–41. PMID:12624561
6. Vessby B. Dietary fat, fatty acid composition in plasma and the metabolic syndrome. Current opinion in lipidology. 2003; 14(1):15–9. PMID:12544656
7. Calder PC. Polyunsaturated fatty acids and inflammation. Biochemical Society transactions. 2005; 33 (Pt 2):423–7. PMID:15787620
8. Deshpande R, Mansara P, Suryavanshi S, Kail-Ghanekar R. Alpha-linolenic acid regulates the growth of breast and cervical cancer cell lines through regulation of NO release and induction of lipid peroxida-tion. J Mol Biochem. 2013; 2:26–17.
9. Ewaschuk JB, Newell M, Field CJ. Docosahexanoic acid improves chemotherapy efficacy by inducing CD95 translocation to lipid rafts in ER(-) breast cancer cells. Lipids. 2012; 47(11):1019–30. doi:10. 1007/s11745-012-3717-7PMID:23054549
10. Merendino N, Costantini L, Manzi L, Molinari R, D'Eliseo D, Velotti F. Dietary omega -3 polyunsaturated fatty acid DHA: a potential adjuvant in the treatment of cancer. BioMed research international. 2013; 2013:310186. doi:10.1155/2013/310186PMID:23762838
11. Brown MD, Hart CA, Gazi E, Bagley S, Clarke NW. Promotion of prostatic metastatic migration towards human bone marrow stoma by Omega 6 and its inhibition by Omega 3 PUFAs. British journal of cancer. 2006; 94(6):842–53. PMID:16523199
12. Donaldson MS. Nutrition and cancer: a review of the evidence for an anti-cancer diet. Nutrition journal. 2004; 3:19. PMID:15496224
13. Abou-el-Ela SH, Prasse KW, Farrell RL, Carroll RW, Wade AE, Bunce OR. Effects of D,L-2-difluoro-methylornithine and indomethacin on mammary tumor promotion in rats fed high n-3 and/or n-6 fat diets. Cancer research. 1989; 49(6):1434–40. PMID:2538226
14. Friesen RW, Innis SM. Dietary arachidonic acid to EPA and DHA balance is increased among Cana-dian pregnant women with low fish intake. The Journal of nutrition. 2009; 139(12):2344–50. doi:10. 3945/jn.109.112565PMID:19864401
15. Kris-Etherton PM, Grieger JA, Etherton TD. Dietary reference intakes for DHA and EPA. Prostaglan-dins, leukotrienes, and essential fatty acids. 2009; 81(2–3):99–104. doi:10.1016/j.plefa.2009.05.011 PMID:19525100
16. Mansara PM, Ketkar M, Deshpande RA, Chaudhary A, Shinde K, Kaul-Ghankeakr R. Improved antioxi-dant status by omega-3 fatty acid supplementation in breast cancer patients undergoing chemotherapy: a case series. Journal of Medical Case Reports 2015, 9:148. doi:10.1186/s13256-015-0619-3PMID: 26104023
17. Liu J, Ma DW. The role of n-3 polyunsaturated fatty acids in the prevention and treatment of breast can-cer. Nutrients. 2014; 6(11):5184–223. doi:10.3390/nu6115184PMID:25412153
18. Kacik M, Olivan-Viguera A, Kohler R. Modulation of K(Ca)3.1 channels by eicosanoids, omega-3 fatty acids, and molecular determinants. PloS one. 2014; 9(11):e112081. doi:10.1371/journal.pone. 0112081PMID:25372486
19. Stoll BA. N-3 fatty acids and lipid peroxidation in breast cancer inhibition. The British journal of nutrition. 2002; 87(3):193–8. PMID:12064327
21. Nakamura MT, Cheon Y, Li Y, Nara TY. Mechanisms of regulation of gene expression by fatty acids. Lipids. 2004; 39(11):1077–83. PMID:15726822
22. Sun H, Berquin IM, Owens RT, O'Flaherty JT, Edwards IJ. Peroxisome proliferator-activated receptor gamma-mediated up-regulation of syndecan-1 by n-3 fatty acids promotes apoptosis of human breast cancer cells. Cancer research. 2008; 68(8):2912–9. doi:10.1158/0008-5472.CAN-07-2305PMID: 18413760
23. Pachikian BD, Essaghir A, Demoulin JB, Neyrinck AM, Catry E, De Backer FC, et al. Hepatic n-3 poly-unsaturated fatty acid depletion promotes steatosis and insulin resistance in mice: genomic analysis of cellular targets. PloS one. 2011; 6(8):e23365. doi:10.1371/journal.pone.0023365PMID:21853118
24. Manna S, Chakraborty T, Damodaran S, Samanta K, Rana B, Chatterjee M. Protective role of fish oil (Maxepa) on early events of rat mammary carcinogenesis by modulation of DNA-protein crosslinks, cell proliferation and p53 expression. Cancer cell international. 2007; 7:6. PMID:17470299
25. Shin S, Jing K, Jeong S, Kim N, Song KS, Heo JY, et al. The omega-3 polyunsaturated fatty acid DHA induces simultaneous apoptosis and autophagy via mitochondrial ROS-mediated Akt-mTOR signaling in prostate cancer cells expressing mutant p53. BioMed research international. 2013; 2013:568671. doi:10.1155/2013/568671PMID:23841076
26. Bernard-Gallon DJ, Vissac-Sabatier C, Antoine-Vincent D, Rio PG, Maurizis JC, Fustier P, et al. Differ-ential effects of n-3 and n-6 polyunsaturated fatty acids on BRCA1 and BRCA2 gene expression in breast cell lines. The British journal of nutrition. 2002; 87(4):281–9. PMID:12064337
27. Xia S, Lu Y, Wang J, He C, Hong S, Serhan CN, et al. Melanoma growth is reduced in fat-1 transgenic mice: impact of omega-6/omega-3 essential fatty acids. Proceedings of the National Academy of Sci-ences of the United States of America. 2006; 103(33):12499–504. PMID:16888035
28. Maillard V, Bougnoux P, Ferrari P, Jourdan ML, Pinault M, Lavillonniere F, et al. N-3 and N-6 fatty acids in breast adipose tissue and relative risk of breast cancer in a case-control study in Tours, France. Inter-national journal of cancer Journal interInter-national du cancer. 2002; 98(1):78–83. PMID:11857389
29. Goodstine SL, Zheng T, Holford TR, Ward BA, Carter D, Owens PH, et al. Dietary (n-3)/(n-6) fatty acid ratio: possible relationship to premenopausal but not postmenopausal breast cancer risk in U.S. women. The Journal of nutrition. 2003; 133(5):1409–14. PMID:12730430
30. Simopoulos AP. The omega-6/omega-3 fatty acid ratio, genetic variation, and cardiovascular disease. Asia Pacific journal of clinical nutrition. 2008; 17 Suppl 1:131–4. PMID:18296320
31. Harnack K, Andersen G, Somoza V. Quantitation of alpha-linolenic acid elongation to eicosapentaenoic and docosahexaenoic acid as affected by the ratio of n6/n3 fatty acids. Nutrition & metabolism. 2009; 6:8.
32. Simopoulos AP. The importance of the omega-6/omega-3 fatty acid ratio in cardiovascular disease and other chronic diseases. Experimental biology and medicine. 2008; 233(6):674–88. doi: 10.3181/0711-MR-311PMID:18408140
33. Hardman WE, Avula CP, Fernandes G, Cameron IL. Three percent dietary fish oil concentrate increased efficacy of doxorubicin against MDA-MB 231 breast cancer xenografts. Clinical cancer research. 2001; 7(7):2041–9. PMID:11448922
34. Wu M, Harvey KA, Ruzmetov N, Welch ZR, Sech L, Jackson K, et al. Omega-3 polyunsaturated fatty acids attenuate breast cancer growth through activation of a neutral sphingomyelinase-mediated path-way. International journal of cancer. 2005; 117(3):340–8.
35. Kansal S, Bhatnagar A, Agnihotri N. Fish oil suppresses cell growth and metastatic potential by regulat-ing PTEN and NF-kappaB signalregulat-ing in colorectal cancer. PloS one. 2014; 9(1):e84627. doi:10.1371/ journal.pone.0084627PMID:24416253
36. Kansal S, Vaiphei K, Agnihotri N. Alterations in lipid mediated signaling and Wnt/ beta-catenin signaling in DMH induced colon cancer on supplementation of fish oil. BioMed research international. 2014; 2014:832025. doi:10.1155/2014/832025PMID:24999478
37. Signori C, El-Bayoumy K, Russo J, Thompson HJ, Richie JP, Hartman TJ, et al. Chemoprevention of breast cancer by fish oil in preclinical models: trials and tribulations. Cancer research. 2011; 71 (19):6091–6. doi:10.1158/0008-5472.CAN-11-0977PMID:21933885
38. Iyer SV, Dange PP, Alam H, Sawant SS, Ingle AD, Borges AM, et al. Understanding the role of keratins 8 and 18 in neoplastic potential of breast cancer derived cell lines. PloS one. 2013; 8(1):e53532. doi: 10.1371/journal.pone.0053532PMID:23341946
39. Mahadik SP, Shendarkar NS, Scheffer RE, Mukherjee S, Correnti EE. Utilization of precursor essential fatty acids in culture by skin fibroblasts from schizophrenic patients and normal controls. Prostaglan-dins, leukotrienes, and essential fatty acids. 1996; 55(1–2):65–70. PMID:8888125
hyperthermia and drug delivery applications in breast cancer. PloS one. 2014; 9(9):e107315. doi:10. 1371/journal.pone.0107315PMID:25268975
41. Datta K, Suman S, Kallakury BV, Fornace AJ Jr. Exposure to heavy ion radiation induces persistent oxi-dative stress in mouse intestine. PloS one. 2012; 7(8):e42224. doi:10.1371/journal.pone.0042224 PMID:22936983
42. Manku MS, Horrobin DF, Huang YS, Morse N. Fatty acids in plasma and red cell membranes in normal humans. Lipids. 1983; 18(12):906–8. PMID:6664259
43. Sjakste N, Sjakste T, Vikmanis U. Role of the nuclear matrix proteins in malignant transformation and cancer diagnosis. Experimental oncology. 2004; 26(3):170–8. PMID:15494683
44. Corsetto PA, Cremona A, Montorfano G, Jovenitti IE, Orsini F, Arosio P, et al. Chemical-physical changes in cell membrane microdomains of breast cancer cells after omega-3 PUFA incorporation. Cell biochemistry and biophysics. 2012; 64(1):45–59. doi:10.1007/s12013-012-9365-yPMID: 22622660
45. Simopoulos AP. The importance of the ratio of omega-6/omega-3 essential fatty acids. Biomedicine & pharmacotherapy. 2002; 56(8):365–79.
46. Simopoulos AP. Evolutionary aspects of diet, the omega-6/omega-3 ratio and genetic variation: nutri-tional implications for chronic diseases. Biomedicine & pharmacotherapy. 2006; 60(9):502–7.
47. Gomez Candela C, Bermejo Lopez LM, Loria Kohen V. Importance of a balanced omega 6/omega 3 ratio for the maintenance of health: nutritional recommendations. Nutricion hospitalaria. 2011; 26 (2):323–9. doi:10.1590/S0212-16112011000200013PMID:21666970
48. Sarotra P, Sharma G, Kansal S, Negi AK, Aggarwal R, Sandhir R, et al. Chemopreventive effect of dif-ferent ratios of fish oil and corn oil in experimental colon carcinogenesis. Lipids. 2010; 45(9):785–98. doi:10.1007/s11745-010-3459-3PMID:20737228
49. Kansal S, Negi AK, Bhatnagar A, Agnihotri N. Ras signaling pathway in the chemopreventive action of different ratios of fish oil and corn oil in experimentally induced colon carcinogenesis. Nutrition and can-cer. 2012; 64(4):559–68. doi:10.1080/01635581.2012.675619PMID:22519408
50. Das UN, Madhavi N. Effect of polyunsaturated fatty acids on drug-sensitive and resistant tumor cells in vitro. Lipids in health and disease. 2011; 10:159. doi:10.1186/1476-511X-10-159PMID:21917129
51. Sagar PS, Das UN. Cytotoxic action of cis-unsaturated fatty acids on human cervical carcinoma (HeLa) cells in vitro. Prostaglandins, leukotrienes, and essential fatty acids. 1995; 53(4):287–99. PMID: 8577783
52. Madhavi N, Das UN. Effect of n-6 and n-3 fatty acids on the survival of vincristine sensitive and resistant human cervical carcinoma cells in vitro. Cancer letters. 1994; 84(1):31–41. PMID:8076361
53. Bégin ME, Das UN, Ells G. Cytotoxic effects of essential fatty acids (EFA) in mixed cultures of normal and malignant human cells. Progress in Lipid Research. 1986; 25(0):573–6.
54. Begin ME, Ells G, Das UN, Horrobin DF. Differential killing of human carcinoma cells supplemented with n-3 and n-6 polyunsaturated fatty acids. Journal of the National Cancer Institute. 1986; 77 (5):1053–62. PMID:3464797
55. Cao Y, Pearman AT, Zimmerman GA, McIntyre TM, Prescott SM. Intracellular unesterified arachidonic acid signals apoptosis. Proceedings of the National Academy of Sciences of the United States of Amer-ica. 2000; 97(21):11280–5. PMID:11005842
56. Begin ME, Ells G, Horrobin DF. Polyunsaturated fatty acid-induced cytotoxicity against tumor cells and its relationship to lipid peroxidation. Journal of the National Cancer Institute. 1988; 80(3):188–94. PMID:3346910
57. Wang J, Green PS, Simpkins JW. Estradiol protects against ATP depletion, mitochondrial membrane potential decline and the generation of reactive oxygen species induced by 3-nitroproprionic acid in SK-N-SH human neuroblastoma cells. Journal of neurochemistry. 2001; 77(3):804–11. PMID:11331409
58. Kim JK, Pedram A, Razandi M, Levin ER. Estrogen prevents cardiomyocyte apoptosis through inhibi-tion of reactive oxygen species and differential regulainhibi-tion of p38 kinase isoforms. The Journal of biolog-ical chemistry. 2006; 281(10):6760–7. PMID:16407188
59. Das UN, Huang YS, Begin ME, Ells G, Horrobin DF. Uptake and distribution of cis-unsaturated fatty acids and their effect on free radical generation in normal and tumor cells in vitro. Free radical biology & medicine. 1987; 3(1):9–14.
60. Alessandri JM, Extier A, Langelier B, Perruchot MH, Heberden C, Guesnet P, et al. Estradiol favors the formation of eicosapentaenoic acid (20:5n-3) and n-3 docosapentaenoic acid (22:5n-3) from alpha-lino-lenic acid (18:3n-3) in SH-SY5Y neuroblastoma cells. Lipids. 2008; 43(1):19–28. PMID:17912567
62. Hilakivi-Clarke L, Onojafe I, Raygada M, Cho E, Clarke R, Lippman ME. Breast cancer risk in rats fed a diet high in n-6 polyunsaturated fatty acids during pregnancy. Journal of the National Cancer Institute. 1996; 88(24):1821–7. PMID:8961971
63. Kaul R, Mukherjee S, Ahmed F, Bhat MK, Chhipa R, Galande S, et al. Direct interaction with and activa-tion of p53 by SMAR1 retards cell-cycle progression at G2/M phase and delays tumor growth in mice. International journal of cancer. 2003; 103(5):606–15.
64. Malonia SK, Sinha S, Lakshminarasimhan P, Singh K, Jalota-Badhwar A, Rampalli S, et al. Gene regu-lation by SMAR1: Role in cellular homeostasis and cancer. Biochimica et biophysica acta. 2011; 1815 (1):1–12. doi:10.1016/j.bbcan.2010.08.003PMID:20709157
65. Galande S. Chromatin (dis)organization and cancer: BUR-binding proteins as biomarkers for cancer. Current cancer drug targets. 2002; 2(2):157–90. PMID:12188916
66. Chattopadhyay S, Pavithra L. MARs and MARBPs: key modulators of gene regulation and disease manifestation. Sub-cellular biochemistry. 2007; 41:213–30. PMID:17484130
67. Lever E, Sheer D. The role of nuclear organization in cancer. The Journal of pathology. 2010; 220 (2):114–25. doi:10.1002/path.2651PMID:19927301
68. Kaul-Ghanekar R, Singh S, Mamgain H, Jalota-Badhwar A, Paknikar KM, Chattopadhyay S. Tumor suppressor protein SMAR1 modulates the roughness of cell surface: combined AFM and SEM study. BMC cancer. 2009; 9:350. doi:10.1186/1471-2407-9-350PMID:19799771
69. Singh K, Mogare D, Giridharagopalan RO, Gogiraju R, Pande G, Chattopadhyay S. p53 target gene SMAR1 is dysregulated in breast cancer: its role in cancer cell migration and invasion. PloS one. 2007; 2(8):e660.
70. Michl P, Ramjaun AR, Pardo OE, Warne PH, Wagner M, Poulsom R, et al. CUTL1 is a target of TGF (beta) signaling that enhances cancer cell motility and invasiveness. Cancer cell. 2005; 7(6):521–32. PMID:15950902
71. Zhu Q, Maitra U, Johnston D, Lozano M, Dudley JP. The homeodomain protein CDP regulates mam-mary-specific gene transcription and tumorigenesis. Molecular and cellular biology. 2004; 24 (11):4810–23. PMID:15143175
72. Sansregret L, Nepveu A. The multiple roles of CUX1: insights from mouse models and cell-based assays. Gene. 2008; 412(1–2):84–94. doi:10.1016/j.gene.2008.01.017PMID:18313863
73. Nepveu A. Role of the multifunctional CDP/Cut/Cux homeodomain transcription factor in regulating dif-ferentiation, cell growth and development. Gene. 2001; 270(1–2):1–15. PMID:11403998