www.atmos-meas-tech.net/8/2885/2015/ doi:10.5194/amt-8-2885-2015
© Author(s) 2015. CC Attribution 3.0 License.
Application of the locality principle to radio occultation studies of
the Earth’s atmosphere and ionosphere
A. G. Pavelyev1, Y. A. Liou2, S. S. Matyugov1, A. A. Pavelyev1, V. N. Gubenko1, K. Zhang3, and Y. Kuleshov4 1Kotelnikov Institute of Radio Engineering and Electronics of the Russian Academy of Sciences, Fryazino, Moscow region, Russia
2Center for Space and Remote Sensing Research, National Central University, Jhong-Li, 320, Taiwan 3SPACE Research Centre/RMIT University/Australia (03) 99253272, Melbourne, Australia
4National Climate Centre, Bureau of Meteorology, Melbourne, Australia
Correspondence to:A. G. Pavelyev ([email protected]) and Y. A. Liou ([email protected]) Received: 23 October 2014 – Published in Atmos. Meas. Tech. Discuss.: 20 January 2015
Revised: 8 June 2015 – Accepted: 22 June 2015 – Published: 17 July 2015
Abstract. A new formulation of the previously introduced principle of locality is presented. The principle can be ap-plied for modernization of the radio occultation (RO) remote sensing of the atmospheres and ionospheres of the Earth and other planets. The principle states that significant contribu-tions to variacontribu-tions of the intensity and phase of the radio waves passing through a layered medium are connected with influence of the vicinities of tangential points where the re-fractivity gradient is perpendicular to the radio ray trajectory. The RO method assumes spherical symmetry of the inves-tigated medium. In this case, if location of a tangent point relative to the spherical symmetry centre is known, the time derivatives of the RO signal phase and Doppler frequency variations can be recalculated into the refractive attenuation. Several important findings are consequences of the locality principle: (i) if position of the centre of symmetry is known, the total absorption along the ray path can be determined at a single frequency; (ii) in the case of low absorption the height, displacement from the radio ray perigee, and tilt of the inclined ionospheric (atmospheric) layers can be evalu-ated; (iii) the contributions of the layered and irregular struc-tures in the RO signal can be separated and parameters of layers and turbulence can be measured at a single frequency using joint analysis of the intensity and phase variations. Spe-cially for the Earth’s troposphere, the altitude distributions of the weak total absorption (about of 1–4 db) of the radio waves at GPS frequencies corresponding to possible influence of the oxygen, water vapour, and hydrometeors can be measured with accuracy of about 0.1 db at a single frequency. In
accor-dance with the locality principle, a new index of ionospheric activity is introduced. This index is measured from the phase variations of radio waves passing through the ionosphere. Its high correlation with the S4 scintillation index is estab-lished. This correlation indicates the significant influence of locally spherical symmetric ionospheric layers on variations of the phase and intensity of the RO signal passing through transionospheric communication links. Obtained results ex-pand applicable domain of the RO method as a powerful re-mote sensing technique for geophysical and meteorological research.
1 Introduction
global monitoring of the Earth’s ionosphere and atmosphere at different altitudes (Vorob’ev and Krasilnikova, 1994; Mel-bourne et al., 1994; Syndergaard, 1998, 1999; Yunck et al., 2000). In particular, effectiveness of the RO method applied for investigation of the Earth’s ionosphere can be compared with radio tomographic approach (Kunitsyn and Tereshchenko, 2003). The tomographic method allows ob-taining 2-D distributions of electron density in the iono-sphere using a chain of ground-based receivers, which cap-ture signals of low Earth orbital (LEO) or navigational satel-lites along a set of intersecting radio rays (Kunitsyn et al., 2011, 2013). Unlike the radio tomographic approach, the RO method uses a set of nearly parallel radio-ray trajecto-ries. The RO method applied for processing the assumption of spherical symmetry of the Earth’s ionosphere and atmo-sphere with known location of the centre of symmetry (Mel-bourne et al., 1994; Yakovlev, 2002; Mel(Mel-bourne, 2004). In accordance with this assumption, all resulting altitude pro-files of atmospheric and ionospheric parameters are attached to vertical and horizontal coordinates of the radio ray perigee relative to a spherical symmetry centre, which is close to or coincident with the centre of the Earth or a selected planet.
Highly stable signals synchronized by atomic frequency standards and radiated by GPS satellites at frequencies F1 =1575.42 MHz and F2=1227.60 MHz create at the al-titudes from 0 to 20 000 km radio fields that can be used for the development of the RO method as a new tool for global monitoring of the ionosphere and neutral atmosphere (Gur-vich and Krasilnikova, 1987; Yunck, 1988). Several LEO missions were launched during 1995–2014 for the study of the atmosphere and ionosphere: GPS/MET (Melbourne et al., 1994; Ware et al., 1996; Gorbunov et al., 1996; Kursinski et al., 1997; Vorob’ev et al., 1997; Hajj and Romans, 1998), SAC-C (Schmidt et al., 2005), CHAMP (Wickert et al., 2001, 2009), FORMOSAT-3 (Liou et al., 2007; Fong et al., 2008), GRACE (Hajj et al., 2004; Wickert et al., 2005), METOP (Von Engeln et al., 2011; Joo et al., 2012), TERRA-SAR, TANDEM-X (Zus et al., 2014), and FY-3 CNOS (Bai et al., 2014). The success of these missions demonstrated that the RO technique is a powerful remote sensing tool for obtaining key vertical profiles of bending angle, refractivity, tempera-ture, pressure and water vapour in the atmosphere and elec-tron density in ionosphere with global coverage, high spatial and temporal resolution (Zhang et al., 2013). Explicit anal-ysis of experimental data of LEO missions introduced im-portant contributions in the following areas: (i) the theory of radio wave propagation (Gorbunov and Gurvich, 1998a; Gorbunov et al., 2002; Benzon et al., 2003; Gorbunov and Lauritsen, 2004; Gorbunov and Kirchengast, 2005; Pavelyev et al., 2004, 2010a); (ii) climate changes detection (Kirchen-gast et al., 2000; Steiner et al., 2001; Foelsche et al., 2008); (iii) space weather effects and ionosphere monitoring (Rius et al., 1998; Jakowski et al., 2004; Wickert et al., 2004; Ar-ras et al., 2008, 2010); (iv) deriving new radio-holographic methods of the RO remote sensing (Karayel and Hinson,
1997; Mortensen and Hoeg, 1998; Pavelyev, 1998; Gorbunov and Gurvich, 1998b; Mortensen et al., 1999; Hocke et al., 1999; Sokolovskiy, 2000; Sokolovskiy et al., 2002; Gor-bunov, 2002a, b; Gorbunov et al., 1996, 2002, 2010; Igarashi et al., 2000; Jensen et al., 2003, 2004; Pavelyev et al., 2002, 2004, 2010a, b, 2012; Liou et al., 2010; Yakovlev et al., 2010).
Recently, an important connection between the intensity and time derivatives of the phase, eikonal, Doppler frequency of radio waves propagating through the ionosphere and at-mosphere has been discovered by theoretical analysis and confirmed by processing of the RO radio-holograms (Liou and Pavelyev, 2006; Liou et al., 2007, 2010; Pavelyev et al., 2008a, 2012). This connection is a key regularity of the RO method. Now this relationship gets a possibility to rec-ognize that the phase (eikonal) acceleration (proportional to the time derivative of the Doppler shift) has the same im-portance for the theory of radio waves propagation in a lay-ered medium and solution of the RO inverse problem as the Doppler frequency, phase path excess, and refractive attenu-ation of the RO signal (Liou and Pavelyev, 2006; Liou et al., 2007; Pavelyev, 2008, 2013; Pavelyev et al., 2009, 2010a, b, 2012, 2013). It follows from this connection that the phase acceleration technique allows one to convert the phase and Doppler frequency changes into refractive attenuation varia-tions at a single frequency. Note that this is similar to clas-sical dynamics when the derivations of the path and veloc-ity on time and acceleration are connected by the Newton’s laws. From such derived refractive attenuation and inten-sity data, one can estimate the integral absorption of radio waves. This is important for future RO missions for mea-suring water vapour and minor atmospheric gas constituents, because the difficulty of removing the refractive attenuation effect from the intensity data can be avoided. The phase ac-celeration/intensity technique can be applied also for deter-mining the location and inclination of sharp layered plasma structures (including sporadic Es layers) in the ionosphere. Advantages of the phase acceleration/intensity technique are validated by analyzing the RO data from the Challenging Minisatellite Payload (CHAMP) and the FORMOSA Satel-lite Constellation Observing Systems for Meteorology, Iono-sphere, and Climate missions (FORMOSAT-3/COSMIC).
iono-spheres of Earth and other planets (Steiner and Kirchengast, 2000; Liou et al., 2003, 2005b, 2007; Pavelyev et al., 2007; Gubenko et al., 2008a, b, 2011).
The goals of this paper are the following: (i) to formulate a principle of locality; (ii) to present several important find-ings arising from the locality principle; and (iii) to introduce a new index of ionospheric activity. The paper is structured as follows. In Sect. 2 the formulation of the locality prin-ciple is presented. Section 3 describes three important find-ings following from the locality principle: (i) a possibility to determine the total absorption at a single frequency; (ii) a possibility to evaluate the height, displacement from the radio ray perigee, and tilt of the inclined ionospheric (atmo-spheric) layers; (iii) method for separation of the contribu-tions of the layered and irregular structures in the RO signal, and technique for measurement of parameters of layers and turbulence at a single frequency using joint analysis of the amplitude and phase variations. In Sect. 4 a new scintilla-tion index based on the refractive attenuascintilla-tion found from the phase variations of the RO signal is introduced and its corre-lation with the S4 index is established. Conclusions are given in Sect. 5.
2 Principle of locality
The principle of locality is based on a previously established connection (Liou and Pavelyev, 2006; Liou et al., 2007; Pave-lyev et al., 2008a, b, 2009, 2010a), which relates the eikonal accelerationaand refractive attenuationX′p(t )of the RO sig-nal emitted by a transmitterGand received by satelliteL af-ter passing through a spherically symmetric medium with a centre of symmetry at pointO′(Fig. 1):
1−X′p(t )=m′a, a=d 28(t )
dt2 =λ dFd(t )
dt , m ′
(1) = d
′ 2d1′
(d1′+d2′)(dp ′ s/dt )−
2;p′ s=
O′D′
;8(t )
=
Z
G L
n(l)dl−R0,
whereλis the length of radio waves;d1′, d2′, andR0are the distances along the straight linesGD′,D′LandGL, respec-tively; point D′ is the projection of the centre of symmetry
O′ onto the straight lineGDL; pointDis the projection of the centreOon the straight lineGL;p′
sis the impact param-eter of the straight lineGDLrelative to the centreO′;8(t ) is the difference between the eikonal of radio waves prop-agating along the radio ray trajectory GT L and the length
GDLas a function of timet;n(l)is the refractive index; dl
is the differential length of the radio rayGT L; and pointT
is the radio ray perigee having the altitudehrelative to the Earth’s surface (or that of another planet) (Fig. 1). Another important geometric parameter is the heightH of the line of
Figure 1.Scheme of radio occultation measurements.
sightGDLabove the surface. During a RO event the magni-tudeHchanges from positive to negative values. The eikonal accelerationa(Eq. 1) is proportional to the time derivative of the Doppler frequency of radio wavesFd(t ). Equality (Eq. 1) is fulfilled under the following conditions (Liou et al., 2007; Pavelyev et al., 2008a, b):
p′−ps′dR ′ 1,2 dt ≪
p′sdp ′ s dt
;d1′≫d2′;
p′−ps′ d
dt
∂θ′ ∂p′ s
dp′ s dt ≪
dp′ dt −
dp′ s dt
∂θ′ ∂p′ s
dp′ s dt . (2) wherep′ is the impact parameter of the rayGT L relative to the centreO′. In the case of the RO ionospheric research the centre of spherical symmetry can be shifted relative to the centreO, and the first and third inequalities are satis-fied only if the distanceOO′ is significantly less than the Earth’s radiusρe(Fig. 1). The second inequality is necessary for excluding uncertainty because of symmetry in the depen-dence of the coefficientm′ with respect to variablesd2′, d1′. In the case of GPS RO atmospheric sounding, these inequal-ities are satisfied if the orbits of satellitesGandLare circu-lar, the centre of spherical symmetryO′ is almost identical to the centre of the Earth (or another planet)O, and point
T′coincides with perigeeT of the rayGT L(Fig. 1). Loca-tion of the radio ray perigeeT in accordance with solution of the RO inverse problem determines temporal dependen-cies of the heighthabove the Earth’s surface and horizontal coordinates of atmospheric layers (Melbourne et al, 1994; Yakovlev, 2002; Melbourne, 2004).
When absorption is absent, the refractive attenuationX′p(t )
found from (Eq. 1) should be equal to the refractive attenua-tionXa(t )determined using the RO intensity data (Liou and Pavelyev, 2006):
X′p(t )≡Xa(t );Xa(t )=I /I0, (3)
where I0 and I are intensities of the RO signal before and after the moment when radio ray enters the medium, respectively. Identity (Eq. 3) is fulfilled if the coefficient
m′ in Eq. (1) is evaluated in accordance with location of the tangential point T′, which is the perigee of radio ray
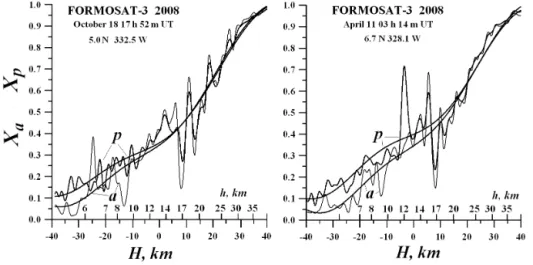
Figure 2. Comparison of the refractive attenuations Xa(h) and Xp(h) and their polynomial approximations, corresponding to the FORMOSAT-3 RO measurements carried out on 18 October and 11 April 2008 (left and right plots, respectively). Thick and thin rough curves (marked by indices “p” and “a”) describe the vertical profiles ofXp(h)andXa(h), respectively. Smooth curves describing polynomial
approximations of the altitudes dependences ofXp(h)andXa(h)are also highlighted by indices “p” and “a”.
pointT′ on the rayGT L and, naturally, on coefficientm′. However, calculated value of the refractive attenuationX′p(t )
does depend on the coefficientm′(Eq. 1) and location of the tangent point T′ on the ray GT L. This permits to formu-late principle of locality under the conditions of single-ray radio wave propagation and absence of absorption (Pavelyev et al., 2012, 2013; Pavelyev, 2013): the refractive attenua-tionsX′p(t )andXa(t )are equal if evaluation ofX′p(t )is pro-vided with the coefficient m′ corresponding to locations of the spherical symmetry centreO′and ray perigeeT′. In ac-cordance with the locality principle, the rapid amplitude and phase variations of the radio waves registered at pointLmay be considered as connected with influence of a small neigh-bourhood of the ray perigee T′ corresponding to the local spherical symmetry centreO′.
3 Consequences of the locality principle
Next important findings that follow the locality principle are addressed below.
3.1 Possibility of determination of the total absorption
If location of the symmetry centre is known (for example, when the pointO′coincides with the Earth’s centreO), the total absorptionŴin the atmosphere (ionosphere) can be de-fined by eliminating from valueXa(t )the refractive attenua-tionXp(h)found from eikonal variations.
Ŵ=10 lgXa(t )
Xp(t )
(4) Some results of determination of the refractive attenuations
Xa(h)andXp(h), and total absorptionŴare considered be-low. Figure 2 (left and right plots) shows two vertical profiles
of the refractive attenuations Xa(h) andXa(h) highlighted by indices “a” and “p” (rough curves), respectively, and their polynomial approximation (smooth curves) measured at the first GPS frequency F1. The measurements were provided in 2008 above two regions located in central Africa (RO events 18 October 17:52 UT (left), and 11 April 03:14 UT (right), with geographical coordinates 5.0◦N 332.5◦W, and 6.7◦N 328.1◦W, respectively) using the FORMOSAT-3 satellites. The altitude dependences ofXa(h)andXp(h)and their poly-nomial approximations are described by corresponding pairs of rough and smooth curves indicated by indices “a” and “p”, respectively. Values of the altitudes of the line of sight
GDL H and the height of the ray perigee h are plotted on the horizontal axis. The Xa(h) andXp(h) profiles and their polynomial approximations are almost coincident at the heights between 12 and 40 km, and significantly different below 8–9 km (Fig. 2, right and left plots). The correlation between variations ofXa(h)andXp(h)gradually decreases with heightHand magnitude ofXa(h)is obviously well be-low the corresponding values ofXp(h)in the 5–9 km altitude intervalh. This indicates a possible influence of total absorp-tion of the radio waves in the atmosphere.
Figure 3.Left plot – Comparison of the refractive attenuationsXa(h)andXp(h)(groups of curves I–IY). Each group consists of four curves.
In each group thick and thin rough curves (marked by indices “p” and “a”) describe the experimental vertical profiles ofXp(h)andXa(h), respectively. Smooth curves in each group describe polynomial approximations of the altitudes dependences ofXp(h)andXa(h)and are also highlighted by indices “p” and “a”, respectively. For convenience groups of curves II–IY are displaced by 0.6; 1.2; 1.8 units. Right – The total absorptionŴcorresponding to the refractive attenuationsXa(h),Xp(h)measured at frequency F1 has been calculated from the smooth curves I–IY (marked by indicesa, pin left panel). Curves II, III, and IY are shifted for comparison by 1, 2, and 3 db, respectively.
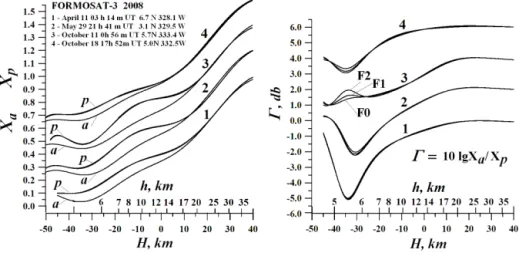
Figure 4.Left plot – Comparison of the polynomial approximations of refractive attenuationsXa(h),Xp(h)(curves 1–4, indexes “p” and
“a”, respectively). Curves 2–4 are displaced for convenience by 0.6; 0.4; 0.2, respectively. Right – The total absorptionŴcorresponding to the refractive attenuationsXa(h),Xp(h)has been calculated from the curves 1–4 (left panel). Curves 2, 3, and 4 are shifted for convenience by 2, 4, and 6 db, respectively.
is observed below 8 km altitude. However, the altitude depen-dence of absorptionŴis different in the considered regions. Two cases revealed significant decrease of absorption Ŵin the 5–6 km (IY) and 7–8 km (II) height interval. In the re-maining areas the total absorption changes from 1.5 db (I) up to 3.5 db (III) below 7 km altitudeh.
Polynomial approximations of the refractive attenuations
Xa(h) (measured at frequency F1); Xp1(h), Xp2(h) (eval-uated from the eikonal data at frequencies F1, F2); and
Xp0(h)(estimated from the combined eikonalF0=(F1281−
F2282)/(F12−F22)) are shown in Fig. 4. These results are rel-evant to four RO events and correspond to four equatorial regions located in central Africa. Figure 4 (left plot) shows
vertical profiles of refractive attenuations Xa(h), Xp1(h) found from the FORMOSAT-3 RO data corresponding to four events carried out on 11 April 2008 03:14 UT, 6.7◦N 328.1◦W; 29 May 21:41 UT 3.1◦N 329.5◦W; 11 October 00:56 UT, 5.7◦N 333.4◦W; and 18 October 17:52 UT, 5.0◦N 332.5◦W; (curves 1–4, respectively). Values of the altitudes
hof the ray perigeeT and the heightH of the straight line
GDLrelative to the Earth’s surface are marked on the hor-izontal axis. The Xa(h) andXp(h) profiles are marked by indices “a” and “p”, respectively. All three curvesXp(h)=
shown. This may be connected with influence of the iono-sphere. Measured values of the total absorption coincide with a mean value of Ŵ equal to 0.0096±0.0024 db km−1 and correspond to the MIR–geostationary satellites RO data at the 32 cm wavelength obtained in monochromatic regime (Pavelyev et al., 1996).
3.2 Determination of tilt, height, and displacement of inclined layers
If centre of symmetry does not coincide with the expected location – pointO, principle of locality states:
Xa(t )≡X′p(t );1−Xa(t )=m′a=
m′ m
1−Xp(t )
, (5)
where magnitudes of the refractive attenuationXp(t )and co-efficientmcorrespond to position of the pointO. Using rela-tionship (Eq. 1) connecting coefficientm′with the distances
d1′, d2′, and impact parameterp′s, one can obtain
m′
m −1=
d′
2d1′(dps/dt ) 2
d2d1(dp′s/dt )2
−1;d1+d2=d1′+d2′=R0. (6) If the displacement of spherical symmetry centre satisfies the following conditions:
dps dt ≈
dp′ s dt ;
d2
R0 ≪1;d
′ 2
R0
≪1, (7)
one can find from Eqs. (6), (7):
Xp(t )−Xa(t )=
d2′−d2
d2
1−Xp(t )=
d d2
1−Xp(t ), (8) wheredis the distanceDD′(see Fig. 1). It follows from Eqs. (5), (8) that amplitudesAa, Apof variations of the refractive attenuations – 1−Xa(h), 1−Xp(h)and distancedare con-nected by the following equations:
m′=Aa(t )
Ap(t )
m;d=
Aa(t )
Ap(t ) −1
d2. (9)
The coefficients m, m′ are slowly changing as functions of time. Therefore the coefficient m′ and the layer’s displace-mentd can be estimated in the time instant when the ampli-tudeAp(t )achieves maximal magnitude. This allows finding, if absorption is absent, the displacementd of the tangential pointT′with respect to the ray perigeeT (Fig. 1) as well as the layer’s heighth′and inclinationδ from following equa-tions:
d=d2′−d2=d2(α−1);α=
Aa
Ap
;d2 (10)
=
q
R2L−p2
s, h′=h+1h, 1h= dδ
2 , δ=
d re
, re= |T O|.
The amplitudesAa, Apof variations of the refractive attenua-tions 1−Xa(h)and 1−Xp(h), can be evaluated, for example,
using the Hilbert numerical transform. The amplitudeAp(t ) of refractive attenuation Xp(t )is evaluated using the coef-ficient m corresponding to the centre of Earth (or another planet)O. Depending on the sign of the differenceAa−Ap, the value ofdis positive (or negative), and pointT′is located on theGT orT Llines. Note that relationship (Eq. 9) is ful-filled if one of the satellites is much farther away from the centre of symmetry than the other. This condition is usually satisfied during the Earth or planetary RO missions (Fjeldbo, 1964; Yakovlev, 2002).
The spherical symmetry of a medium with new centreO′
justifies application of the Abel transformation for solution of the inverse problem (Pavelyev et al., 2008a, b). The time derivative of the phase path excess8(t )is used to obtain the temporal dependence of the impact parameterp′:
p′−p′s= −m′d8
dt
dps
dt = −mα
d8
dt
dps
dt =α (p−ps) . (11)
To solve the inverse problem, the following formulas are used for the Abel transform (Hocke, 1997; Pavelyev et al., 2012) (for simplicity, the bar in designations of the impact parame-tersp′, ps′is deleted):
N (p)= −1
π ∞ Z p ln x p+ s x2 p2−1
dξ(x)
dx dx, (12)
wherepis the impact parameter corresponding to rayGT L
at the instant of timet andN (p)is the refractivity. The ver-tical gradient of refractivity dN (p)/dh can be found from Eq. (12) using a relationship:
dN (p)
dh =
1+N (p)
1−dN (p)dp rT dN (p)
dp , (13)
where rT is the distance T′O′ (Fig. 1). Derivative of the bending angle ξ(p) on impact parameter p can be found from the RO signal intensity or the RO phase path excess data (Pavelyev and Kucheryavenkov, 1978; Pavelyev et al., 2012, 2013), i.e.,
X(p)= p
ps 1− q
R22−p2qR2 1−p2 d
ξ(p) dp R −1 0 ; (14) dξ(p)
dp =
1−psp−1X−1
R0
q
R22−p2qR2 1−p2
≈ 1−X −1
R0
q
R21−p2qR2 2−p2
.
The last equation Eq. (14) for dξ(p)/dpis valid under con-dition:p≈ps. Substitution Eq. (14) in Eq. (12) gives with accounting for relation dpdt =X(p)dps
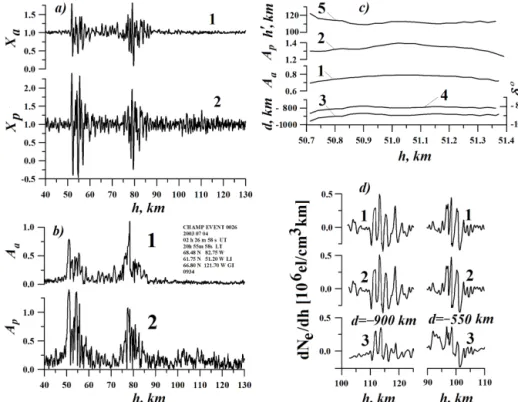
Figure 5. (a)Comparison of the refractive attenuationsXa(h),Xp(h)found from the RO intensity and eikonal data at GPS frequency F1 (curves 1 and 2, respectively).(b)The amplitudesAa, Apof analytical signals corresponding to the variations of the refractive attenuations
1−Xa(h)and 1−Xp(h)(curves 1 and 2), respectively.(c)Location of the first layer using amplitudesAa, Ap.(d)Vertical profiles of the gradients of electron density in the layers.
1986):
N (p)= 1
π
t (p)
Z
−∞ ln
x
p+
s
x2 p2−1
(15)
[X(t )−1]R0
q
R12−x(t )2qR2 2−x(t )2
dps(t ) dt dt; x(t )=p(t ); −∞< t≤t (p).
From Eqs. (5), (14), and (15), one can obtain a modernized formula for the Abel inversion, i.e.,
N (p)= −1
π
t (p)
Z
−∞ ln
x
p+
s
x2 p2−1
(16)
m′aR0
q
R12−x(t )2qR2 2−x(t )2
dps(t ) dt dt; x(t )=p(t ); −∞< t≤t (p),
wherem′can be determined from the first equation Eq. (9). When the position of the spherical symmetry centre is known (for example, a centre of symmetry coincides with the centre of the Earth), Eqs. (15) and (16) are new relation-ships for solution of the RO inverse problem. Unlike the
pre-vious solution (Eq. 12), the Eqs. (15) and (16) do not con-tain the angle of refraction, and include only temporal de-pendences of the refractive attenuationX(t ), eikonal accel-eration, and impact parameter. Note that Eqs. (15) and (16) provide the Abel transform in the time domain where a layer contribution does exist. The linear part of the regular trend due to the influence of the upper ionosphere is removed be-cause the eikonal accelerationain Eq. (16) contains the sec-ond derivative of time. However, the influence of the upper ionosphere exists because it may contribute in the impact pa-rameterp(t ). Also, nonlinear contribution of the upper iono-sphere remains in the eikonal accelerationa. Therefore, Eq. (16) approximately gives that part of the refractivity altitude distribution, which is connected with the influence of a sharp plasma layer. The electron density vertical distribution in the Earth’s ionosphereNe(h) is connected at GPS frequencies with the refractivityN (h)via the following relationship:
Ne(h)= −
N (h)
40.3f 2,
(17) wheref is the carrier frequency [Hz], andNe(h)is the elec-tron content [el m−3].
2003, 02:27 UT; geographic coordinates 68.5◦N 82.8◦W) with strong quasi-regular intensity and phase variations is used. The refractive attenuations of the CHAMP RO sig-nals Xa(h),Xp(h)found from the RO signal intensity and eikonal data are shown in Fig. 5a as functions of the RO ray perigee altitude h. The eikonal accelerationa has been estimated by double differentiation of a second-power least square polynomial over a sliding time interval 1t=0.5 s. This time interval approximately corresponds to the vertical size of Fresnel zone of about 1 km since the vertical compo-nent of the RO radio ray was about 2.1 km s−1. The refrac-tive attenuationXp(h)is derived from the evaluated magni-tudea using Eq. (1), andmvalue is obtained from the or-bital data. The refractive attenuationXa(h) is derived from the RO signal intensity data by a sliding least-square polyno-mial having the same power with averaging in the time inter-val of 0.5 s. In the altitude ranges of 50–60 and 75–85 km, the refractive attenuations variations Xa(h) andXp(h) are strongly connected and may be considered as coherent os-cillations caused by sporadic layers (Fig. 5a, curves 1 and 2). Using a Hilbert numerical transform, the amplitudesAa, Ap of analytical signals related to 1−Xa(h)and 1−Xp(h)have been computed and are shown in Fig. 5b, curves 1 and 2, respectively. In the altitude range of 50–60 km, amplitudes
Aa, Apare nearly identical, but the magnitude ofAais about 1.7 times below than that ofAp. Accordingly, the displace-ment d found from Eq. (9) is negative, and a plasma layer is displaced from the RO ray perigee T in the direction to satellite L (see Fig. 1). A similar form of variations of the refractive attenuations 1−Xa(h) and 1−Xp(h) allows lo-cating the detected ionospheric layer. Displacement d cor-responding to a plasma layer recorded at the 51 km altitude of the RO ray perigee is shown in Fig. 5c. Curves 1 and 2 in Fig. 5c correspond to amplitudesAaandAp, respectively. Curve 3 describes the displacement d found using Eq. (9) from amplitudesAa, Apin the 50.7–51.4 km altitude interval. Changes indare concentrated in the altitude range of−900 to−950 km when the functionsAa, Apvary near their maxi-mal values of 0.75 and 1.36 in the ranges of 0.7≤Aa≤0.75; 1.29≤Ap≤1.36, respectively. The statistical error in the determination of ratioAa(t )
Ap(t )in Eq. (9) is minimal whenAp(t ) is maximal. If the relative error in the measurements of Ap is 5 %, according to Fig. 5c, the accuracy in the estimation ofd is about±120 km. The inclination of a plasma layer to a local horizontal directionδcalculated using Eq. (10) is ap-proximately equal to δ=8.2◦±0.2◦. The vertical gradient
dNe(h)
dh of electron density distribution Ne(h) for the given RO event is shown in Fig. 5d. Curves 1 and 2 correspond to the vertical gradient dNe(h)
dh retrieved using Eqs. (12) and (16), respectively. Curve 3 is related to the vertical gradient
dNe(h)
dh retrieved using the refractive attenuation Xa(h) and formula (Eq. 15). The real altitude of the ionospheric lay-ers is indicated on the horizontal axis in Fig. 5d. Two iono-spheric layers are seen (curves 1, 2, and 3 in Fig. 5d). The
first layer is located on lineT Lat the 110 to 120 km altitudes at a distance of 900 km from pointT (Fig. 5d, left). The sec-ond layer is located near the RO perigee at the 95 to 105 km altitudes (Fig. 5d, right). From comparison of the refractive variationsXa(h)andXp(h)(Fig. 5a, curves 1 and 2) and ver-tical gradients of the electron content (Fig. 5d), the width of sporadic E-layers is nearly equal to the altitude interval of in-tensity variations of the RO signals. From Fig. 5d, variations of the vertical gradient of electron density are concentrated in the interval−0.4×10⁶[elcm−3km−1]<dNe(h)
dh < 0.5×10 6 [elcm−3km−1]. These magnitudes of Ne(h)are typical for sporadic E-layers (Kelley and Heelis, 2009). The height in-terval of the RO signal intensity variations is nearly equal to the height interval of variations in the electron density and its gradient. It follows that the standard definition of perigee of radio ray in the RO method as a minimal value of the dis-tance of the ray path to the surface leads to an underestima-tion (bias) of layers altitude in the atmosphere (ionosphere) of Earth (or another planet). This error is zero for horizontal layers and increases with their inclination.
3.3 Separation of layers and small-scale irregularities contributions in the RO signal
The principle of locality allows one to separate the contribu-tions of layers and irregular inhomogeneities in the RO sig-nal. According to identity (5), the coherent and incoherent components of the RO atmospheric signalC(h), I (h)due to the layers and irregularities influence can be estimated as fol-lows:
C(h)=Xa(h)+Xp(h)
/2−P (h);I (h) (18)
=Xa(h)−Xp(h)
/2,
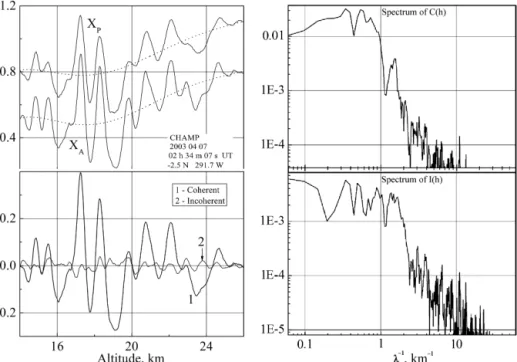
where P (h) is the polynomial approximation describing main atmospheric contribution in the RO signal. If location of the spherical symmetry centre is known,P (h)should be the same for the refractive attenuationsXa(h),Xp(h). Ex-ample of separation of the layers and inhomogeneities con-tributions in the RO signal is presented below. Figure 6 shows altitude dependences of the refractive attenuations
Xa(h),Xp(h) for the CHAMP RO event 7 April 2003 car-ried out at 02:34 UT in the area with geographical coordi-nates 2.5◦S 291.7◦W. Vertical profiles of the refractive at-tenuations Xa(h), Xp(h) reveal the coherent variations of
Figure 6.Left, top – Comparison of the refractive attenuationsXa(h),Xp(h)found from the RO intensity and eikonal data at GPS
fre-quency F1 (curvesXAandXP, respectively, displaced for comparison). Dotted curves show the polynomial approximations of the refractive
attenuationsXa(h),Xp(h). Left, bottom – Contribution of the atmospheric layers (coherent component of the RO signal) and small scale irregularities (incoherent component) (curves 1 and 2, respectively). Right – Spatial spectra of the coherent and incoherent components of the RO signal (top and bottom panels, respectively).
contribution may be assigned to effects of small-scale irregu-larities (Cornman et al., 2012). An analysis of spatial spectra of coherent and incoherent components is presented in the Fig. 6, right, top and bottom plots, respectively. The forms of spectraC(h), I (h)are similar in the interval of the verti-cal periods greater than 1 km. In the interval below 1 km, the power degrees of spectra inclination are different and equal to 3.7±0.2 and 2.1±0.2 for componentsC(h) andI (h), respectively. This indicates a different origin of the compo-nentsC(h)andI (h). The inclination of theI (h)spectrum is nearly 8/3 which corresponds to contribution of the turbulent irregularities in variations of the RO signal intensity (Gurvich and Yakushkin, 2004). The value 3.7 corresponding to the co-herent componentC(h)is near the inclination of spatial spec-trum of anisotropic internal gravity waves in accordance with the theory developed by Gurvich and Chunchuzov (2008).
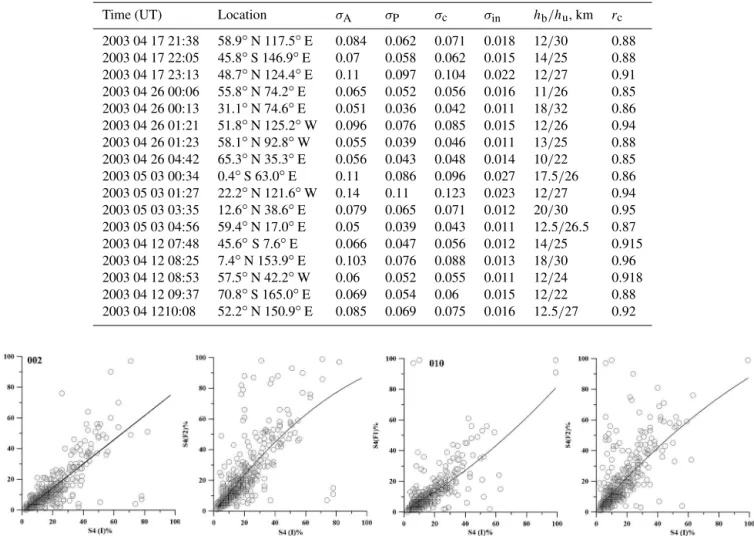
Parameters of coherent and incoherent components intro-duced in the Table 1 illustrate a possibility to separate the contributions of atmospheric layers and turbulent structures in the RO signal. The time and geographic coordinates are shown in the first two columns of Table 1. The rms devia-tionsσA, σP of the refractive attenuationsXa(h),Xp(h)and dispersion of the componentsC(h)andI (h)σc, σinare pre-sented in the next four columns. The altitude intervalhb/hu of measurements of σA, σP; σc, σin; and correlation coeffi-cientrcbetween the refractive attenuations variationsXA(h),
XP(h)are indicated in the last two columns of Table 1. As a
rule the rms deviationσcof the coherent componentC(h)is greater than that one of incoherent partI (h)σin by a factor of 4–5. This indicates on the prevailing contribution of the atmospheric layers as compared with influence of the irregu-larities in the RO signal. High level of correlationrc (in the interval 0.84–0.96) between the variations of the refractive attenuationsXa(h),Xp(h) indicates the practical and theo-retical importance of the locality principle for separation of the atmospheric layers and irregularities in the RO signal at a single frequency.
4 Relationships between eikonal variations and scintillations index S4
Table 1.Parameters of coherent and incoherent components.
Time (UT) Location σA σP σc σin hb/hu, km rc
2003 04 17 21:38 58.9◦N 117.5◦E 0.084 0.062 0.071 0.018 12/30 0.88 2003 04 17 22:05 45.8◦S 146.9◦E 0.07 0.058 0.062 0.015 14/25 0.88 2003 04 17 23:13 48.7◦N 124.4◦E 0.11 0.097 0.104 0.022 12/27 0.91 2003 04 26 00:06 55.8◦N 74.2◦E 0.065 0.052 0.056 0.016 11/26 0.85 2003 04 26 00:13 31.1◦N 74.6◦E 0.051 0.036 0.042 0.011 18/32 0.86 2003 04 26 01:21 51.8◦N 125.2◦W 0.096 0.076 0.085 0.015 12/26 0.94 2003 04 26 01:23 58.1◦N 92.8◦W 0.055 0.039 0.046 0.011 13/25 0.88 2003 04 26 04:42 65.3◦N 35.3◦E 0.056 0.043 0.048 0.014 10/22 0.85 2003 05 03 00:34 0.4◦S 63.0◦E 0.11 0.086 0.096 0.027 17.5/26 0.86 2003 05 03 01:27 22.2◦N 121.6◦W 0.14 0.11 0.123 0.023 12/27 0.94 2003 05 03 03:35 12.6◦N 38.6◦E 0.079 0.065 0.071 0.012 20/30 0.95 2003 05 03 04:56 59.4◦N 17.0◦E 0.05 0.039 0.043 0.011 12.5/26.5 0.87 2003 04 12 07:48 45.6◦S 7.6◦E 0.066 0.047 0.056 0.012 14/25 0.915 2003 04 12 08:25 7.4◦N 153.9◦E 0.103 0.076 0.088 0.013 18/30 0.96 2003 04 12 08:53 57.5◦N 42.2◦W 0.06 0.052 0.055 0.011 12/24 0.918 2003 04 12 09:37 70.8◦S 165.0◦E 0.069 0.054 0.06 0.015 12/22 0.88 2003 04 1210:08 52.2◦N 150.9◦E 0.085 0.069 0.075 0.016 12.5/27 0.92
Figure 7.Correlation of index S4(I) measured from the intensity variations of the GPS RO signal at frequency F1 and parameters S4(F1) and S4(F2) found from the eikonal variations at GPS frequencies F1 and F2.
S4(Xa)=
s
Xa2− hXai2 hXai2
;S4(Xp)=
v u u u t D
Xp2E−Xp
2
Xp2
; (19)
S4(Xa)≡S4(Xp).
Figures 7 and 8 show the results of correlation of index S4(I), defined by the variations of the intensity I at the fre-quency F1 with indices S4(F1), S4(F2) measured from the second derivative of the phase paths excess at frequencies F1, F2 during FORMOSAT-3 RO events held in January and February 2012. Circles in Figs. 7 and 8 correspond to the experimental values of index S4 (I) (vertical axis) and S4 (F1), S4(F2) (horizontal axis), respectively. The solid curves in Figs. 7 and 8 are regression lines and have been found by the least squares method. The correlation coefficient of in-dex S4(I) to S4(F1) and S4(F2) varies in the intervals 0.69 to 0.78 and 0.70–0.75, respectively. The correlation coeffi-cient of index S4(I) with combined index [S4(F1)+S4(I)]/2
is very high and changes in the interval 0.91–0.97. Measured correlation values indicate a significant contribution of regu-lar layers in ionospheric variations of the intensity and phase of the RO signals at frequencies F1, F2. High correlation be-tween variations of the indices S4(I), S4(F1), and S4(F2) in-dicates substantially lower influence of the small-scale irreg-ularities on the RO signal as compared with contribution of layered structures in the ionosphere.
5 Conclusions
Figure 8.Correlation of indices S4(I) and [S4(F1)+S4(I)]/2.
horizontal displacement of the atmospheric and ionospheric layers from the RO signal intensity and phase data using the eikonal acceleration/intensity technique; (iii) separation of layers and irregularities contributions in the RO signal, deter-mination of vertical profiles of the turbulent and small-scale structures by joint analysis of the RO signal eikonal and in-tensity variations; and (iv) introduction of the new combined phase-intensity index for the RO study of multilayered struc-tures and wave processes. This regularity is valid for every RO ray trajectory in geometrical optics approximation in-cluding reflections from the surface.
As follow from Sect. 3.1 the total absorption is stronger in the equatorial region than at high latitudes, pointing to the role of water vapour and, possible, the clouds of liquid wa-ter, ice and snow. The contribution of the clouds water (fog, rain, and hydrometeors) in the RO signal should be analyzed separately in future investigations. First of all, the theory of radio waves propagation should be reconsidered for the case when the radio waves are propagating along the clouds under different temperature conditions.
Mass-scale measurements of the total absorption at the al-titude below 15 km depend on the quality of the GPS re-ceivers onboard of the RO missions. The total absorption measurements are possible only in the case when the low and high frequency noise are small enough for coinciding of the polynomial approximation of the RO intensity and phase data at the altitudes between 15–60 km. Also the stability of the RO signal phase data and accuracy of the total absorption measurements are determined by precision of the open-loop regime of the GPS RO receivers below 8 km altitude. Analy-sis of these technological aspects of the RO measurements is the task of future works.
It follows from Sect. 3.2 that RO definition of the vertical location of layers as coinciding with the altitude of the radio ray perigee can lead to an underestimation of their height in the atmosphere (ionosphere) of Earth and other planets. This systematic bias is zero for horizontal layers and strongly in-creases with their inclination in the range 1–10◦from 1 km up to about of several dozen kilometres. The measured in-clination of layers can be applied for estimating the orien-tation of wave fronts in the ionosphere (or atmosphere) and
may be used for determination of the important parameters of internal waves including the internal frequency, direction and magnitude of kinetic momentum. A new method of esti-mating the electron density distribution in plasma layers (de-scribed in Sect. 3.2) should be a subject of future comparison with the ionosondes and tomographic data.
Mass-scale measurements of coherent and incoherent component of the RO signal (Sect. 3.3) and introduced (Sect. 4) combined phase-intensity ionospheric index are im-portant for investigation of the temporal, seasonal and re-gional evolution of the layered and turbulent structures at different altitudes in the ionosphere and atmosphere with a global coverage and can be provided in near future with us-age of extended volume of the RO data obtained during 20 years (1995–2015) of experimental researches.
Acknowledgements. We are grateful to Taiwan Centre for Space and Remote Sensing Research for access to the FORMOSAT-3 RO data. This work was supported in part by program no. 9 of the Presidium of the Russian Academy of Sciences (RAS), program IV.13 of the Physical Sciences Division RAS, and grant No. 13-02-00526-a from Russian Foundation of Basic Research. We are grateful to R. R. Salimzyanov for help in preparing the manuscript. We send special thanks to the referees for their fruitful remarks and suggestions which helped us to improve our paper.
Edited by: J. Y. Liu
References
Anthes, R. A.: Exploring Earth’s atmosphere with radio occulta-tion: contributions to weather, climate and space weather, At-mos. Meas. Tech., 4, 1077–1103, doi:10.5194/amt-4-1077-2011, 2011.
Arras, C., Wickert, J., Jacobi, Ch., Heise, S., Beyerle, G., and Schmidt, T.: A global climatology of ionospheric irregularities derived from GPS radio occultation, Geophys. Res. Lett., 35, L14809, doi:10.1029/2008GL034158, 2008.
Bai, W. H., Sun, Y. Q., Du, Q. F., Yang, G. L., Yang, Z. D., Zhang, P., Bi, Y. M., Wang, X. Y., Cheng, C., and Han, Y.: An introduc-tion to the FY3 GNOS instrument and mountain-top tests, At-mos. Meas. Tech., 7, 1817–1823, doi:10.5194/amt-7-1817-2014, 2014.
Benzon, H.-H., Nielsen, A. S., and Olsen, L.: An atmospheric wave optics propagator – theory and application, DMI, Scientific Re-port 03-01, DMI, Copenhagen, Denmark, 1–96, DMI, available at: http://www.dmi.dk/fileadmin/Rapporter/SR/sr03-01.pdf (last access: July 2015), 2003.
Beyerle, G. and Hocke, K.: Observation and simulation of direct and reflected GPS signals in Radio Occultation Experiments, Geo-phys. Res. Lett., 28, 1895–1898, 2001.
Beyerle, G., Wickert, J., Galas, R., Hocke, K., Konig, R., Mar-quardt, C., Pavelyev, A. G., Reigber, C., and Schmidt, T.: GPS occultation measurements with GPS/MET and CHAMP, Taikiken Shinpojiumu, 15, 44–47, 2001.
Beyerle, G., Hocke, K., Wickert, J., Schmidt, T., and Reig-ber, C.: GPS radio occultations with CHAMP: a radio holo-graphic analysis of GPS signal propagation in the tropo-sphere and surface reflections, J. Geophys. Res., 107, 4802, doi:10.1029/2001JD001402, 2002.
Cornman, L. B., Goodrich, R. K., Axelrad, P., and Barlow, E.: Progress in turbulence detection via GNSS occultation data, Atmos. Meas. Tech., 5, 789–808, doi:10.5194/amt-5-789-2012, 2012.
Fjeldbo, G.: Bistatic-Radar Methods for Studying Planetary Iono-spheres and Surfaces, Ph.D. thesis, Stanford University, USA, 1964.
Fjeldbo, G., Kliore, A. J., and Eshleman, V. R.: The neutral atmo-sphere of Venus as studied with the Mariner V radio occultation experiments, Astron. J., 76, 123–140, 1971.
Foelsche, U., Kirchengast, G., Steiner, A. K., Kornblueh, L., Manzini, E., and Bengtsson, L.: An observing system simulation experiment for climate monitoring with GNSS radio occultation data: Setup and test bed study, J. Geophys. Res., 113, D11108, doi:10.1029/2007JD009231, 2008.
Fong, C.-J., Shiau, W.-T., Lin, C.-T., Kuo, T.-C., Chu, C.-H., Yang, S.-K., Nick, L. Y., Chen, S.-S., Kuo, Y.-H., Liou, Y.-A., and Chi, S.: Constellation deployment for the FORMOSAT-3/COSMIC mission, IEEE T. Geosci. Remote Sens., 46, 3367–3379, 2008. Gorbunov, M. E.: Ionospheric correction and statistical optimization
of radio occultation data, Radio Sci., 37, 17-1–17-9, 2002a. Gorbunov, M. E.: Canonical transform method for processing GPS
radio occultation data in lower troposphere, Radio Sci., 37, 9-1– 9-10, doi:10.1029/2000RS002592, 2002b.
Gorbunov, M. E. and Gurvich, A. S.: Microlab-1 experiment: mul-tipath effects in the lower troposphere, J. Geophys. Res., 103, 13819–13826, 1998a.
Gorbunov, M. E. and Gurvich, A. S.: Algorithms of inversion of Microlab-1 satellite data including effects of multipath propaga-tion, Int. J. Remote Sens., 19, 2283–2300, 1998b.
Gorbunov, M. E. and Kirchengast, G.: Processing X/K Band Ra-dio Occultation Data in Presence of Turbulence, RaRa-dio Sci., 40, RS6001, doi:10.1029/2005RS003263, 2005.
Gorbunov, M. E. and Lauritsen, K. B.: Analysis of wave fields by Fourier integral operators and its application for radio oc-cultations, Radio Sci., 39, RS4010, doi:10.1029/2003RS002971, 2004.
Gorbunov, M. E., Gurvich, A. S., and Bengtsson, L.: Advanced Algorithms of Inversion of GPS/MET Satellite Data and Their Application to Reconstruction of Temperature and Humidity, re-port No. 211, Max-Planck-Institute for Meteorology, Hamburg, 40 pp., 1996.
Gorbunov, M. E., Gurvich, A. S., and Shmakov, A. V.: Back-propagation and radio-holographic methods for investigation of sporadic ionospheric E-layers from Microlab-1 data, Int. J. Re-mote Sens., 23, 675–685, 2002.
Gorbunov, M. E., Lauritsen, K. B., and Leroy, S. S.: Application of Wigner distribution function for analysis of radio occultations, Radio Sci., 45, RS6011, doi:10.1029/2010RS004388, 2010. Gubenko, V. N., Andreev, V. E., and Pavelyev, A. G.: Detection of
layering in the upper cloud layer of Venus northern polar atmo-sphere observed from radio occultation data, J. Geophys. Res., 113, E03001, doi:10.1029/2007JE002940, 2008a.
Gubenko, V. N., Pavelyev, A. G., and Andreev, V. E.: Determination of the intrinsic frequency and other wave parameters from a sin-gle vertical temperature or density profile measurement, J. Geo-phys. Res., 113, D08109, doi:10.1029/2007JD008920, 2008b. Gubenko, V. N., Pavelyev, A. G., Salimzyanov, R. R., and
Pave-lyev, A. A.: Reconstruction of internal gravity wave parameters from radio occultation retrievals of vertical temperature profiles in the Earth’s atmosphere, Atmos. Meas. Tech., 4, 2153–2162, doi:10.5194/amt-4-2153-2011, 2011.
Gurvich, A. S. and Chunchuzov, I. P.: Model of the Three-Dimensional Spectrum of Anisotropic Temperature Irregularities in a Stably Stratified Atmosphere, Izv. Atmos. Ocean. Phys., 44, 567–582, 2008.
Gurvich, A. S. and Krasil’nikova, T. G.: Navigation satellites for radio sensing of the Earth’s atmosphere, Sov. J. Remote Sens., 6, 89–93, 1987 (in Russian), 6, 1124–1131, 1990 (in English). Gurvich, A. S. and Yakushkin, I. G.: Observation of
quasi-periodical structures in the strato-sphere from space, Izv. Atmos. Ocean. Phys., 40, 737–746, 2004.
Hajj, G. A. and Romans, L. J.: Ionospheric electron density pro-files obtained with the Global Positioning System: results from GPS/MET experiment, Radio Sci., 33, 175–190, 1998.
Hajj, G. A., Ao, C. O., Iijima, B. A., Kuang, D., Kursinski, E. R., Mannucci, A. J., Meehan, T. K., Romans, L. J., de la Torre Juarez, M., and Yunck, T. P.: CHAMP and SAC-C atmospheric occultation results and intercomparisons, J. Geophys. Res., 109, D06109, doi:10.1029/2003JD003909, 2004.
Hinson, D. P., Flasar, F. M., Schinder, A., Twicken, J. D., and Her-rera, R. G.: Jupiter’s ionosphere: results from the first Galileo ra-dio occultation experiment, Geophys. Res. Lett., 24, 2107–2110, 1997.
Hinson, D. P., Simpson, R. A., Twicken, J. D., Tyler, G. L., and Flasar, F. M.: Initial results from radio occultation measure-ments with Mars Global Surveyor, J. Geophys. Res., 104, 26997– 27012, 1999.
Hocke, K.: Inversion of GPS meteorology data, Ann. Geophys., 15, 443–450, doi:10.1007/s00585-997-0443-1, 1997.
Hocke, K., Pavelyev, A., Yakovlev, O., Barthes, L., and Jakowski, N.: RO data analysis by radio holographic method, J. Atmos. Sol.-Terr. Phys., 61, 1169–1177, 1999.
the atmosphere and retrieving meteorological parameters from radio occultation data, Earth Planets Space, 52, 868–875, 2000. Igarashi, K., Pavelyev, A. G., Hocke, K., Pavelyev, D., and Wickert,
J.: Observation of wave structures in the upper atmosphere by means of radio holographic analysis of the RO data, Adv. Space Res., 27, 1321–1327, 2001.
Jensen, A. S., Lohmann, M., Benzon, H.-H., and Nielsen, A. S.: Full spectrum inversion of radio occultation signals, Radio Sci., 38, 1040, doi:10.1029/2002RS002763, 2003.
Jensen, A. S., Lohmann, M., Nielsen, A. S., and Benzon, H.-H.: Geometrical optics phase matching of radio occultation signals, Radio Sci., 39, RS3009, doi:10.1029/2003RS002899, 2004. Jakowski, N., Leitinger, R., and Angling, M.: Radio occultation
techniques for probing the ionosphere, Ann. Geophys.-Italy, 47, 1049–1066, 2004.
Joo, S., Eyre, J., and Marriott, R.: The Impact of METOP and Other Satellite Data Within the Met Office Global NWP System Us-ing an Adjoint-Based Sensitivity Method, ForecastUs-ing Research Technical Report no. 562, February, 1–18, 2012.
Kalashnikov, I. E., Matyugov, S. S., Pavelyev, A. G., and Yakovlev, O. I.: Analysis of the features of radio occultation method for the Earth’s atmosphere study, in: The Book Electromagnetic Waves in the Atmosphere and Space, Nayka Ed., Moscow, 208–218, 1986 (in Russian).
Karayel, E. T. and Hinson, D. P.: Sub-Fresnel vertical resolution in atmospheric profiles from radio occultation, Radio Sci., 32, 411– 418, 1997.
Kelley, M. C. and Heelis, R. A.: The Earth’s Ionosphere: Plasma Physics and Electrodynamics, Elsevier Science, New York, 2009. Kirchengast, G., Steiner, A. K., Foelsche, U., Kornblueh, L., Manzini, E., and Bengtsson, L.: Spaceborne climate change monitoring by GNSS occultation sensors, in: Proc. 11th Symp. Global Change Studies, AMS Ann. Meeting 2000, Long Beach, Calif., 62–65, 2000.
Kunitsyn, V. E. and Tereshchenko, E. D.: Ionospheric Tomography, Springer-Verlag, Berlin, 2003.
Kunitsyn, V. E., Nesterov, I., Padokhin, A., and Tumanova, Y.: Iono-spheric radio tomography based on the GPS/GLONASS naviga-tion systems, J. Commun. Technol. El., 56, 1269–1281, 2011. Kunitsyn, V. E., Andreeva, E., Nesterov, I., and Padokhin, A.:
Iono-spheric sounding and tomog-raphy by GNSS, in: Geodetic Sci-ences – Observations, Modeling and Applications, chapter 6, edited by: Jin, S., InTech Publisher, ISBN 978-953-51-1144-3, 354 pp., doi:10.5772/3439, 2013.
Kursinski, E. R., Hajj, G. A., Schofield, J. T., Kursinski, E. R., Hajj, G. A., Schofield, J. T., Linfield, R. P., and Hardy, K. R.: Observ-ing Earth’s atmosphere with radio occultation measurements us-ing the global positionus-ing system, J. Geophys. Res., 102, 23429– 23465, 1997.
Lindal, G. F., Wood, G. E., Hotz, H. B., Sweetnam, D. N., Eshle-man, V. R., and Tyler, G. L.: The atmosphere of Titan: an analy-sis of the Voyager 1 radio occultation measurements, Icarus, 53, 348–363, 1983.
Lindal, G. F., Lyons, J. R., Sweetnam, D. N., Eshleman, V. R., Hin-son, D. P., and Tyler, G. L.: The atmosphere of Uranus: results of radio occultation measurements with Voyager, J. Geophys. Res., 92, 14987–15001, 1987.
Liou, Y. A. and Pavelyev, A. G.: Simultaneous observations of ra-dio wave phase and intensity variations for locating the plasma
layers in the ionosphere, Geophys. Res. Lett., 33, L23102, doi:10.1029/2006GL027112, 2006.
Liou, Y.-A., Pavelyev, A. G., Huang, C.-Y., Igarashi, K., and Hocke, K.: Simultaneous observation of the vertical gradients of refrac-tivity in the atmosphere and electron density in the lower iono-sphere by radio occultation amplitude method, Geophys. Res. Lett., 29, 43-1–43-4, doi:10.1029/2002GL015155, 2002. Liou, Y.-A., Pavelyev, A. G., Huang, C.-Y., Igarashi, K., Hocke,
K., and Yan, S. K.: Analytic method for observation of the GW using RO data, Geophys. Res. Lett., 30, ASC 1-1–1-5, doi:10.1029/2003GL017818, 2003.
Liou, Y. A., Pavelyev, A. G., Pavelyev, A. A., Wickert, J., and Schmidt, T.: Analysis of atmospheric and ionospheric structures using the GPS/MET and CHAMP radio occultation data base: a methodological review, GPS Solut., 9, 122–143, 2005a. Liou, Y. A., Pavelyev, A. G., and Wickert, J.: Observation of the
gravity waves from GPS/MET radio occultation data, J. Atmos. Sol.-Terr. Phys., 67, 219–228, doi:10.1016/j.jastp.2004.08.001, 2005b.
Liou, Y. A., Pavelyev, A. G., Liu, S.-F., Pavelyev, A. A., Yen, N., Huang, C.-Y., and Fong, C.-J.: FORMOSAT-3/COSMIC GPS ra-dio occultation mission: preliminary results, IEEE T. Geosci. Re-mote, 45, 3813–3826, 2007.
Liou, Y. A., Pavelyev, A. G., Matyugov, S. S., Yakovlev, O. I., and Wickert, J.: Radio Occultation Method for Remote Sensing of the Atmosphere and Ionosphere, edited by: Liou, Y. A., IN-TECH, In-The Olajnica 19/2, 32000 Vukovar, Croatia, 170, 45 pp., ISBN 978-953-7619-60-2, 2010.
Manzini, E. and Bengtsson, L.: An observing system simulation ex-periment for climate monitoring with GNSS radio occultation data: setup and test bed study, J. Geophys. Res., 113, D11108, doi:10.1029/2007JD009231, 2008.
Marouf, E. A. and Tyler, G. L.: Microwave edge diffraction by fea-tures in Saturn’s rings: observations with Voyager 1, Science, 217, 243–245, 1982.
Melbourne, W. G.: Radio Occultations Using Earth Satellites: A Wave Theory Treatment, Jet Propulsion Laboratory California Institute of Technology, Monograph 6, Deep Space Communi-cations and Navigation Series, edited by: Yuen, J. H., the Deep Space Communications and Navigation Systems Center of Ex-cellence Jet Propulsion Laboratory California Institute of Tech-nology, 610 pp., 2004.
Melbourne, W. G., Davis, E. S., Duncan, C. B., Hajj, G. A., Hardy, K. R., Kursinski, E. R., Meehan, T. K., Young, L. E., and Yunck, T. P.: The application of spaceborne GPS to atmospheric limb sounding and global change monitoring, JPL Publication, 94-18, 147 pp., 1994.
Mortensen, M. D. and Høeg, P.: Inversion of GPS occultation mea-surements using Fresnel diffraction theory, Geophys. Res. Lett., 25, 2441–2444, 1998.
Mortensen, M. D., Lifield, R. P., and Kursinski, E. R.: Vertical res-olution approaching 100 m for GPS occultations of the Earth’s atmosphere, Radio Sci., 36, 1475–1484, 1999.
Pavelyev, A. G.: On possibility of radio holographic investigation on communication link satellite-to-satellite, J. Commun. Technol. Electron., 43, 126–132, 1998.
and Ionosphere on Earth and Other Planets, Doklady Physics, 58, 375–378, 2013.
Pavelyev, A. G. and Kucherjavenkov, A. I.: Refractive attenuation in the planetary atmospheres, Radio Eng. Electron. P., 23, 13–19, 1978.
Pavelyev, A. G., Volkov, A. V., Zakharov, A. I., Krytikh, S. A., and Kucherjavenkov A. I.: Bistatic radar as a tool for Earth observa-tion using small satellites, Acta Astronautica, 39, 721–730, 1996. Pavelyev, A. G., Liou, Y.-A., Huang, C. Y., Reigber, C., Wickert, J., Igarashi, K., and Hocke, K.: Radio holographic method for the study of the ionosphere, atmosphere and terrestrial surface using GPS occultation signals, GPS Solut., 6, 101–108, 2002. Pavelyev, A. G., Liou, Y. A., and Wickert, J.: Diffractive vector
and scalar integrals for bistatic radio-holographic remote sens-ing, Radio Sci., 39, RS4011, doi:10.1029/2003RS002935, 2004. Pavelyev, A. G., Liou, Y. A., Wickert, J., Schmidt, T., Pavelyev, A. A., and Liu, S. F.: Effects of the ionosphere and solar activity on radio occultation signals: application to CHAllenging Min-isatellite Payload satellite observations, J. Geophys. Res., 112, A06326, doi:10.1029/2006JA011625, 2007.
Pavelyev, A. G., Wickert, J., and Liou, Y.-A.: Localization of plasma layers in the ionosphere based on observing variations in the am-plitude and phase of radiowaves along the satellite-to-satellite path, Radiophys. Quantum El., 51, 1–8, 2008a.
Pavelyev, A. G., Liou, Y.-A., Wickert, J., Pavelyev, A. A., Schmidt, T., Igarashi, K., and Matyugov, S. S.: Location of layered struc-tures in the ionosphere and atmosphere by use of GPS occultation data, Adv. Space Res., 42, 224–228, 2008b.
Pavelyev, A. G., Liou, Y. A., Wickert, J., Gavrik, A. L., and Lee, C. C.: Eikonal acceleration technique for studying of the Earth and planetary atmospheres by radio occultation method, Geo-phys. Res. Lett., 36, L21807, doi:10.1029/2009GL040979, 2009. Pavelyev, A. G., Liou, Y.-A., Wickert, J., Schmidt, T., Pavelyev, A. A., and Matyugov, S. S.: Phase acceleration: a new important parameter in GPS occultation technology, GPS Solut., 14, 3–14, doi:10.1007/s10291-009-0128-1, 2010a.
Pavelyev, A. G., Liou, Y. A., Wickert, J., Zhang, K., Wang, C.-S., and Kuleshov, Y.: Analytical model of electromagnetic waves propagation and location of inclined plasma layers us-ing occultation data, Prog. Electromagn. Res., 106, 177–202, doi:10.2528/PIER10042707, 2010b.
Pavelyev, A. G., Zhang, K., Matyugov, S. S., Liou, Y. A., Wang, C. S., Yakovlev, O. I., Kucherjavenkov, I. A., and Kuleshov, Y.: Ana-lytical model of bistatic reflections and radio occultation signals, Radio Sci., 46, RS1009, doi:10.1029/2010RS004434, 2011. Pavelyev, A. G., Liou, Y. A., Zhang, K., Wang, C. S., Wickert, J.,
Schmidt, T., Gubenko, V. N., Pavelyev, A. A., and Kuleshov, Y.: Identification and localization of layers in the ionosphere using the eikonal and amplitude of radio occultation signals, Atmos. Meas. Tech., 5, 1–16, doi:10.5194/amt-5-1-2012, 2012. Pavelyev, A. G., Zhang, K., Liou, Y. A., Pavelyev, A. A., Wang,
C.-S., Wickert, J., Schmidt, T., and Kuleshov Y.: Principle of Local-ity and Analysis of Radio Occultation Data, IEEE T. Geosci. Re-mote, 51, 3240–3249, doi:10.1109/TGRS.2012.2225629, 2013. Rius, A., Ruffini, G., and Romeo, A.: Analysis of ionospheric
elec-tron density distribution from GPS/Met occultations, IEEE T. Geosci. Remote, 36, 383–394, 1998.
Schmidt, T., Heise, S., Wickert, J., Beyerle, G., and Reigber, C.: GPS radio occultation with CHAMP and SAC-C: global
moni-toring of thermal tropopause parameters, Atmos. Chem. Phys., 5, 1473–1488, doi:10.5194/acp-5-1473-2005, 2005.
Sokolovskiy, S. V.: Inversion of RO amplitude data, Radio Sci., 35, 97–105, 2000.
Sokolovskiy, S. V., Schreiner, W., Rocken, C., and Hunt, D.: Detec-tion of high-altitude ionospheric irregularities with GPS/MET, Geophys. Res. Lett., 29, 621–625, 2002.
Steiner, A. K. and Kirchengast, G.: GW spectra from GPS/MET occultation observations, J. Atmos. Ocean. Tech., 17, 495–503, 2000.
Steiner, A. K., Kirchengast, G., and Ladreiter, H. P.: Inversion, er-ror analysis, and validation of GPS/MET occultation data, Ann. Geophys., 17, 122–138, doi:10.1007/s00585-999-0122-5, 1999. Steiner, A. K., Kirchengast, G., Foelsche, U., Kornblueh, L.,
Manzini, E., and Bengtsson, L.: GNSS occultation sounding for climate monitoring, Phys. Chem. Earth Pt. A, 26, 113–124, 2001. Syndergaard, S.: Modeling the impact of the Earth’s oblateness on the retrieval of temperature and pressure profiles from limb sounding, J. Atmos. Sol.-Terr. Phy., 60, 171–180, 1998. Syndergaard, S.: Retrieval analysis and methodologies in
atmo-spheric limb sounding using the GNSS radio occultation tech-nique, DMI Sci. Rep. 99-6, Danish Met. Inst., Copenhagen, Denmark, 131 pp., available at: http://www.cosmic.ucar.edu/ groupAct/references/Sr99-6.pdf (last access: 10 January 2015), 1999.
Von Engeln, A., Andresa, Y., Marquardt, C., and Sancho, F.: GRAS Radio Occultation on-board of Metop, Adv. Space Res., 47, 336– 347, doi:10.1016/j.asr.2010.07.028, 2011.
Vorob’ev, V. V. and Krasilnikova, T. G.: Estimation of accuracy of the atmosphere refractive index recovery from Doppler shift measurements at frequencies used in the NAVSTAR system, Izv. Russ. Acad. Sci., 29, 602–609, 1994 (Engl. Transl.).
Vorob’ev, V. V., Gurvich, A. S., Kan, V., Sokolovskiy, S. V., Fe-dorova, O. V., and Shmakov, A. V.: The structure of the iono-sphere from theGPS-“Microlab-1” radio occultation data: pre-liminary results, Cosmic Res., 4, 74–83, 1997 (in Russian). Ware, R., Exner, M., Feng, D., Gorbunov, M., Hardy, K.,
Her-man, B., Kuo, Y.-H., Meehan, T., Melbourne, W., Rocken, C., Schreiner, W., Sokolovskiy, S., Solheim, F., Zou, X., Anthes, R., Businger, S., and Trenberth, K.: GPS soundings of the atmo-sphere from low earth orbit: preliminary results, B. Am. Mete-orol. Soc., 77, 19–40, 1996.
Wickert, J., Pavelyev, A. G., Liou, Y. A., Schmidt, T., Reig-ber, C., Igarashi, K., Pavelyev, A. A., and Matyugov, S.: Am-plitude scintillations in GPS signals as a possible indicator of ionospheric structures, Geophys. Res. Lett., 31, L24801, doi:10.1029/2004GL020607, 2004.
Wickert, J., Reigber, C., Beyerle, G., Konig, R., Marquardt, C., Schmidt, T., Grunwaldt, L., Galas, R., Meehan, T. K., Mel-bourne, W. G., and Hocke, K.: Atmosphere sounding by GPS ra-dio occultation: first results from CHAMP, Geophys. Res. Lett., 28, 3263–3266, 2001.
Wickert, J., Beyerle, G., König, R., Heise, S., Grunwaldt, L., Micha-lak, G., Reigber, Ch., and Schmidt, T.: GPS radio occultation with CHAMP and GRACE: A first look at a new and promis-ing satellite configuration for global atmospheric soundpromis-ing, Ann. Geophys., 23, 653–658, doi:10.5194/angeo-23-653-2005, 2005. Wickert, J., Schmidt, T., Michalak, G., Heise, S., Arras, C., Beyerle,
ra-dio occultation with CHAMP, GRACE-A, SAC-C, TerraSAR-X, and FORMOSAT-3/COSMIC: brief review of results from GFZ, in: New Horizons in Occultation Research: Studies in Atmo-sphere and Climate, edited by: Steiner, A., Pirscher, B., Foelsche, U., and Kirchengast, G., Springer, 3–16, 2009.
Yakovlev, O. I.: Space Radio Science, Taylor and Francis, London, 306 pp., 2002.
Yakovlev, O. I., Pavelyev, A. G., and Matyugov, S. S.: Radio Oc-cultation Monitoring of the Atmo-sphere and Ionosphere, URSS Edition, Moscow, 206 pp., ISBN 978-5-397-01227-0, 2010 (in Russian).
Yunck, T. P., Lindal, G. F., and Liu, C.-H.: The role of GPS in precise Earth observation, in: Proc. IEEE Position Location and Navigation Symposium (PLANS 88), 29 November–December, 1988.
Yunck, T. P., Liu, C.-H., and Ware, R.: A history of GPS sounding, Terr. Atmos. Ocean. Sci., 11, 1–20, 2000.
Zhang, K., Zhang, S., Le Marshall, J., Kirchengast, G., Norman, R., Ying Li, Liu, C., and Carter, B.: A new Australian GNSS ra-dio occultation data processing platform, in: IGNSS 2013 Sym-posium Proc., Gold Coast, Australia, ISBN 978-0-646-90640-9, Pap.85/12p., 2013.

![Figure 8. Correlation of indices S4(I) and [S4(F1)+S4(I)]/2.](https://thumb-eu.123doks.com/thumbv2/123dok_br/16438820.196595/11.918.89.841.99.285/figure-correlation-of-indices-s-i-and-s.webp)
