BGD
9, 1635–1666, 2012Ectomycorrhizal mat respiration
C. L. Phillips et al.
Title Page
Abstract Introduction
Conclusions References
Tables Figures
◭ ◮
◭ ◮
Back Close
Full Screen / Esc
Printer-friendly Version Interactive Discussion
Discussion
P
a
per
|
Dis
cussion
P
a
per
|
Discussion
P
a
per
|
Discussio
n
P
a
per
|
Biogeosciences Discuss., 9, 1635–1666, 2012 www.biogeosciences-discuss.net/9/1635/2012/ doi:10.5194/bgd-9-1635-2012
© Author(s) 2012. CC Attribution 3.0 License.
Biogeosciences Discussions
This discussion paper is/has been under review for the journal Biogeosciences (BG). Please refer to the corresponding final paper in BG if available.
Contributions of ectomycorrhizal fungal
mats to forest soil respiration
C. L. Phillips1,4, L. A. Kluber2,3, J. P. Martin3, B. A. Caldwell3, and B. J. Bond4
1
Center for Accelerator Mass Spectrometry, Lawrence Livermore National Laboratory, Livermore, CA 94550, USA
2
Department of Biology, Case Western Reserve University, 2080 Adelbert Road, Cleveland, OH 44106, USA
3
Department of Crops and Soil Science, ALS 3017, Oregon State University, Corvallis, OR 97331, USA
4
Department of Forest Ecosystems and Society, Oregon State University, Corvallis, OR 97331, USA
Received: 18 January 2012 – Accepted: 27 January 2012 – Published: 7 February 2012
Correspondence to: C. L. Phillips (claire.phillips@llnl.gov)
BGD
9, 1635–1666, 2012Ectomycorrhizal mat respiration
C. L. Phillips et al.
Title Page
Abstract Introduction
Conclusions References
Tables Figures
◭ ◮
◭ ◮
Back Close
Full Screen / Esc
Printer-friendly Version Interactive Discussion
Discussion
P
a
per
|
Dis
cussion
P
a
per
|
Discussion
P
a
per
|
Discussio
n
P
a
per
|
Abstract
Distinct aggregations of fungal hyphae and rhizomorphs, or “mats” formed by some genera of ectomycorrhizal (EcM) fungi are common features of soils in coniferous forests of the Pacific Northwest. We measured in situ respiration rates ofPiloderma
mats and neighboring non-mat soils in an old-growth Douglas-fir forest in Western
Ore-5
gon to investigate whether there was an incremental increase in respiration from mat soils, and to estimate mat contributions to total soil respiration. We found that areas wherePilodermamats colonized the organic horizon often had higher soil surface flux than non-mats, with the incremental increase in respiration averaging 16 % across two growing seasons. Both soil physical factors and biochemistry were related to the higher
10
surface flux of mat soils. When air-filled pore space was low (high soil moisture), soil CO2 production was concentrated into near-surface soil horizons where mats tend to colonize, resulting in greater apparent differences in respiration between mat and non-mat soils. Respiration rates were also correlated with the activity of chitin-degrading soil enzymes. This suggests that the elevated activity of fungal mats may be related
15
to consumption or turnover of chitinous fungal cell-wall materials. We foundPiloderma
mats present across 57 % of the soil surface in the study area, and use this value to estimate a respiratory contribution from mats at the stand-scale of about 9 % of total soil respiration. The activity of EcM mats, which includes both EcM fungi and microbial associates, was estimated to constitute a substantial portion of total soil respiration in
20
this old-growth Douglas-fir forest.
1 Introduction
Soil respiration can have substantial influences on total forest carbon balance (Trum-bore, 2006), and teasing apart component sources of soil respiration is an important step towards describing and predicting these fluxes. CO2 production by roots and
25
BGD
9, 1635–1666, 2012Ectomycorrhizal mat respiration
C. L. Phillips et al.
Title Page
Abstract Introduction
Conclusions References
Tables Figures
◭ ◮
◭ ◮
Back Close
Full Screen / Esc
Printer-friendly Version Interactive Discussion
Discussion
P
a
per
|
Dis
cussion
P
a
per
|
Discussion
P
a
per
|
Discussio
n
P
a
per
|
environmental variables (Carbone et al., 2008; Querejeta et al., 2003; Heinemeyer et al., 2007). The activity of EcM fungi, however, which are strictly speaking het-erotrophic organisms but intimately dependent on plant carbon sources, does not fit neatly into plant or microbial categories. Mycorrhizal respiration is rarely quantified di-rectly in the field, but is more often measured as a component of the pooled respiration
5
from roots and their microbial associates, and called “rhizosphere,” “autotrophic,” or even “root” respiration (Tang and Baldocchi, 2005; Irvine et al., 2008; Carbone et al., 2008).
A potential opportunity to assess ectomycorrhizal (EcM) respiration is through exam-ination of soils occupied by EcM mats. Mat-forming EcM fungi have a nearly global
dis-10
tribution (Castellano, 1988), and are common in coniferous forests of the Northwestern United States, where they form visible mats of rhizomorphs, or hyphal cords, in organic and mineral soil (Agerer, 2001, 2006). EcM mats in the Douglas-fir forests of West-ern Oregon have been the subjects of a series of studies spanning thirty years, and have been shown to have distinct biological and chemical characteristics compared
15
to adjacent soils without obvious mat development (non-mat soils). Mat characteris-tics include elevated levels of dissolved nitrogen and carbon, higher enzymatic activity, unique microbial communities, and elevated respiration rates in lab incubations (Zeglin et al., 2012; Griffiths et al., 1994; Griffiths and Caldwell, 1992; Kluber et al., 2010). Because EcM mats can be abundant, especially in late seral stands (Griffiths et al.,
20
1996; Dunham et al., 2007; Smith et al., 2000), their high metabolic activity could contribute substantially total forest soil respiration. In the present study, we employed a non-destructive approach to estimate mat contributions, by measuring the incremen-tal increase in soil surface CO2 efflux associated with mats compared to neighboring non-mat soils.
25
BGD
9, 1635–1666, 2012Ectomycorrhizal mat respiration
C. L. Phillips et al.
Title Page
Abstract Introduction
Conclusions References
Tables Figures
◭ ◮
◭ ◮
Back Close
Full Screen / Esc
Printer-friendly Version Interactive Discussion
Discussion
P
a
per
|
Dis
cussion
P
a
per
|
Discussion
P
a
per
|
Discussio
n
P
a
per
|
a deciduous oak system. While physical exclosures greatly reduce the abundance of hyphae and/or roots, some trade-offs include the tendency to increase soil mois-ture, reduce labile soil carbon inputs, and the elimination of non-target genera such as saprotrophic fungi.
Investigating soil respiration rates of natural areas with and without EcM mats may
5
provide a technique that complements other partitioning methods, without severing connections to surrounding soil. Previous work indicates the presence or absence of mat-forming fungi has fewer confounding correlates than comparisons of bulk soil with hyphal exclosures. Rhizomorphic mats in the organic soil horizon have shown similar soil water content and root abundance as non-mat soils (Griffiths et al., 1990; Kluber
10
et al., 2010). Recent molecular analyses of mat and non-mat soils also showed that non-mat soils are not devoid of fungi, but rather may be dominated by non-rhizomorphic fungi, including both EcM and saprotrophic fungi, that are less visible to the naked eye (Kluber et al., 2011).
Although non-mat soils do not strictly exclude EcM fungi, comparisons of mat and
15
non-mat soils may nevertheless help elucidate the respiratory contributions of EcM fungi by indicating how aggregations of one particularly abundant EcM genus alters soil CO2 fluxes. Working in an old-growth forest (300–500 yr) at the HJ Andrews Ex-perimental Forest in Oregon, USA, we sought to quantify differences in soil surface CO2 flux between mats in the Piloderma genus and non-mat soils. Piloderma is the
20
most common mat-forming EcM genus at HJ Andrews (Dunham et al., 2007), and its mats are easily recognized and delineated from non-mat soils by thick white or yellow rhizomorphs in the organic horizon.
Measuring respiration rates across two growing seasons, our primary research ques-tion was: (1) Is there an incremental increase in soil surface CO2flux fromPiloderma
25
BGD
9, 1635–1666, 2012Ectomycorrhizal mat respiration
C. L. Phillips et al.
Title Page
Abstract Introduction
Conclusions References
Tables Figures
◭ ◮
◭ ◮
Back Close
Full Screen / Esc
Printer-friendly Version Interactive Discussion
Discussion
P
a
per
|
Dis
cussion
P
a
per
|
Discussion
P
a
per
|
Discussio
n
P
a
per
|
soil enzyme activities? Finally, we sought to scale-up to the stand-level and inquire (4) what is the abundance of EcM mats across the stand, and what proportion of stand-level soil respiration is associated with EcM mats?
2 Materials and methods
2.1 Site description
5
The 0.1 ha study site was located at the HJ Andrews Experimental Forest, part of the Willamette National Forest, Oregon, USA (44◦13′25′′N, 122◦15′30′′W, 484 m above sea level). EcM mats are common at HJ Andrews, and we choose this site in part because it contained sufficient not-mat areas to provide contrasts with mat-colonized soils, and it has also been examined in previous studies (Zeglin et al., 2012; Dunham
10
et al., 2007; Kluber et al., 2011; Griffiths et al., 1996). The forest was ∼450 yr old,
dominated by Douglas-fir (Psuedotsuga menziesii) and western hemlock (Tsuga het-erophylla), both hosts for many EcM species, and western redcedar (Thuja plicata), a host for arbuscular mycorrhizal fungi, which do not form mats. Fallen logs in ad-vanced stages of decay were common. The soil has strong andic properties and is
15
classified as coarse loamy mixed mesic Typic Hapludands (Dixon, 2003), with an O-horizon depth of 4–9 cm.
This region experiences a Mediterranean (xeric) climate, with cool, moist winters and warm, dry summers. At this elevation snow accumulation is generally minimal; however, the winter during which the study was performed experienced record snow
20
levels, with snow persisting from late December 2007–April 2008.
2.2 Identification of fungal mats
For the purposes of this study, mats were defined as dense profusions of rhizomorphs that aggregate humus or soil, are associated with obvious EcM root tips, and are uni-form in structure and appearance for a depth of at least 2 cm and an area at least
BGD
9, 1635–1666, 2012Ectomycorrhizal mat respiration
C. L. Phillips et al.
Title Page
Abstract Introduction
Conclusions References
Tables Figures
◭ ◮
◭ ◮
Back Close
Full Screen / Esc
Printer-friendly Version Interactive Discussion
Discussion
P
a
per
|
Dis
cussion
P
a
per
|
Discussion
P
a
per
|
Discussio
n
P
a
per
|
12 cm in diameter. This definition is adapted from Dunham et al. (2007), who devel-oped a criteria with input from Griffiths and Cromack to be consistent with earlier EcM mat studies (Cromack et al., 1979; Griffiths et al., 1990). Dunham et al. characterized the distribution of mat-forming EcM species in the organic and mineral soil horizons across the H. J. Andrews Experimental Forest, and showed thatPiloderma
(Basidiomy-5
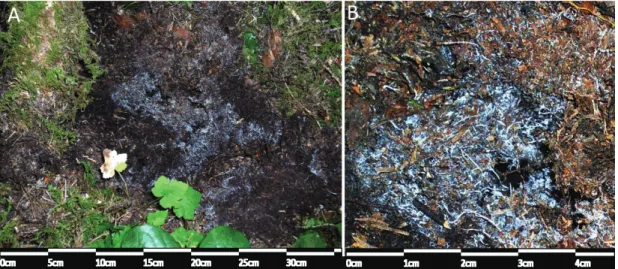
cota; Agaricomycotina; Agaricomycetes; Agaricomycetidae; Atheliales; Atheliaceae) was the most common and widespread genera colonizing organic soils. Piloderma
mats appear as stringy white or yellow rhizomorphs that permeate the organic soil horizon (Fig. 1). We initially identified mats asPiloderma-like visually in the field, and later confirmed their identity using molecular approaches (described below).
10
Mat and non-mat areas were identified by conducting an initial survey of the site in July 2006. We randomly choose 50, 1×1 m quadrats to quantify mat percent cover. We
peeled back the bryophyte layer to expose the organic horzion to search forPiloderma
mats, and then gently lifted the organic layer to look for other mat genera that colonize the mineral-organic soil interface. We determined our site had a very low occurrence
15
of mats at the mineral soil interface (Table 1), therefore we focused our subsequent work only onPiloderma-like mats and non-mat areas. We estimated the area occupied by each mat by multiplying the average width and length from 3 to 5 measurements in each major axis. We also quantified the area occupied by large roots or downed logs that prevented colonization of the organic horizon, and thus determined two values for
20
mat cover: the percentage of exposed soil available to be colonized by mats, and the percentage of the entire surveyed area.
We identified 21 areas that were suitable for paired respiration measurements, con-taining dense mats adjacent to distinctly non-rhizomorphic soil (≤1 m apart). To
mini-mize potential rhizomorph colonization in non-mat areas over the course of the
exper-25
BGD
9, 1635–1666, 2012Ectomycorrhizal mat respiration
C. L. Phillips et al.
Title Page
Abstract Introduction
Conclusions References
Tables Figures
◭ ◮
◭ ◮
Back Close
Full Screen / Esc
Printer-friendly Version Interactive Discussion
Discussion
P
a
per
|
Dis
cussion
P
a
per
|
Discussion
P
a
per
|
Discussio
n
P
a
per
|
To confirm that the mats used in this study were indeed formed by Piloderma, we used terminal restriction fragment lengthpolymorphism (T-RFLP) analysis as described by Kluber et al. (2011). This method has been shown to be robust and reliable because the T RFLP profiles ofPilodermamats are distinct and dominated by a characteristic Piloderma fragment (Kluber et al., 2011). A small amount of soil (∼10 g) was sampled
5
in June 2008 adjacent to each respiration measurement area, and the entire respira-tion measurement area (∼100 g) was resampled again at the completion of respiration measurements, to assess whetherPilodermapersisted as the dominant phylotype over time.
2.3 Soil respiration measurements
10
Soil surface CO2 efflux rates were measured with a portable gas exchange system and soil efflux chamber (Li-Cor model 6400 and 6400-19, respectively, LI-COR Bio-sciences, Lincoln, NE, USA). To provide an interface between the soil and the respi-ration chamber, collars constructed from schedule 40 PVC pipe were pushed∼1 cm into the organic horizon. Each individual respiration measurement covered 80.3 cm2
15
of ground surface. Any potential severing of roots or hyphae appeared to be minimal because the thick soil humus tended to compress under the collar rims. Soil collars were installed 48 h prior to initial measurements and left in place for the duration of the study. Bryophytes and small green plants growing inside the collars were removed, and a plug of unrooted bryophytes was replaced in the collar between measurement
20
dates to mimic surrounding ground cover.
BGD
9, 1635–1666, 2012Ectomycorrhizal mat respiration
C. L. Phillips et al.
Title Page
Abstract Introduction
Conclusions References
Tables Figures
◭ ◮
◭ ◮
Back Close
Full Screen / Esc
Printer-friendly Version Interactive Discussion
Discussion
P
a
per
|
Dis
cussion
P
a
per
|
Discussion
P
a
per
|
Discussio
n
P
a
per
|
2.4 Temporal variation in mat respiration increment
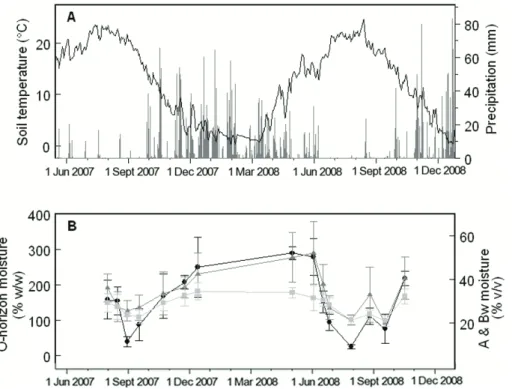
Soil temperature and moisture were measured concurrently with respiration measure-ments, and analyzed as potential seasonal drivers of mat respiration increment. Tem-perature at 10 cm depth was measured by inserting a probe adjacent to the respiration collars. We measured gravimetric water content in the O-horizon, and at 5 and 15 cm
5
below the mineral soil surface, by collecting soil cores from five small coring fields es-tablished across the study area, and associating each soil collar with moisture values from the nearest coring field.
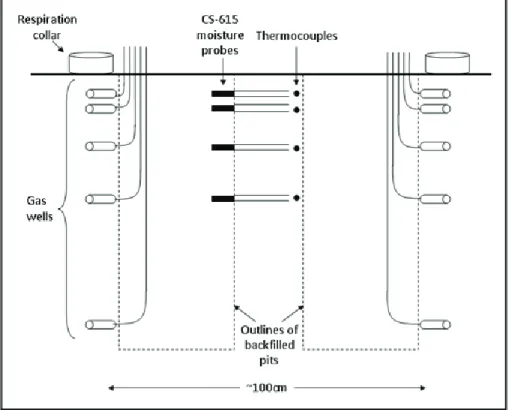
To better understand how moisture variability may effect soil surface flux rates, we also established instrumented soil profiles in two area – one mat-dominated and one
10
non-mat-dominated – to calculate the relative contributions of sub-surface horizons to surface flux (Fig. 2). Previous work has shown the contributions of the O-horizon can vary seasonally with soil moisture (Davidson et al., 2006), which implies that surface flux measurements may not be equally sensitive to differences between mat and non-mat activity throughout the year. We anticipated that as soils dried down, surface
15
fluxes would originate from deeper, wetter soils, and relative contributions from the O-horizon would decrease. To test this, we vertically partitioned CO2 production at our site following the approach of Davidson et al. (2006), in which CO2fluxes derived from each soil horizon are modeled according to Fick’s first law of diffusion:
F=DS d C
d z (1)
20
whereF is CO2efflux (mmol m
−2
s−1),DSis the effective CO2diffusivity in soil (m 2
s−1), Cis CO2mole concentration, andzis depth. We calculated fluxes approximately every 2 months during the growing season, based on CO2 concentrations collected from 30 ml gas wells that we drilled into the interfaces between genetic soil horizons from a hand-dug trench. We estimated DS as described by Moldrup et al. (1999), using
25
BGD
9, 1635–1666, 2012Ectomycorrhizal mat respiration
C. L. Phillips et al.
Title Page
Abstract Introduction
Conclusions References
Tables Figures
◭ ◮
◭ ◮
Back Close
Full Screen / Esc
Printer-friendly Version Interactive Discussion
Discussion
P
a
per
|
Dis
cussion
P
a
per
|
Discussion
P
a
per
|
Discussio
n
P
a
per
|
each depth (temperature with Type-T thermocouple, Omega Corp, and moisture with CS-615 TDR probe, Campbell Scientific, Logan, Utah, USA).
CO2 samples were collected into 12 ml Exetainer™ vials (Labco, UK), which were pre-flushed with N2 and evacuated in the field with a handpump. CO2 samples were analyzed within 48 h in the laboratory using a LiCor-6252 infrared gas analyzer
(LI-5
COR Biosciences, Lincoln, NE, USA) configured for injection of small volumes (David-son and Trumbore, 1995). A calibration curve was created by injecting standard gases to translate peak height to CO2concentration. The combined standard uncertainties of the measurements, which include sampling and instrument uncertainties (NIST guide-lines, Taylor and Kuyatt, 1994), was determined based on replicate analyses to be
10
3.8 % of CO2concentration.
We quantified production in each horizon as the difference between fluxes leaving the top and entering the bottom of each horizon. For the O-horizon, production was estimated as the difference between surface efflux and the incoming flux from the A-horizon. Production from the C-horizon and below was estimated as the flux of CO2
15
from the top of the C-horizon.
2.5 Spatial drivers of mat and non-mat respiration
We conducted a number of analyses to assess potential factors influencing spatial variation in soil surface flux. In addition to the twelve long-term measurement loca-tions described above, at the outset of the study we randomly chose an additional 9
20
Pilodermamat and 5 non-mat soils for one time destructive sampling. After measur-ing surface CO2 efflux at each location, we removed cores to measure root biomass, substrate quality as indicated by %C and %N, soil pH, moisture, and litter depth. Soil cores 8 cm in diameter were separated into 4 depth increments: the entire O-horizon, 0–10 cm, 10–20 cm, and 20–35 cm below the mineral soil surface. Fine root (<2 mm
25
BGD
9, 1635–1666, 2012Ectomycorrhizal mat respiration
C. L. Phillips et al.
Title Page
Abstract Introduction
Conclusions References
Tables Figures
◭ ◮
◭ ◮
Back Close
Full Screen / Esc
Printer-friendly Version Interactive Discussion
Discussion
P
a
per
|
Dis
cussion
P
a
per
|
Discussion
P
a
per
|
Discussio
n
P
a
per
|
analyzing 3–10 mg subsamples on a Costech ECS-4010 elemental combustion ana-lyzer (Costech Analytical, Valencia, CA, USA) against an atropine standard.
At the completion of the study in November 2008, we also destructively har-vested the long-term respiration measurement locations and analyzed the activity of chitin-degrading enzyme, N-acetyl-b-D-glucosaminidase (chitinase or NAGase), as
de-5
scribed by Kluber et al. (2010). We chose to focus on this enzyme because a survey of EcM mat enzyme activity across HJ Andrews showed that chitinase was the only enzyme to differ significantly betweenPilodermamats and non-mat soils (Kluber et al., 2010). Chitinase has also been shown by others to correlate strongly with independent measures of fungal biomass (Miller et al., 1998). Here we examined whether chitinase
10
activity correlated with soil surface CO2flux rate.
2.6 Data analysis
We tested whether the respiration increment between neighboring mat and non-mat pairs was different from zero in each year of the study using a linear mixed effects model, with pair location as a random effect, and a linear correlation matrix to
ac-15
commodate unequal sampling intervals over time (Pinheiro and Bates, 2000). Results from 2006 and 2007 were analyzed independently due to large differences in moisture conditions and in respiration magnitude and variance.
To examine correlations between mat respiration increment and moisture and tem-perature, we started by describing respiration at each location as an exponential
func-20
tion of temperature and moisture (Martin and Bolstad, 2005):
F=aeβ1T+β2M (2)
whereF is surface flux,T is soil temperature, andM is soil moisture. To linearize this equation we took the natural logarithm of each side
lnF =lnα+β1T+β2M (3)
BGD
9, 1635–1666, 2012Ectomycorrhizal mat respiration
C. L. Phillips et al.
Title Page
Abstract Introduction
Conclusions References
Tables Figures
◭ ◮
◭ ◮
Back Close
Full Screen / Esc
Printer-friendly Version Interactive Discussion
Discussion
P
a
per
|
Dis
cussion
P
a
per
|
Discussion
P
a
per
|
Discussio
n
P
a
per
|
and calculated the difference between neighboring mat (Fm) and non-mat soils (Fnm) as follows:
lnFm−lnFnm=ln
F
m Fnm
=lnRm (4)
whereRmis the ratio of mat and non-mat fluxes, or mat respiration increment. Mat res-piration increment was related to the average temperature (Tave) and O-horizon
mois-5
ture (Mave) for each neighboring mat and non-mat pair as follows:
lnRm=lnα+β1Tave+β2Mave (5)
We solved for coefficients in Eq. (5) using a statistical linear mixed effects model, with temperature and moisture as fixed effects, pair location as a random effect, and a linear correlation matrix for the variance-covariance structure to account for repeated
mea-10
sures.
We also examined whether any of the soil properties from destructively-harvest cores correlated with respiration rates by analyzing individual linear regressions for each soil property. For the vertical partitioning analysis, we used Monte Carlo simulations to propagate uncertainties for component measurements and calculate overall
uncertain-15
ties for production from each horizon. All analyses were performed with S-PLUS v.8.
3 Results
3.1 EcM mat respiration increment
Visual checks of rhizomorph abundance indicated most mat and non-mat soils re-mained stable over the course of the study; however, in the second growing season, we
20
BGD
9, 1635–1666, 2012Ectomycorrhizal mat respiration
C. L. Phillips et al.
Title Page
Abstract Introduction
Conclusions References
Tables Figures
◭ ◮
◭ ◮
Back Close
Full Screen / Esc
Printer-friendly Version Interactive Discussion
Discussion
P
a
per
|
Dis
cussion
P
a
per
|
Discussion
P
a
per
|
Discussio
n
P
a
per
|
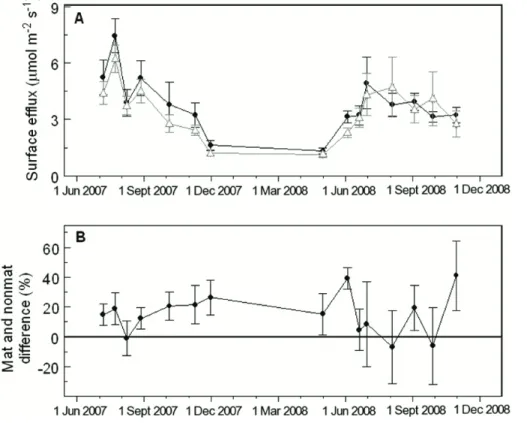
The difference in respiration between neighboring mat and non-mat pairs was greater than zero on most, but not all, sampling dates (Fig. 3). Surface flux fromPiloderma
mats averaged 17 % higher than non-mat soil during the first growing season (95 % CI=10–25 %), and 16 % higher in the second growing season (95 % CI=7–27 %). However, the mat respiration increment was especially variable in the second year of
5
the study. In early June 2008 there was a notable high, but brief, spike in mat respiration increment, with mat surface flux averaging almost 40 % higher than non-mat surface flux. When we sampled again only two weeks later mat the respiration increment was not statistically different from zero and remained low throughout the summer. Mat respiration increment was again high following fall wet-up in November 2008, but with
10
greater spatial variability than previous sampling dates.
3.2 Seasonal variation
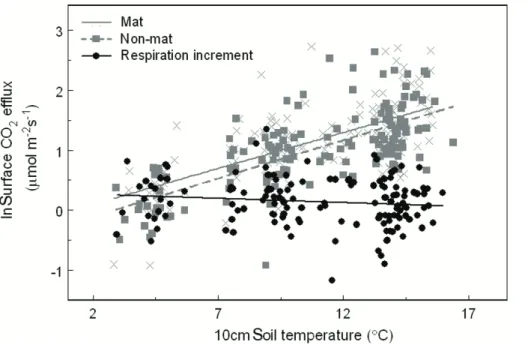
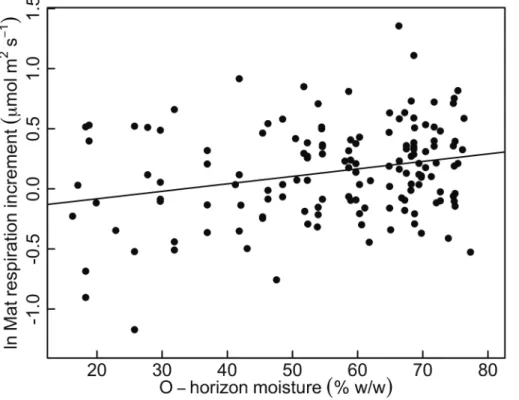
While raw surface CO2efflux rates from both mat and non-mat soils correlated strongly with soil temperature, mat respiration increment did not show a relationship with soil temperature (Fig. 5). Mat respiration increment did, however, track closely with soil
15
moisture (Figs. 3, 4). O-horizon soil moisture was a significant predictor of mat respira-tion increment (P <0.001), and for every 10 % increase in moisture, the mat respiration increment increased by 8 % (95 % CI=3.6–13.9 %, Fig. 6).
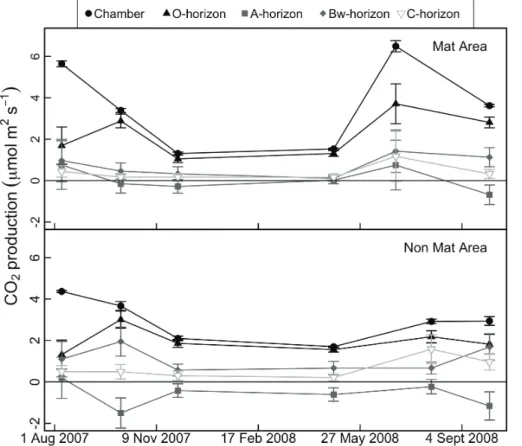
We also found correlations between soil moisture and the estimated proportion of soil respiration produced in the O-horizon (Fig. 7). From analyses of CO2 profiles
20
in mat and non-mat areas of the study site, the estimated contributions from the O-horizon averaged 73 % of total surface flux (95 % CI=61–85 %), but ranged from as much as 93 % in May, when snow had just melted and the ground was essentially saturated, to 37 % in August, when the soil was extremely dry (4–6 % water content at the O/A interface). CO2 contributions from the A-horizon were small when calculated
25
BGD
9, 1635–1666, 2012Ectomycorrhizal mat respiration
C. L. Phillips et al.
Title Page
Abstract Introduction
Conclusions References
Tables Figures
◭ ◮
◭ ◮
Back Close
Full Screen / Esc
Printer-friendly Version Interactive Discussion
Discussion
P
a
per
|
Dis
cussion
P
a
per
|
Discussion
P
a
per
|
Discussio
n
P
a
per
|
mineral soil. The errors associated with these negative production values were large, however, due to variable CO2concentrations.
Overall, the vertical partitioning results indicate that when soils were moist, the ma-jority of surface efflux originated from shallow depths wherePilodermacolonizes, with only minor contributions from sub-mat deeper soil. Under dry conditions in the late
5
summer, however, the source of CO2 appeared to shift to deeper soil horizons (see August 2007 and July 2008). Correlations between CO2 production and soil moisture measured in each horizon (Fig. 9) indicate that the B and C horizons tended to in-crease CO2 production as soil dried, suggesting that high moisture in the spring and fall may actually suppress aerobic respiration in deep soil layers. As deeper soil layers
10
dry through the summer, increases in CO2production from deep horizons may make it more difficult to detect differences between mat and non-mat organic soil.
3.3 Spatial variation
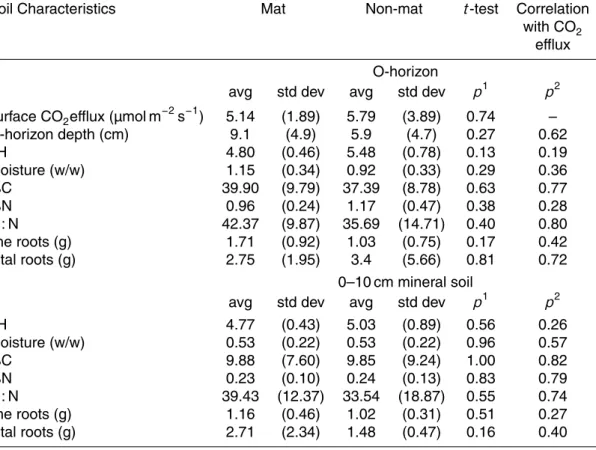
From cores sampled at the outset of the study, we found no significant individual corre-lations between respiration rate and soil moisture, fine root biomass, total root biomass,
15
%C, %N, C : N ratio, or litter depth (Table 2). Furthermore, none of the soil characteris-tics, including respiration, differed significantly between mat and non-mat soils for this set of non-paired soil locations.
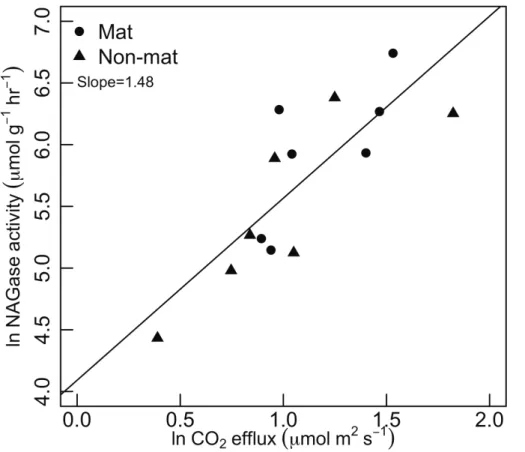
We did, however, find a significant correlation between respiration rate and NAGase activity, from cores collected at the end of the study (Fig. 9). Chitinase activity explained
20
68 % of the variance in soil surface respiration. Chitinase activity of mats was about 40 % higher than neighboring non-mat soils (1.23 vs. 0.77 mmol substrate h−1, one-tailedP =0.055 for pairedt-test).
3.4 Stand-level cover and respiration fromPiloderma mats
Surveys of the 0.1 ha study area revealed almost half of the forest floor contained EcM
25
BGD
9, 1635–1666, 2012Ectomycorrhizal mat respiration
C. L. Phillips et al.
Title Page
Abstract Introduction
Conclusions References
Tables Figures
◭ ◮
◭ ◮
Back Close
Full Screen / Esc
Printer-friendly Version Interactive Discussion
Discussion
P
a
per
|
Dis
cussion
P
a
per
|
Discussion
P
a
per
|
Discussio
n
P
a
per
|
and mats colonizing the mineral-soil surface occupied another 1.9 %. Trees, coarse roots, and coarse woody debris also covered about 23 % of the soil surface. Excluding these areas that prevented mat colonization, almost 57 % of the available soil surface was occupied byPiloderma-like mats, and 2.6 % was occupied by mats at the mineral soil surface.
5
To estimate the contribution of Piloderma mats to total soil respiration across the whole study area, we multiplied the percent cover ofPilodermamats (56.6 %) by the average mat respiration increment. We estimated that Piloderma mats contributed 9.6 % of total soil respiration in the first, wetter, year (95 % CI=10–14 %) and 9.1 % in the second, drier, year (95 % CI=4–15 %).
10
4 Discussion
We found generally higher surface CO2efflux from mat soils compared to neighboring non-mat soils, with an average incremental difference of about 16 % across the 2007 and 2008 growing seasons. The in situ differences between mat and non-mat respi-ration measured here, although substantial, were much smaller than differences
mea-15
sured in previous lab incubation studies. Griffiths et al. (1990) sampled rhizomorphic mat and non-mat soil cores monthly over two years, and consistently found respiration rates three to 11 times higher in mat soils, although these large differences may have resulted in part from disturbance and severing of fungal hyphae. In addition, we likely detected a smaller difference between mat and non-mats soils because in situ efflux
20
measurements include CO2contributions from deeper soil horizons, which could mute differences within the organic horizon. Although our vertical partitioning analysis in-dicates that most CO2 production occurs within the organic horizon, we showed that the contributions of CO2 from deep soil horizons and changes in vertical partitioning over time, are important characteristics of soil CO2fluxes that are missed by laboratory
25
BGD
9, 1635–1666, 2012Ectomycorrhizal mat respiration
C. L. Phillips et al.
Title Page
Abstract Introduction
Conclusions References
Tables Figures
◭ ◮
◭ ◮
Back Close
Full Screen / Esc
Printer-friendly Version Interactive Discussion
Discussion
P
a
per
|
Dis
cussion
P
a
per
|
Discussion
P
a
per
|
Discussio
n
P
a
per
|
Seasonal variations in mat respiration increment corresponded with soil moisture, but not with temperature. Heinemeyer et al. (2007) arrived at a similar conclusion in their field study of EcM hyphal respiration, finding that the difference in respiration rate between mesh exclosures containing EcM hyphae, and solid exclosures containing no EcM hyphae, corresponded with soil moisture but not temperature. Our estimates
5
of vertical partitioning bring into question, however, whether the apparent moisture sensitivity of EcM respiration is directly related to hyphal activity, or may also be due in part to a shift in the production of CO2,from shallow horizons where most roots and
EcM fungi are found (Erland and Taylor, 2002), to deeper soil horizons where EcM fungi are less prevalent. In lab incubations, Griffiths et al. (1991) found no relationship
10
between soil moisture and mat respiration increment, which suggests that the seasonal changes we observed in mat respiration increment may be related more to shifts in vertical partitioning of soil flux.
Spatial variability in respiration rate did not correlate with %C, %N, litter depth, or soil moisture, nor was there a systematic difference in these factors between mat and
non-15
mat soils. We also found root biomass was similar in mat and non-mat soils, consistent with previous EcM mat studies (Griffiths et al., 1990). For these non-adjacent mat and non-mat core analyzed at the outset of the study, however, we also found no significant differences in surface CO2 efflux rate. It appears necessary to compare soils in close proximity to each other to detect respiration differences between soil types.
20
Across the paired, long-term measurement locations, we found higher chitinase ac-tivities in mat soils than non-mats, and a significant correlation between respiration rate and chitinase activity across both soil types. A possible interpretation of this correlation is that fungal hyphae and rhizomorphs provide an important source of carbon and nitro-gen in the form of chitinous cell walls, which stimulates enzyme production. Although
25
BGD
9, 1635–1666, 2012Ectomycorrhizal mat respiration
C. L. Phillips et al.
Title Page
Abstract Introduction
Conclusions References
Tables Figures
◭ ◮
◭ ◮
Back Close
Full Screen / Esc
Printer-friendly Version Interactive Discussion
Discussion
P
a
per
|
Dis
cussion
P
a
per
|
Discussion
P
a
per
|
Discussio
n
P
a
per
|
to recycle chitin-N (Aerts, 2002), and other soil microbes may produce NAGase to advantageously utilize chitin (Miller et al., 1998).
Zeglin et al. (2012) recently examined the ability of mat and non-mat soils to utilize chitin, and found that additions of chitin to incubated soils, or its monomeric build-ing block N-acetyl glucosamine (NAG), consistently induced increases in respiration,
5
N-mineralization, and biomass accumulation. Furthermore, the magnitude of chitin-induced respiration was almost two times greater in mat than non-mat soils, suggest-ing mat-associated microbial communities were better able to utilize chitin compounds than non-mat communities. These findings support the notion that the abundance of chitin in EcM mats is an important driver of carbon and nitrogen cycling.
10
The notion that EcM mat respiration may be related to chitin abundance suggests that it may be inappropriate to group EcM respiration together with roots as “au-totrophic” soil respiration. It suggests a component of EcM mat respiration is consump-tion of fungal-derived rather than plant-derived carbon sources, and that mat respiraconsump-tion is perhaps better delineated with heterotrophic soil respiration. In addition to intimate
15
connections with tree hosts, mat-forming EcM fungi are intimately associated with dis-tinct bacterial and fungal communities (Kluber et al., 2010), and chitin-degradation ap-pears to play an important role in the activity of these mat communities (Zeglin et al., 2012).
Nevertheless, most experimental methods for estimating root respiration are unable
20
to achieve reasonable physical separation of roots and EcM fungal hyphae, thus their respiratory contributions are generally measured together. We compared our esti-mates ofPiloderma mat contributions to estimates of rhizosphere respiration (root + EcM fungi) from a site less than 1 km from our study area and at similar elevation (44◦14′0′′N, 122◦13′0′′W, 531 m elevation), part of the Detritus Input and Removal
25
BGD
9, 1635–1666, 2012Ectomycorrhizal mat respiration
C. L. Phillips et al.
Title Page
Abstract Introduction
Conclusions References
Tables Figures
◭ ◮
◭ ◮
Back Close
Full Screen / Esc
Printer-friendly Version Interactive Discussion
Discussion
P
a
per
|
Dis
cussion
P
a
per
|
Discussion
P
a
per
|
Discussio
n
P
a
per
|
this suggestsPilodermamats, which we found contributed about 16 % of total soil respi-ration, may have accounted for almost 40 % of rhizosphere respiration in this old-growth Douglas-fir forest. A more conservative estimate that considers only the wet year of their study, the most similar to our conditions in 2007, indicates that EcM mats may have contributed 32 % of rhizosphere respiration
5
Previous studies have also indicated a large EcM fungal component of rhizosphere respiration. Using a mass balance approach, Fahey et al. (2005) estimated 17 % of rhizosphere respiration was from mycorrhizal fungi and rhizodeposition, although the authors acknowledged this estimate had high uncertainty. Heinemeyer et al. (2007) estimated that EcM hyphal respiration was about 70 % of rhizosphere respiration in an
10
early seral lodgepole pine forest. The variability among these estimates is not unlike the variability seen in estimates of total rhizosphere respiration, which varies with forest type as well as with estimation technique (Subke et al., 2006; Bond-Lamberty et al., 2004). Despite the range in values, our results contribute to a growing consensus that EcM respiration is a substantial component of rhizosphere respiration, and indicates
15
EcM contributions are significant both in early and late seral forests.
We recommend EcM mats as a useful system for examining in situ the effects of EcM rhizomorphs on soil carbon cycling. Despite some limitations of EcM mat mea-surements, including inherent spatial variation in mat size, density, and microbial com-position (Kluber et al., 2011), and variable underlying soil conditions, the advantages of
20
comparing mat and non-mat soils were that soils were generally stable in rhizomorph density across two growing seasons and were resilient to the presence of soil col-lars and repeated probing. In the future, measurements with automated soil chambers would be useful to elucidate high-frequency dynamics of mat activity, including potential relationships with photosynthetic carbon supply. In addition toPilodermamats, which
25
BGD
9, 1635–1666, 2012Ectomycorrhizal mat respiration
C. L. Phillips et al.
Title Page
Abstract Introduction
Conclusions References
Tables Figures
◭ ◮
◭ ◮
Back Close
Full Screen / Esc
Printer-friendly Version Interactive Discussion
Discussion
P
a
per
|
Dis
cussion
P
a
per
|
Discussion
P
a
per
|
Discussio
n
P
a
per
|
Acknowledgements. We thank Dave Myrold, Jane Smith, and Doni McKay for providing labo-ratory resources and intellectual guidance, and Erik Lilleskov for an insightful review. Facilities and data were provided by the HJ Andrews Experimental Forest research program, funded by the National Science Foundation’s Long-Term Ecological Research Program (DEB 08-23380), US Forest Service Pacific Northwest Research Station, and Oregon State University. Additional
5
funding was provided by the Northwest Scientific Association. This manuscript was completed under the auspices of the US Department of Energy, identifiedLLNL-JRNL-523171.
References
Aerts, R.: The role of various types of mycorrhizal fungi in nutrient cycling and plant competition, in: Mycorrhizal ecology, edited by: van der Heijden, M. G. A. and Sanders, I. R., Ecological
10
studies, Springer-Verlag, Berlin, 117–133, 2002.
Agerer, R.: Exploration types of ectomycorrhizae, Mycorrhiza, 11, 107–114, doi:10.1007/s005720100108, 2001.
Agerer, R.: Fungal relationships and structural identity of their ectomycorrhizae, Mycol. Prog., 5, 67–107, doi:10.1007/s11557-006-0505-x, 2006.
15
Bond-Lamberty, B., Wang, C., and Gower, S. T.: A global relationship between the heterotrophic and autotrophic components of soil respiration?, Global Change Biol., 10, 1756–1766, 2004. Carbone, M. S., Winston, G. C., and Trumbore, S.: Soil respiration in perennial grass and shrub
ecosystems: linking environmental controls with plant and microbial sources on seasonal and diel timescales, J. Geophys. Res., 113, G02022, doi:10.1029/2007JG000611, 2008.
20
Castellano, M. A.: The taxonomy of the genus hysterangium (basidiomycotina, hysteran-giaceae) with notes on its ecology, Ph.D., For. Sci., Oregon State University, Corvallis, OR, 238 pp., 1988.
Cromack, K., Sollins, P., Graustein, W. C., Speidel, K., Todd, A. W., Spycher, G., Li, C. Y., and Todd, R. L.: Calcium oxalate accumulation and soil weathering in mats of the hypogeous
25
fungushysterangium crassum, Soil Biol. Biochem., 11, 463–468, 1979.
Davidson, E. A. and Trumbore, S. E.: Gas diffusivity and production of CO2in deep soils of the Eastern Amazon, Tellus B, 47, 550–565, 1995.
BGD
9, 1635–1666, 2012Ectomycorrhizal mat respiration
C. L. Phillips et al.
Title Page
Abstract Introduction
Conclusions References
Tables Figures
◭ ◮
◭ ◮
Back Close
Full Screen / Esc
Printer-friendly Version Interactive Discussion
Discussion
P
a
per
|
Dis
cussion
P
a
per
|
Discussion
P
a
per
|
Discussio
n
P
a
per
|
of CO2 production within a temperate forest soil, Global Change Biol., 12, 944–956, doi:10.1111/j.1365-2486.2005.01142.x, 2006.
Dixon, J. J.: Applying gis to soil-geomorphic landscape mapping in the Lookout Creek Val-ley, Western Cascades, Oregon, M. S., Crops and Soil Science, Oregon State University, Corvallis, 2003.
5
Dunham, S. M., Larsson, K.-H., and Spatafora, J. W.: Diversity and community structure of mat-forming ectomycorrhizal fungi in old growth and rotation age douglas-fir forests fo the hj Andrews Experimental Forest, Oregon, USA, Mycorrhiza, 17, 633–645, 2007.
Erland, S. and Taylor, A.: Diveristy of ecto-mycorrhizal fungal communities in relation to the abiotic environment, in: Mycorrhizal Ecology, edited by: van der Heijden, M. G. A. and
10
Sanders, I. R., Springer-Verlag, Berlin, 163–201, 2002.
Fahey, T., Tierney, G., Fitzhugh, R., Wilson, G., and Siccama, T.: Soil respiration and soil carbon balance in a northern hardwood forest ecosystem, Can. J. Forest Res., 35, 244–253, 2005.
Griffiths, R. P. and Caldwell, B. A.: Mycorrhizal mat communities in forest soils, in:
Mycor-15
rhizae in Ecosystems, edited by: Read, D. J., Lewis, D. H., Fitter, A. H., and Alexander, I. J., Cambridge University Press, Cambridge, 98–105, 1992.
Griffiths, R. P., Caldwell, B. A., Cromack Jr, K., and Morita, R. Y.: Douglas-fir forest soils colo-nized by ectomycorrhizal mats. I. Seasonal variation in nitrogen chemistry and nitrogen cycle transformation rates, Can. J. Forest Res., 20, 211–218, 1990.
20
Griffiths, R. P., Catellano, M. A., and Caldwell, B. A.: Hyphal mats formed by two ectomycor-rhizal fungi and their association with douglas-fir seedlings: a case study, Plant Soil, 134, 225–259, 1991.
Griffiths, R. P., Baham, J. E., and Caldwell, B. A.: Soil solution chemistry of ectomycorrhizal mats in forest soil, Soil Biol. Biochem., 26, 331–337, 1994.
25
Griffiths, R. P., Bradshaw, G. A., Marks, B., and Lienkaemper, G. W.: Spatial distribution of ectomycorrhizal mats in coniferous forests of the Pacific Northwest, USA, Plant Soil, 180, 147–158, 1996.
Hasselquist, N. J., Vargas, R., and Allen, M. F.: Using soil sensing technologies to examin interactions and controls between ectomycorrhizal growth and environmental factors on soil
30
CO2dynamics, Plant Soil, 331, 17–29, 2010.
BGD
9, 1635–1666, 2012Ectomycorrhizal mat respiration
C. L. Phillips et al.
Title Page
Abstract Introduction
Conclusions References
Tables Figures
◭ ◮
◭ ◮
Back Close
Full Screen / Esc
Printer-friendly Version Interactive Discussion
Discussion
P
a
per
|
Dis
cussion
P
a
per
|
Discussion
P
a
per
|
Discussio
n
P
a
per
|
Global Change Biol., 13, 1786–1797, 2007.
Heinemeyer, A., Wilkinson, M., Vargas, R., Subke, J.-A., Casella, E., Morison, J. I. L., and Ine-son, P.: Exploring the “overflow tap” theory: linking forest soil CO2fluxes and individual myc-orrhizosphere components to photosynthesis, Biogeosciences, 9, 79–95, doi:10.5194/bg-9-79-2012, 2012.
5
Irvine, J., Law, B., Martin, J., and Vickers, D.: Interannual variation in soil CO2 efflux and the response of root respiration to climate and canopy gas exchange in mature ponderosa pine, Global Change Biol., 14, 2848–2859, 2008.
Kluber, L. A., Tinnesand, K. M., Caldwell, B. A., Dunham, S. M., Yarwood, R. R., Bottom-ley, P. J., and Myrold, D. D.: Ectomycorrhizal mats alter forest soil biogeochemistry, Soil Biol.
10
Biochem., 42, 1607–1613, 2010.
Kluber, L. A., Smith, J. E., and Myrold, D. D.: Distinctive fungal and bacterial communities are associated with mats formed by ectomycorrhizal fungi, Soil Biol. Biochem., 43, 1042–1050, 2011.
Martin, J. G. and Bolstad, P. V.: Annual soil respiration in broadleaf forests of Northern
Wiscon-15
sin: influence of moisture and site biological, chemical, and physical characteristics, Biogeo-chemistry, 73, 149, 2005.
Miller, M., Palojarvi, A., Rangger, A., Reeslev, M., and Kjoller, A.: The use of fluorogenic sub-strates to measure fungal presence and activity in soil, Appl. Environ. Microbiol., 64, 613– 617, 1998.
20
Moldrup, P., Olesen, T., Yamaguchi, T., Schjønning, P., and Rolston, D. E.: Modeling diffusion and reaction in soils: Ix. The buckingham-burdine-campbell equation for gas diffusivity in undisturbed soil, Soil Sci., 164, 542–551, 1999.
Pinheiro, J. C. and Bates, D. M.: Mixed-Effects Models in s and s-plus, Springer Verlag, New York, 528 pp., 2000.
25
Querejeta, J. I., Egerton-Warburton, L. M., and Allen, M. F.: Direct nocturnal water transfer from oaks to their mycorrhizal symbionts during severe soil drying, Oecologia, 134, 55–64, 2003. Smith, J. E., Molina, R., Huso, M., and Larsen, M. J.: Occurrence ofpiloderma fallaxin young,
rotation-age, and old-growth stands of douglas-fir (pseudotsuga menziesii) in the cascade range of oregon , USA, Can. J. Botany, 78, 995–1001, 2000.
30
BGD
9, 1635–1666, 2012Ectomycorrhizal mat respiration
C. L. Phillips et al.
Title Page
Abstract Introduction
Conclusions References
Tables Figures
◭ ◮
◭ ◮
Back Close
Full Screen / Esc
Printer-friendly Version Interactive Discussion
Discussion
P
a
per
|
Dis
cussion
P
a
per
|
Discussion
P
a
per
|
Discussio
n
P
a
per
|
Sulzman, E. W., Brant, J. B., Bowden, R. D., and Lajtha, K.: Contribution of aboveground litter, belowground litter, and rhizosphere respiration to total soil CO2efflux in an old growth coniferous forest, Biogeochemistry, 73, 231–256, 2005.
Tang, J. and Baldocchi, D. D.: Spatial and temporal variation in soil respiration in an oak-grass savanna ecosystem in california and its partitioning into autotrophic and heterotrophic
5
components, Biogeochemistry, 73, 183–207, 2005.
Taylor, B. N. and Kuyatt, C. E.: Nist technical note 1297: guidelines for evaluating and ex-pressing the uncertainty of nist measurement results, National Institute of Standards and Technology, US Dept. of Commerce, Technology Administration, 1994.
Trumbore, S. E.: Carbon respired by terrestrial ecosystems–recent progress and challenges,
10
Global Change Biol., 12, 141–153, 2006.
Vargas, R. and Allen, M. F.: Environmental controls and the influence of vegetation type, fine roots and rhizomorphs on diel and seasonal variation in soil respiration, New Phyt., 179, 460–471, doi:10.1111/j.1469-8137.2008.02481.x, 2008.
Zeglin, L. H., Kluber, L. A., and Myrold, D. D.: The importance of amino sugar turnover to
15
BGD
9, 1635–1666, 2012Ectomycorrhizal mat respiration
C. L. Phillips et al.
Title Page
Abstract Introduction
Conclusions References
Tables Figures
◭ ◮
◭ ◮
Back Close
Full Screen / Esc
Printer-friendly Version Interactive Discussion
Discussion
P
a
per
|
Dis
cussion
P
a
per
|
Discussion
P
a
per
|
Discussio
n
P
a
per
|
Table 1. Percent of soil surface occupied by: coarse plant material (which prevented mat col-onization), mats at the mineral-soil surface,Piloderma-like fungal mats in the organic horizon, and non-mat soil.
Tree boles, EcM Mats Non mat
roots, and CWD
Mineral-soil surface Piloderma-like
Total area 22.8 % 1.9 % 42.2 % 33.2 %
BGD
9, 1635–1666, 2012Ectomycorrhizal mat respiration
C. L. Phillips et al.
Title Page
Abstract Introduction
Conclusions References
Tables Figures
◭ ◮
◭ ◮
Back Close
Full Screen / Esc
Printer-friendly Version Interactive Discussion
Discussion
P
a
per
|
Dis
cussion
P
a
per
|
Discussion
P
a
per
|
Discussio
n
P
a
per
|
Table 2.Average characteristics for mat (n=9) and non-mat (n=5) soils cored 7 July 2007. No significant differences were found between mat and non-mat soils, and none of the variables in the organic horizon or 0–10 cm mineral soil correlated with surface CO2efflux.
Soil Characteristics Mat Non-mat t-test Correlation
with CO2 efflux
O-horizon
avg std dev avg std dev p1 p2
surface CO2efflux (µmol m−2s−1) 5.14 (1.89) 5.79 (3.89) 0.74 –
O-horizon depth (cm) 9.1 (4.9) 5.9 (4.7) 0.27 0.62
pH 4.80 (0.46) 5.48 (0.78) 0.13 0.19
moisture (w/w) 1.15 (0.34) 0.92 (0.33) 0.29 0.36
%C 39.90 (9.79) 37.39 (8.78) 0.63 0.77
%N 0.96 (0.24) 1.17 (0.47) 0.38 0.28
C : N 42.37 (9.87) 35.69 (14.71) 0.40 0.80
fine roots (g) 1.71 (0.92) 1.03 (0.75) 0.17 0.42
total roots (g) 2.75 (1.95) 3.4 (5.66) 0.81 0.72
0–10 cm mineral soil
avg std dev avg std dev p1 p2
pH 4.77 (0.43) 5.03 (0.89) 0.56 0.26
moisture (w/w) 0.53 (0.22) 0.53 (0.22) 0.96 0.57
%C 9.88 (7.60) 9.85 (9.24) 1.00 0.82
%N 0.23 (0.10) 0.24 (0.13) 0.83 0.79
C : N 39.43 (12.37) 33.54 (18.87) 0.55 0.74
fine roots (g) 1.16 (0.46) 1.02 (0.31) 0.51 0.27
total roots (g) 2.71 (2.34) 1.48 (0.47) 0.16 0.40
1Two-sided test for di
fference between mat and non-mat soils. 2One-sided test for Pearson’s correlation coe
BGD
9, 1635–1666, 2012Ectomycorrhizal mat respiration
C. L. Phillips et al.
Title Page
Abstract Introduction
Conclusions References
Tables Figures
◭ ◮
◭ ◮
Back Close
Full Screen / Esc
Printer-friendly Version Interactive Discussion
Discussion
P
a
per
|
Dis
cussion
P
a
per
|
Discussion
P
a
per
|
Discussio
n
P
a
per
|
Fig. 9. Relationship between NAGase (chitinase) enzyme activity and soil surface flux.