www.biogeosciences.net/11/6173/2014/ doi:10.5194/bg-11-6173-2014
© Author(s) 2014. CC Attribution 3.0 License.
Does soil moisture overrule temperature dependence of soil
respiration in Mediterranean riparian forests?
C. T. Chang1,2, S. Sabaté1,2, D. Sperlich1,2, S. Poblador2, F. Sabater2, and C. Gracia1,2 1CREAF, Cerdanyola del Vallès, 08193, Spain
2Departament d’Ecologia, Universitat de Barcelona (UB), 08028, Barcelona, Spain
Correspondence to:C. T. Chang (chaoting@creaf.uab.es)
Received: 29 April 2014 – Published in Biogeosciences Discuss.: 3 June 2014
Revised: 9 September 2014 – Accepted: 26 September 2014 – Published: 13 November 2014
Abstract. Soil respiration (SR) is a major component of ecosystems’ carbon cycles and represents the second largest CO2flux in the terrestrial biosphere. Soil temperature is con-sidered to be the primary abiotic control on SR, whereas soil moisture is the secondary control factor. However, soil mois-ture can become the dominant control on SR in very wet or dry conditions. Determining the trigger that makes soil mois-ture as the primary control factor of SR will provide a deeper understanding on how SR changes under the projected fu-ture increase in droughts. Specific objectives of this study were (1) to investigate the seasonal variations and the rela-tionship between SR and both soil temperature and moisture in a Mediterranean riparian forest along a groundwater level gradient; (2) to determine soil moisture thresholds at which SR is controlled by soil moisture rather than by tempera-ture; (3) to compare SR responses under different tree species present in a Mediterranean riparian forest (Alnus glutinosa, Populus nigraandFraxinus excelsior). Results showed that
the heterotrophic soil respiration rate, groundwater level and 30 cm integral soil moisture (SM30) decreased significantly from the riverside moving uphill and showed a pronounced seasonality. SR rates showed significant differences between tree species, with higher SR for P. nigraand lower SR for A. glutinosa. The lower threshold of soil moisture was 20 and 17 % for heterotrophic and total SR, respectively. Daily mean SR rate was positively correlated with soil temperature when soil moisture exceeded the threshold, withQ10values ranging from 1.19 to 2.14; nevertheless, SR became decou-pled from soil temperature when soil moisture dropped be-low these thresholds.
1 Introduction
Soil is the largest pool of terrestrial organic carbon in the bio-sphere, storing around 2344 Pg C in the top 3 m (Jobbágy and Jackson, 2000). Soil respiration (SR) is the main source of carbon efflux from ecosystems to the atmosphere, account-ing for 60–90 % of the total ecosystem respiration (Schimel et al., 2001; Raich et al., 2002). Thus, SR plays an impor-tant role in the global carbon balance (Schimel et al., 2001; Raich et al., 2002), and even small changes of SR may in-duce positive feedbacks to climate change (Schlesinger and Andrews, 2000). Therefore, information of how SR inter-acts with environmental conditions, such as the response of specific components of soil respiration to temperature and moisture changes, will be a key part of the improvement of process-based models.
between SR and soil temperature, both very high and very low soil moisture have been shown to diminish the tempera-ture response of SR (Londo et al., 1999; Welsch and Horn-berger, 2004) due to the potential oxygen limitations under high soil moisture (Skopp et al., 1990) and due to metabolic drought stress under very low soil moisture (Orchard and Cook, 1983). Soil moisture also affects plant composition and productivity (Häring et al., 2013) and thus controls the quantity and quality of both soil organic matter (SOM) and root exudate supply (Rustad et al., 2000).
Numerous studies have reported the effects of temperature and moisture on SR. However, studies about the combined effects of both factors are relatively few, and the information of how soil moisture affects the relationship between soil temperature and SR is scarce (Bowden et al., 1998; David-son et al., 2006; Curiel-Yuste et al., 2007). In Mediterranean and semiarid ecosystems, SR is highly sensitive to soil mois-ture, and the temperature-driven increases in SR are likely dampened by low soil moisture (Conant et al., 2004; Raich and Potter, 1995; Rey et al., 2002). It is still unclear under which circumstances or environmental conditions would the primary control factor of SR switch from temperature to soil moisture.
SR can be divided into autotrophic and heterotrophic res-piration by different biological sources (Hanson et al., 2000). Autotrophic respiration, also known as root respiration, is mainly dependent on NPP and tree physiology such as photo-synthesis substrate supply (Heinemeyer et al., 2007; Hogberg et al., 2001). Heterotrophic respiration is the sum of micro-bial decomposition of SOM (Fang et al., 2005; Knorr et al., 2005). In theory, due to the different origins of autotrophic and heterotrophic respiration, they may have different sensi-tivities toward environmental factors and respond differently to seasonality (Epron et al., 2001; Kuzyakov and Larionova, 2006; Yan et al., 2010).
Riparian areas are characterized with high soil moisture and sustained water table. (McGlynn and Seibert, 2003). In these ecosystems, tree species composition and tree growth are strongly influenced by the topographic position concomi-tant with the changes in the soil water content. Thus, this may indirectly affect SR through litter input and nutrient availabil-ity. Because of the retardation of microbial decomposition with the frequent saturation of soil water, riparian areas tend to accumulate more SOM than hillslope areas do (Sjögersten et al., 2006).
The main objectives of this study were (1) to investigate the seasonal variations and relationships between SR and both soil temperature and moisture in a Mediterranean ripar-ian forest along a groundwater level gradient; (2) to deter-mine soil moisture thresholds at which SR is controlled by soil moisture rather than by temperature, even in such non-water-stressed environments; (3) to compare SR responses under different tree species present in a Mediterranean ripar-ian forest (Alnus glutinosa, Populus nigraandFraxinus ex-celsior). With these aims, we carried out measurements of
SR under different tree species along a groundwater level gradient in a riparian forest in NE Spain. The results of our study may help to better the understanding of the interactions between different components of SR with soil temperature and moisture as well as the role of different tree species. It also provides relevant information for SR model parameteri-zation.
2 Material and methods 2.1 Site description
The experiment was conducted in a riparian forest grow-ing along the Font de Regàs stream, a headwater trib-utary of the Tordera River, in Montseny Natural Park (north of Barcelona; 41◦50′N, 2◦30′E, altitudinal range 300–1200 m a.s.l.). The forest community of our study site consists of black alder (Alnus glutinosa L.), black locust
(Robinia pseudoacaciaL.), common ash (Fraxinus excelsior
L.) and black poplar (Populus nigra L.). As result of
wa-ter and nutrient availability,A. glutinosaandP. nigra trees
are mostly distributed near the river, whereas F. excelsior
trees are located further away on the upper site, near the hill.R. pseudoacaciatrees are scattered over the study area
and were not monitored. Mean annual temperature is 12◦C with maximum and minimum average temperatures of 14 and 10◦C, respectively. The mean annual precipitation is 872 mm (1951–2010). The riparian soil is sandy loam with low rock content (<13 %), weakly acidic (pH of 6.7) and has an average bulk density of 1.09 g cm−3.
2.2 Experimental design
We divided the groundwater gradient (riparian–hillslope transect) into four levels according to the distance from the riverside and by tree species composition (Fig. 1). The dis-tances of level 1 to level 4 (L1 to L4) from the river centre were 2.7, 4.4, 6.8 and 11.8 m, respectively. The three target tree species,A. glutinosa, P. nigraandF. excelsiorwere
F. excelsior
L1 L2 L3 L4
A. glutinosa P. nigra
F. excelsior
River
2.7m 1.7m 2.4m 5 m
Figure 1.Sketch of levels along a gradient of soil water availability with tree species distribution and SRHchamber positions.
into the PVC tube and covered by 65 µm mesh to prevent root growth through the windows.
Stainless steel rings were inserted permanently into the soil, down to 3 cm depth as the base of the soil chambers, and kept free from seedlings throughout the experiment du-ration. The distances of each soil chamber from the riverside varied slightly due to the tree distribution.
2.3 Field measurement
SR and soil temperatures were measured seasonally from summer 2011 to autumn 2012. These measurements were conducted continuously for 1 week within each season. A heavy rainfall event took place in winter 2012, resulting in elevated water levels of the river that washed away most of the litter layer within 3 m from the river bank.
CO2concentration was measured in situ with an automatic changeover open system. The system consists of an infrared gas analyser (IRGA, LiCor 6262, LiCor, Inc., Lincoln, NE, USA), a data logger (CR10, Campbell Scientific Inc., UT, USA), 12 pairs of channels, 12 soil chambers, 12 pairs of ro-tameters, 6 pumps and 2 flowmeters. Each pair of channels consists of two tubes connected to a soil chamber, one at-tached on the top of chamber (reference CO2concentration) and another attached at the base for calculating the incre-ment of CO2 concentration provided by SR. Soil chambers were placed at the beginning of each field campaign, and CO2concentrations were analysed and recorded sequentially over 1 min intervals at each chamber. Air was continuously forced through all chambers by pumps. Only one chamber was connected at a time to the IRGA to analyse the CO2 concentration of the respective chamber, while air from the others was exhausted to the atmosphere until their own turn. The sequence was programmed every 4 cycles of differential IRGA measurements from 12 chambers, and an additional
cycle of absolute IRGA measurement, which was then used to calculate the actual absolute ambient air concentration of CO2in ppm. The CO2concentration of the ambient air was determined as the difference between the scrubbed sample, which flows through soda lime and Mg(ClO4)2, and the am-bient air sample.
Soil chambers were protected by placing a 50 cm×50 cm
green fine mesh on top to avoid possible heating by direct sunlight during the measurements. Soil temperature of 5 cm depth was continuously measured with Pt100 temperature sensors and recorded in parallel with the CO2concentration analysis. Thirty centimetre integral soil moisture (cm3cm−3, SM30) in each level were determined and recorded half-hourly with a moisture reflectometer (CS616, Campbell Sci-entific). Additionally, we also measured 5 cm integral soil moisture (SM5) next to each soil chamber once per day dur-ing each measurdur-ing field campaign with impedance probes (ThetaProbe soil moisture sensor, MI2x, Delta-T Devices, Cambridge, UK). A grid of 28 wells (PVC tubes of 35 mm in diameter) was installed to monitor groundwater table oscilla-tion. Wells were distributed along the study site and at differ-ent distances from the stream: 2.7, 4.4, 6.8, 11.8 m (n=7).
Groundwater levels were monitored manually every 2 weeks using a sounding device with acoustic and light signal (Ei-jkelkamp Agrisearch Equipment). In autumn of 2012, af-ter concluding the measurements, litaf-ter layer and soil sam-ples (15 cm depth) inside each chamber were collected. Litter layer samples were weighted after oven drying at 65–70◦C for 24 h. Soil samples were first oven dried at 105◦C and then analysed to determine their organic carbon and nitrogen content by using the Walkley–Black and Kjeldahl methods, respectively.
2.4 Statistical analysis
Statistical analyses were performed with PASW statistics 18 (SPSS Inc., 2009, Chicago, IL, USA). The missing data of soil temperatures were estimated from air temperature values based on a regression analyses between air and soil tempera-tures. SR, soil temperature and soil moisture data were anal-ysed using ANOVA to examine whether seasonal SR rates were different between levels and tree species. Data used to test the significance in ANOVA were based on daily means. Least significant difference (LSD) was used to detect differ-ences between levels and tree species for each season. We used regression analysis to examine the relationship between SR and soil temperature. An univariate exponential equation was fitted (van ’t Hoff, 1898):
SR=aebT, (1)
where SR is soil respiration rate (µmol C m−2s−1),T is soil temperature (◦C),aandbare fitted parameters.
The apparentQ10was calculated as
Table 1.Soil carbon and nitrogen content and dry weight of litter L and F organic horizons from soil respiration chambers.
Groundwater level C/N SOC % Nitrogen% Litter Layer (kg m−2)
L2 – Near river 10.40 2.73 0.16 0.97 L3 – Intermediate 10.00 4.38 0.26 1.20
L4 – Uphill 9.15 3.36 0.23 1.67
L1 –A. glutinosa 12.13 2.29 0.11 0.69
L2 –P. nigra 10.27 3.52 0.20 1.18
L3 –F. excelsior 9.67 4.85 0.30 2.21
AQ10value for the whole measurement period was com-puted for each topographic position and tree species on the basis of daily average SR rate and soil temperature. In addi-tion, we estimated specificQ10 values for summer of 2011 and 2012. Data collected were fitted to the exponential equa-tion. In order to understand the interaction between soil tem-perature and soil moisture and the effect of soil moisture on regulating SR, we applied recursive partitioning analysis to search for the threshold of soil moisture. As models based on partitioning can only handle linear models, the Eq (1) was transformed by linearizing with logarithms:
ln SR=lna+bT (3)
Logarithmic transformed SR values were used as the depen-dent variable. Once the soil moisture thresholds were ob-tained, linear and nonlinear regression analyses were used to determine the relationship between SR, soil temperature and soil moisture at each soil moisture interval. The recur-sive partitioning analysis was conducted in the Rstatistical environmental using thepartypackage (Zeileis et al., 2008).
3 Results
3.1 Seasonal variation of groundwater level, soil moisture, soil nitrogen and carbon content Seasonal variation of air temperature and precipitation was remarkable. The precipitation in 2011 was significantly higher than in 2012, especially in summer. Summer precip-itation in 2011 was 4 times higher (183 mm) than in 2012 (39 mm). SM30 was significantly higher at L1 (Fig. 2). In summer 2012, due to a remarkable drought, SM30at L1 only showed a small decrease with respect to summer 2011; while at the other levels (L2, L3 and L4) SM30was markedly de-creased. Groundwater levels showed no seasonal variation but were significantly different between them.
Soil near the river contained less organic carbon and ni-trogen, but a higher C : N ratio, with a C : N ratio of 12.13 (Table 1). Soil C : N ratio decreased from the riverside going uphill, whereas the dry weight of litter layer increased from the riverside going uphill. The largest amount of dry weight of litter layer was found under F. excelsior, and coincided
Figure 2.Seasonal changes of summer 2011 (Su 11), autumn 2011 (Au 11), winter 2012 (Wi 12), spring 2012 (Sp 12) summer 2012 (Su 12) and autumn 2012 (Au12) in(a)mean seasonal air tempera-ture and precipitation;(b)30 cm integral soil moisture (SM30);(c) groundwater level, value represents the depth of groundwater level from soil surface (L1, L2, L3 and L4).
with the highest soil organic carbon (SOC) and soil nitrogen concentrations between all levels.
3.2 Seasonal variation of SRHalong hillslope transect
SRH rates ranged from 0.17 µmol C m−2s−1(in winter, L4) to 1.69 µmol C m−2s−1(in summer, L2, Fig. 3a–d). SR
H de-creased significantly from riparian zone (L2) to hill zone (L4), especially in summer. SRH measured from different levels were significantly different in all seasons (P <0.05). SRH at L2 had a higher variability during the whole ex-periment. Minimum soil temperature coincided with maxi-mum SM5 in winter while maximum soil temperature was recorded in summer when SM5 was lowest. SRH varied markedly during the year following the change of soil tem-perature from summer 2011 to spring 2012, and the changes of SM5for summer and autumn 2012. As expected, SRHwas lower during winter when soil temperatures were the lowest of the year, and SRHwas higher during the growing season.
3.3 Tree species and topographic effects on SRtotand SM30
The observed variation of SRtot for the three tree species followed the change of soil temperature over the year (Fig. 3e–h). SRtotofP. nigrawas the highest one, especially
during summer, and SRtotofA. glutinosawas the lowest one
Table 2.Comparison of soil respiration rates (SR), soil moisture (SM) andQ10values in 2011 and 2012 summer campaigns. Heterotrophic SR (SRH). Total SR (SRtot). Five centimetre integral soil moisture (SM5). Thirty centimetre integral soil moisture (SM30).
SR (µmol C m−2s−1) SM5(%) SM30(%) Q10 Chamber 2011 2012 Reduction 2011 2012 Reduction 2011 2012 Reduction 2011 2012
SRH L2 – Near river 1.65 0.84 49 % 27.10 14.94 45 % 22.22 14.51 35 % 1.09 0.76 L3 – Intermediate 0.98 0.70 28 % 31.68 14.91 53 % 12.60 9.22 27 % 1.04 0.88 L4 – Uphill 0.74 0.50 32 % 38.02 14.19 63 % 10.87 8.13 25 % 0.97 0.84
SRtot L1 –A. glutinosa 1.24 0.78 37 % 27.24 13.04 52 % 42.49 36.58 14 % 1.31 0.80
L2 –P. nigra 1.42 1.13 21 % 26.22 12.93 51 % 22.22 14.51 35 % 1.17 0.63
L3 –F. excelsior 1.26 0.76 40 % 26.45 12.87 51 % 12.60 9.22 27 % 1.40 1.14
All data of SR, SM5and SM30were significantly different between 2011 and 2012. AllPvalues<0.001.
Table 3.Comparison of soil respiration rates (SR) and soil moisture (SM) after a rainfall event of 13.5 mm in summer 2012. Heterotrophic SR (SRH). Total SR (SRtot). Five centimetre integral soil moisture (SM5). Thirty centimetre integral soil moisture (SM30). Data were averaged for the 2 days before and 2 days after the rainfall event.
SR (µmol C m−2s−1) SM
5(%) SM30(%)
Chamber before after increase before after increase before after increase
SRH L2 – Near river 0.66 1.00 52 % 14.09 18.84 34 % 14.45 14.50 0 % L3 – Intermediate 0.59 0.80 34 % 15.19 18.37 21 % 8.46 10.15 20 % L4 – Uphill 0.41 0.59 45 % 12.06 17.51 45 % 6.97 9.64 38 %
SRtot L1 –A. glutinosa 0.67 1.04 54 % 11.27 16.91 50 % 36.13 37.48 4 %
L2 –P. nigra 0.99 1.66 68 % 10.86 18.86 74 % 14.45 14.50 0 %
L3 –F. excelsior 0.68 0.98 44 % 11.10 17.20 55 % 8.46 10.15 20 %
towards a higher SM5underF. excelsior. SM30 was signifi-cantly different between levels for all seasons. The variation of SM30at L1 was lower and showed less seasonal variabil-ity, maintaining most of the SM30 values around 40 %. Dur-ing both summers 2011 and 2012, SM30 at L3 dropped to around 10 %, which is even lower than the SM5at L4 where F. excelsioris found.
3.4 Drought and rain pulse effects on SR
The low precipitation of summer 2012 caused a significant reduction of around 50 % of SM5, 14–35 % of SM30 and at the same time a reduction of SR between 21 and 49 %. TheQ10values ranged from 0.97–1.40 in summer 2011 and 0.63–1.14 in summer 2012 (Table 2).
A rainfall event (13.5 mm) during the measurement period of summer 2012 caused a significant increase of soil moisture and SR rates at all levels (L1 to L4). The SM5 increased around 21–74 % after the rafall event even though it only caused a 0–38 % in-crease of the SM30 (Table 3). This rainfall event caused a sharp increase of SR from 0.41–0.99 µmol C m−2s−1 to 0.59–1.66 µmol C m−2s−1, which corresponds to an increase of SR around 34 to 68 %.
3.5 The switch of primary control factor of SR
Table 4.Exponential relationships between soil respiration (SR) and soil temperature (T), andQ10for different SM5intervals. Heterotrophic SR (SRH). Total SR (SRtot). (SM5) is 5 cm integral soil moisture.
SM5>23 % 23 %>SM5>20 % SM5<20 %
Fn R2 Q10 Fn R2 Q10 Fn R2 Q10
SRH L2 – Near river SRH=0.52e0.05T 0.77∗∗∗ 1.58 SR
H=0.68e0.02T 0.74∗ 1.25 SR
H=2.10e0.4T 0.58∗∗ 0.02
L3 – Intermediate SRH=0.51e0.04T 0.72∗∗∗ 1.49 SR
H=0.67e0.05T 0.70∗ 1.65 SR
H=2.11e−0.04T 0.57∗∗ 0.66
L4 – Uphill SRH=0.40e0.05T 0.84∗∗∗ 1.58 SR
H=0.64e0.02T 0.66∗ 1.19 SR
H=1.34e−0.03T 0.34∗ 0.76
SM5>27 % 27 %>SM5>17 % SM5<17 %
SRtot L1 –A. glutinosa SRtot=0.53e0.04T 0.77∗∗∗ 1.54 SRtot=0.69e0.03T 0.83∗∗∗ 1.30 SRtot=0.77e0.01T 0.01 1.06
L2 –P. nigra SRtot=0.52e0.05T 0.78∗∗∗ 1.60 SRtot=0.61e0.04T 0.80∗∗∗ 1.46 SRtot=1.39e−0.02T 0.19∗∗ 1.17
L3 –F. excelsior SRtot=0.32e0.08T 0.68∗∗∗ 2.14 SRtot=0.56e0.03T 0.62∗∗∗ 1.40 SRtot=1.30e−0.02T 0.25∗∗ 0.82
∗P <0.05;∗∗P <0.01;∗∗∗P <0.001
Figure 3.Seasonal variation of soil respiration, soil temperature and soil moisture.(a–d)Data of soil heterotrophic respiration:(a)SRH along groundwater level gradient.(b)5 cm soil temperature.(c)5 cm integral soil moisture (SM5).(d)30 cm integral soil moisture (SM30). (e–h)Data of total soil respiration rates (SRtot) of three tree species.(e)SRtotunder different tree species.(f)5 cm soil temperature.(g)5 cm integral soil moisture (SM5).(h)30 cm integral soil moisture (SM30) . All values are mean SD. Data points marked with indicate significant differences between species atP <0.05 (For details, please see to Appendices A and B).
4 Discussion
4.1 Effect of groundwater level and soil moisture on SR In the studies of Martin and Bolstad (2005) and Pacific et al. (2008), it was indicated that the amount and availabil-ity of soil water varies depending on landscape position and topography. Both studies also show that small differences in micro-topography appear to be important in driving soil
moisture conditions. This is in accordance with our results; the overall seasonal trends of soil moisture were similar, but differences in the relative magnitude of soil moisture still can be found between different levels.
In our study site, the SRH was significantly higher at L2 and decreased with the distance from the river. At the same time, SRtotofA. glutinosaat L1 was significantly lower than
Figure 4.Differentiation of soil temperature (ST) and soil moisture (SM) as primary controlling factors for SRH. At SM5≥23 %, there are
positive correlations of SRHwith soil temperature in all levels(a). At 20 %≤SM5<23 %, there is a transition with no clear relationship of either SM or ST with SRH(b). At SM5<20 %, there is no relationship between SR and ST as the inset figure shows(c); it switches from
ST to SM5as the controlling factor with positive correlations between SRHand SM5for all levels. Campaigns with SM5<20 % were all
from spring and summer 2012. SM5(5 cm integral soil moisture).
Figure 5.Differentiation of soil temperature (ST) and soil moisture (SM) as primary controlling factors for SRtot. At SM5≥27 %, there are
positive correlations of SRtotwith soil temperature under all tree species(a). At 17 %≤SM5<27 %, there are positive but slightly weaker correlations of SRtotwith soil temperature under all tree species(b). At SM5<17 %, there is no relationship between SR and ST as the inset
figure shows(c); it switches from ST to SM5as the controlling factor with positive correlations between SRtotand SM5for all tree species. Campaigns with SM5<17 % were all from spring and summer 2012. SM5(5 cm integral soil moisture).
level in two different ways. First, when the groundwater level is low, the drought stresses soil microbial and root respiration activity; second, when groundwater level is high and close to topsoil surface, it limits soil aeration and likely reduces the effective respiring soil volume. Pacific et al. (2008) showed that the soil CO2 concentrations were significantly higher in the riparian zone as a result of higher soil moisture. In contrast, Zanchi et al. (2011) found lower SR in plots after drainage, and suggested that the low C and N content in the topsoil near the river, where most of the soil CO2respiration is produced, could partially explain that low SR. The discrep-ancy of these two studies could be associated with the differ-ent drainage regimes as the poorly drained plots imply the anaerobic inhibition of SR. In our study, however, SRHwas measured at L2, L3 and L4 under well-drained conditions, and SRH decreased concomitantly with the decrease in the availability of soil water. Nonetheless, SRtotofA. glutinosa was measured at L1, where the soils sometimes experienced
flooding or poor draining conditions, and the root respiration may be inhibited by the high groundwater level.
4.2 Rain pulse and drought effects on SR
The Mediterranean climate is characterized by summer droughts that particularly affect the top soil layers; there-fore, rainfall events during these dry periods can trigger abrupt increases in SR that last for days (Bowling et al., 2011; Cisneros-Dozal et al., 2007; Lee et al., 2004; Unger et al., 2010). Lee et al. (2004) simulated precipitation and found that hardwood forest floors were very sensitive to changes in moisture in the upper soil layers. Moreover, Wang et al. (2012) noted that the response of litterfall respiration is very sensitive to rainfall, and the increase in soil moisture by rainfall primarily enhanced the litterfall respiration but de-creased mineral SR. Similar results were published by Casals et al. (2011), who reported that SR after a precipitation pulse was mostly derived from SRHwith a contribution up to 70 % of SRtot. Hence, our findings seem to be consistent with these previous studies.
4.3 Confounding effects of temperature and moisture on SR
This study aimed at assessing the importance of soil mois-ture on soil respiration and determining the threshold of soil moisture at which soil moisture overrules temperature in con-trolling SR. The response of SR to soil moisture has been widely studied and described by various types of functions such as linear or logarithmic functions, depending on the soil type, climate or vegetation type (Comstedt et al., 2010; Epron et al., 1999; Orchard and Cook, 1983). In our study, the seasonal courses of SRH and SRtot generally followed the seasonal cycle of temperature, but were moderated by soil moisture. Such a relationship is in agreement with other previous studies (Davidson et al., 1998; Martin and Bolstad, 2005; Wang et al., 2013).
The positive linear relationship between SR and soil mois-ture in low soil moismois-ture conditions found in our work agrees with many previous studies where low soil moisture con-strains SR (Almagro et al., 2009; Davidson et al., 1998; Keith et al., 1997; Rey et al., 2002; Wang et al., 2013; Xu and Qi, 2001). In our study, the low soil moisture and warmer tem-peratures actually reduced SR rates, resulting in lowerQ10 values at the lower soil moisture. A similar decline ofQ10 with decreasing soil moisture was reported by Conant et al. (2004), Curiel-Yuste et al. (2003) and Wen et al. (2006). Low soil water content not only reduces the contact between the substrate, enzymes and microbes, it also decreases the sub-strate supply due to the increased drying-out of litter and top-soil layer (Davidson et al., 2006). Another possible reason for the observed lowerQ10is that the reduction of photosynthe-sis decreases the translocation of photosynthates to the rhi-zosphere (Hogberg et al., 2001; Nordgren et al., 2003).
In a Norway spruce stand, Gärdenäs (2000) found that lit-ter moisture explained most of the variation of SR, whereas mineral soil moisture, air and litter temperature had no
ef-fects on SR. Our results showed that the seasonal variations of SRHand SRtotwere mainly controlled by soil temperature, with a secondary influence of soil moisture (SM5). Using the recursive partitioning method, we have identified clear thresholds for SM5effects on the temperature sensitivity of SR. Soil moisture thresholds at which SR temperature sen-sitivity is reduced have been found in several studies from different ecosystems (Fang and Moncrieff, 2001; Gaumont-Guay et al., 2006; Jassal et al., 2008; Lellei-Kovács et al., 2011; Palmroth et al., 2005; Wang et al., 2013). However, the threshold values in soil moisture seem to be site specific as the factors limiting water uptake by plants and microbes may differ by ecosystem. Even in the same climate region, dif-ferent soil moisture thresholds have been found in previous studies. For example, Almagro et al. (2009) investigated how soil moisture modulated the sensitivity of soil respiration in different ecosystems in the Mediterranean region and found that the threshold value of soil moisture was 10 %. Above this soil moisture values,Q10 ranged from 1.86 to 2.20 and decreased to 0.44 to 0.63 when soil moisture was lower than 10 %. However, Rey et al. (2002) found in a Mediterranean oak forest that soil temperature accounted for 85 % of the variation of SR when soil moisture was above 20 % with a Q10 value of 2.34. Furthermore, Xu and Qi (2001) found that with soil moisture higher than 14 %, theQ10 value was 1.8 and decreased to 1.4 when soil moisture was lower than 14 %.
4.4 Other factors affecting SR
In addition to soil moisture threshold values, we also found variations of SRH and SRtot between location and tree species in each soil moisture interval. For example, when SM5was lower than 20 %, SRHmeasured at L4 was always lower than SRH measured at L2 and L3. When SM5 was lower than 17 %, SRtotof P. nigra was significantly higher
than for the other two species, suggesting that there are still other factors affecting SRHand SRtotvariations. Several ex-planations for this result are plausible. First, spatial variabil-ity in vegetation can affect SR due to differences in root res-piration and the quantity and quality of detritus (Raich and Tufekcioglu, 2000). These biophysical gradients across land-scape positions can lead to strong spatial heterogeneity in SR. Tree species in our study site exhibit different litterfall tem-poral patterns and may also contribute to the seasonal varia-tion of the availability of SOC and nutrients to the microbial community and roots. Second, the vitality of tree species in responses to soil water regime could generate different root respiration rates. Additional data of daily sap flow of the studied trees from our study site (data not shown) confirmed the differences in tree transpiration and growth activity. For example, the water use efficiency of P. nigrawas highest,
followed byF. excelsiorandA. glutinosa. Additionally, the
mean diameter at breast height (DBH) ofP. nigrais larger
more efficient in taking up water and nutrients compared to the other two tree species.
5 Conclusions
Appendix A
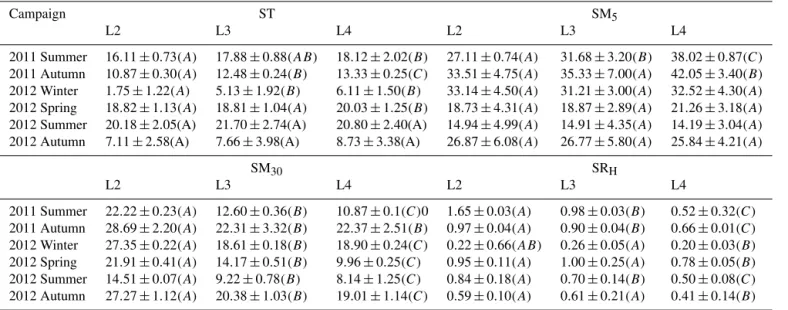
Table A1.Analysis of variance (ANOVA) statistics for soil temperature (ST) and soil moisture (SM): SM5, SM30and heterotrophic soil res-piration (SRH) of different levels of the same season (mean±SD). LSD was used to test post hoc. Means with the same letter in parentheses
are not significantly different (P <0.05).
Campaign ST SM5
L2 L3 L4 L2 L3 L4
2011 Summer 16.11±0.73(A) 17.88±0.88(AB) 18.12±2.02(B) 27.11±0.74(A) 31.68±3.20(B) 38.02±0.87(C)
2011 Autumn 10.87±0.30(A) 12.48±0.24(B) 13.33±0.25(C) 33.51±4.75(A) 35.33±7.00(A) 42.05±3.40(B)
2012 Winter 1.75±1.22(A) 5.13±1.92(B) 6.11±1.50(B) 33.14±4.50(A) 31.21±3.00(A) 32.52±4.30(A)
2012 Spring 18.82±1.13(A) 18.81±1.04(A) 20.03±1.25(B) 18.73±4.31(A) 18.87±2.89(A) 21.26±3.18(A)
2012 Summer 20.18±2.05(A) 21.70±2.74(A) 20.80±2.40(A) 14.94±4.99(A) 14.91±4.35(A) 14.19±3.04(A)
2012 Autumn 7.11±2.58(A) 7.66±3.98(A) 8.73±3.38(A) 26.87±6.08(A) 26.77±5.80(A) 25.84±4.21(A)
SM30 SRH
L2 L3 L4 L2 L3 L4
2011 Summer 22.22±0.23(A) 12.60±0.36(B) 10.87±0.1(C)0 1.65±0.03(A) 0.98±0.03(B) 0.52±0.32(C)
2011 Autumn 28.69±2.20(A) 22.31±3.32(B) 22.37±2.51(B) 0.97±0.04(A) 0.90±0.04(B) 0.66±0.01(C)
2012 Winter 27.35±0.22(A) 18.61±0.18(B) 18.90±0.24(C) 0.22±0.66(AB) 0.26±0.05(A) 0.20±0.03(B)
2012 Spring 21.91±0.41(A) 14.17±0.51(B) 9.96±0.25(C) 0.95±0.11(A) 1.00±0.25(A) 0.78±0.05(B)
2012 Summer 14.51±0.07(A) 9.22±0.78(B) 8.14±1.25(C) 0.84±0.18(A) 0.70±0.14(B) 0.50±0.08(C)
Appendix B
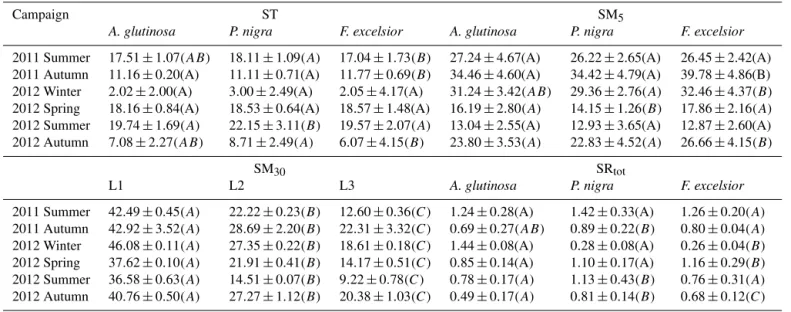
Table B1.Analysis of variance (ANOVA) statistics for soil temperature (ST) and soil moisture (SM): SM5, SM30, and total soil respiration (SRtot) of different tree species of the same season. LSD was used to test post hoc. Means with the same letter in parentheses are not significantly different (P <0.05).
Campaign ST SM5
A. glutinosa P. nigra F. excelsior A. glutinosa P. nigra F. excelsior
2011 Summer 17.51±1.07(AB) 18.11±1.09(A) 17.04±1.73(B) 27.24±4.67(A) 26.22±2.65(A) 26.45±2.42(A)
2011 Autumn 11.16±0.20(A) 11.11±0.71(A) 11.77±0.69(B) 34.46±4.60(A) 34.42±4.79(A) 39.78±4.86(B)
2012 Winter 2.02±2.00(A) 3.00±2.49(A) 2.05±4.17(A) 31.24±3.42(AB) 29.36±2.76(A) 32.46±4.37(B)
2012 Spring 18.16±0.84(A) 18.53±0.64(A) 18.57±1.48(A) 16.19±2.80(A) 14.15±1.26(B) 17.86±2.16(A)
2012 Summer 19.74±1.69(A) 22.15±3.11(B) 19.57±2.07(A) 13.04±2.55(A) 12.93±3.65(A) 12.87±2.60(A) 2012 Autumn 7.08±2.27(AB) 8.71±2.49(A) 6.07±4.15(B) 23.80±3.53(A) 22.83±4.52(A) 26.66±4.15(B)
SM30 SRtot
L1 L2 L3 A. glutinosa P. nigra F. excelsior
2011 Summer 42.49±0.45(A) 22.22±0.23(B) 12.60±0.36(C) 1.24±0.28(A) 1.42±0.33(A) 1.26±0.20(A)
2011 Autumn 42.92±3.52(A) 28.69±2.20(B) 22.31±3.32(C) 0.69±0.27(AB) 0.89±0.22(B) 0.80±0.04(A)
2012 Winter 46.08±0.11(A) 27.35±0.22(B) 18.61±0.18(C) 1.44±0.08(A) 0.28±0.08(A) 0.26±0.04(B)
2012 Spring 37.62±0.10(A) 21.91±0.41(B) 14.17±0.51(C) 0.85±0.14(A) 1.10±0.17(A) 1.16±0.29(B)
2012 Summer 36.58±0.63(A) 14.51±0.07(B) 9.22±0.78(C) 0.78±0.17(A) 1.13±0.43(B) 0.76±0.31(A)
Acknowledgements. We gratefully acknowledge the help of Elisenda Sánchez, Callum Berridge, Daniel Nadal, Anna Lupón and Abdellah Boumghar for their assistance during field work and experiment implementation. The research leading to these results has received funding from the European Community’s Seventh Framework Programme GREENCYCLESII (FP7 2007–2013) under grant agreement no. 238366, MEDFORESTREAM (CGL2011-30590-C02-01) and MONTES-Consolider (CSD2008-00040).
Edited by: A. J. Dolman
References
Almagro, M., López, J., Querejeta, J. I., and Martínez-Mena, M.: Temperature dependence of soil CO2 efflux is strongly modu-lated by seasonal patterns of moisture availability in a Mediter-ranean ecosystem, Soil Biol. Biochem., 41, 594–605, 2009. Bowden, R. D., Newkirk, K. M., and Rullo, G. M.: Carbon dioxide
and methane fluxes by a forest soil under laboratory-controlled moisture and temperature conditions, Soil Biol. Biochem., 30, 1591–1597, 1998.
Bowling, D. R., Grote, E. E., and Belnap, J.: Rain pulse response of soil CO2exchange by biological soil crusts and grasslands of the semiarid Colorado Plateau, United States, J. Geophys. Res., 116, G03028, doi:10.1029/2011JG001643, 2011.
Casals, P., Lopez-Sangil, L., Carrara, A., Gimeno, C., and Nogués, S.: Autotrophic and heterotrophic contributions to short-term soil CO2efflux following simulated summer precipitation pulses in a Mediterranean dehesa, Global Biogeochem. Cy., 25, GB3012, doi:10.1029/2010GB003973, 2011.
Cisneros-Dozal, L. M., Trumbore, S. E., and Hanson, P. J.: Effect of moisture on leaf litter decomposition and its contribution to soil respiration in a temperate forest, J. Geophys. Res., 112, G01013, doi:10.1029/2006JG000197, 2007.
Comstedt, D., Boström, B., and Ekblad, A.: Autotrophic and het-erotrophic soil respiration in a Norway spruce forest: estimating the root decomposition and soil moisture effects in a trenching experiment, Biogeochemistry, 104, 121–132, 2010.
Conant, R. T., Dalla-Betta, P., Klopatek, C. C., and Klopatek, J. M.: Controls on soil respiration in semiarid soils, Soil Biol. Biochem., 36, 945–951, 2004.
Curiel-Yuste, J., Janssens, I. A., Carrara, A., Meiresonne, L., and Ceulemans, R.: Interactive effects of temperature and precipita-tion on soil respiraprecipita-tion in a temperate maritime pine forest, Tree Physiol., 23, 1263–70, 2003.
Curiel-Yuste, J., Janssens,I.A., Carrara,A., and Ceulemans,R.: An-nual Q10 of soil respiration reflects plant phenological pat-terns as well as temperature sensitivity, Glob. Change Biol., 10, 161–169, 2004.
Curiel-Yuste, J., Baldocchi, D. D., Gershenson, A., Goldstein, A., Misson, L., and Wong, S.: Microbial soil respiration and its de-pendency on carbon inputs, soil temperature and moisture, Glob. Change Biol., 13, 2018–2035, 2007.
Davidson, E., Belk, E., and Boone, R. D.: Soil water content and temperature as independent or confounded factors controlling soil respiration in a temperate mixed hardwood forest, Glob. Change Biol., 4, 217–227, 1998.
Davidson, E. A., Janssens, I. A., and Luo, Y.: On the variability of respiration in terrestrial ecosystems: moving beyondQ10, Glob.
Change Biol., 12, 154–164, 2006.
Epron, D., Farque, L., Lucot, É., and Badot, P.-M.: Soil CO2efflux in a beech forest: dependence on soil temperature and soil water content, Ann. For. Sci., 56, 221–226, 1999.
Epron, D., Le Dantec, V., Dufrene, E., and Granier, A.: Seasonal dynamics of soil carbon dioxide efflux and simulated rhizosphere respiration in a beech forest, Tree Physiol., 21, 145–52, 2001. Fang, C. and Moncrieff, J. B.: The dependence of soil CO2efflux
on temperature, Soil Biol. Biochem., 33, 155–165, 2001. Fang, C., Smith, P., Moncrieff, J. B., and Smith, J. U.: Similar
re-sponse of labile and resistant soil organic matter pools to changes in temperature, Nature, 433, 57–59, 2005.
Gärdenäs, A. I.: Soil respiration fluxes measured along a hydrolog-ical gradient in a Norway spruce stand in south Sweden (Sko-gaby), Plant Soil, 221, 273–280, 2000.
Gaumont-Guay, D., Black, T. A., Griffis, T. J., Barr, A. G., Jas-sal, R. S., and Nesic, Z.: Interpreting the dependence of soil res-piration on soil temperature and water content in a boreal aspen stand, Agr. Forest Meteorol., 140, 220–235, 2006.
Hanson, P. J., Edwards, N. T., Garten, C. T., and Andrews, J. A.: Separating root and soil microbial contributions to soil respira-tion: a review of methods and observations, Biogeochemistry, 48, 115–146, 2000.
Häring, T., Reger, B., Ewald, J., Hothorn, T., and Schröder, B.: Pre-dicting Ellenberg’s soil moisture indicator value in the Bavarian Alps using additive georegression, Appl. Veg. Sci., 16, 110–121, 2013.
Heinemeyer, A., Hartley, I. P., Evans, S. P., Carreira De La Fuente, J. A., and Ineson, P.: Forest soil CO2flux: uncovering the contri-bution and environmental responses of ectomycorrhizas, Glob. Change Biol., 13, 1786–1797, 2007.
Hogberg, P., Nordgren, A., Buchmann, N., Taylor, A. F. S., Ek-blad, A., Hogberg, M. N., Nyberg, G., Ottosson-Lofvenius, M., and Read, D. J.: Large-scale forest girdling shows that current photosynthesis drives soil respiration, Nature, 411, 789–792, 2001.
Jassal, R. S., Black, T. A., Novak, M. D., Gaumont-Guay, D., and Nesic, Z.: Effect of soil water stress on soil respiration and its temperature sensitivity in an 18-year-old temperate Douglas-fir stand, Glob. Change Biol., 14, 1305–1318, 2008.
Jobbágy, E. G. and Jackson, R. B.: The vertical distribution of soil organic carbon and its relation to climate and vegetation, Ecol. Appl., 10, 423–436, 2000.
Keith, H., Jacobsen, K. L., and Raison, R. J.: Effects of soil phos-phorus availability, temperature and moisture on soil respiration in Eucalyptus pauciflora forest, Plant Soil, 190, 127–141, 1997. Knorr, W., Prentice, I. C., House, J. I., and Holland, E. A.:
Long-term sensitivity of soil carbon turnover to warming, Nature, 433, 298–301, 2005.
Kuzyakov, Y. V. and Larionova, A. A.: Contribution of rhizomicro-bial and root respiration to the CO2 emission from soil (a re-view), Eurasian Soil Sci.+, 39, 753–764, 2006.
Lee, X., Wu, H.-J., Sigler, J., Oishi, C., Siccama, T., and Haven, N.: Rapid and transient response of soil respiration to rain, Glob. Change Biol., 10, 1017–1026, 2004.
of soil moisture on the temperature response of soil respiration, Eur. J. Soil Biol., 47, 247–255, 2011.
Lloyd, J. and Taylor, J. A.: On the temperature dependence of soil respiration, Funct. Ecol., 8, 315–323, 1994.
Londo, A. J., Messina, M. G., and Schoenholtz, S. H.: Forest Har-vesting Effects on Soil Temperature, Moisture, and Respiration in a Bottomland Hardwood Forest, Soil Sci. Soc. Am. J., 63, 637–644, 1999.
Martin, J. G. and Bolstad, P. V.: Annual soil respiration in broadleaf forests of northern Wisconsin: influence of moisture and site bio-logical, chemical, and physical characteristics, Biogeochemistry, 73, 149–182, 2005.
McGlynn, B. L. and Seibert, J.: Distributed assessment of contribut-ing area and riparian buffercontribut-ing along stream networks, Water Re-sour. Res., 39, 1082, doi:10.1029/2002WR001521, 2003. Mielnick, P. C. and Dugas, W. A.: Soil CO2 flux in a tallgrass
prairie, Soil Biol. Biochem., 32, 221–228, 2000.
Nordgren, A., Löfvenius, M. O., Högberg, M. N., and Mellan-der, P.: Tree root and soil heterotrophic respiration as revealed by girdling of boreal Scots pine forest?: Extending observations, Environment, 26, 1287–1296, 2003.
Orchard, V. A. and Cook, F. J.: Relationship between soil respiration and soil moisture, Soil Biol. Biochem., 15, 447–453, 1983. Pacific, V. J., McGlynn, B. L., Riveros-Iregui, D. a., Welsch, D. L.,
and Epstein, H. E.: Variability in soil respiration across riparian-hillslope transitions, Biogeochemistry, 91, 51–70, 2008. Palmroth, S., Maier, C. A., McCarthy, H. R., Oishi, A. C., Kim,
H.-S., Johnsen, K. H., Katul, G. G., and Oren, R.: Contrasting re-sponses to drought of forest floor CO2efflux in a loblolly pine plantation and a nearby oak-hickory forest, Glob. Change Biol., 11, 421–434, 2005.
Raich, J. W. and Potter, C. S.: Global patterns of carbon dioxide emissions from soils, Global Biogeochem. Cy., 9, 23–36, 1995. Raich, J. W. and Tufekcioglu, A.: Vegetation and soil respiration?:
Correlations and controls, Biogeochemistry, 48, 71–90, 2000. Raich, J. W., Potter, C. S., and Bhagawati, D.: Interannual
variabil-ity in global soil respiration, 1980–1994, Glob. Change Biol., 8, 800–812, 2002.
Rey, A., Pegoraro, E., Tedeschi, V., De Parri, I., Jarvis, P. G., and Valentini, R.: Annual variation in soil respiration and its compo-nents in a coppice oak forest in Central Italy, Glob. Change Biol., 8, 851–866, 2002.
Rustad, L. E., Huntington, T. G., and Boone, D.: Controls on soil respiration?: Implications for climate change, Biogeochemistry, 48, 1–6, 2000.
Schimel, D. S., House, J. I., Hibbard, K. A., Bousquet, P., Ciais, P., Peylin, P., Braswell, B. H., Apps, M. J., Baker, D., Bon-deau, A., Canadell, J., Churkina, G., Cramer, W., Denning, A. S., Field, C. B., Friedlingstein, P., Goodale, C., Heimann, M., Houghton, R. A., Melillo, J. M., Moore, B., Murdiyarso, D., Noble, I., Pacala, S. W., Prentice, I. C., Raupach, M. R., Rayner, P. J., Scholes, R. J., Steffen, W. L., and Wirth, C.: Re-cent patterns and mechanisms of carbon exchange by terrestrial ecosystems, Nature, 414, 169–72, 2001.
Schlesinger, W. H. and Andrews, J. A.: Soil respiration and the global carbon cycle, Biogeochemistry, 48, 7–20, 2000.
Sjögersten, S., van der Wal, R., and Woodin, S. J.: Small-scale hy-drological variation determines landscape CO2fluxes in the high Arctic, Biogeochemistry, 80, 205–216, 2006.
Skopp, J., Jawson, M. D., and Doran, J. W.: Steady-State Aerobic Microbial Activity as a Function of Soil Water Content, Soil Sci. Soc. Am. J., 54, 1619–1625, 1990.
Unger, S., Máguas, C., Pereira, J. S., David, T. S., and Werner, C.: The influence of precipitation pulses on soil respiration – as-sessing the “Birch effect” by stable carbon isotopes, Soil Biol. Biochem., 42, 1800–1810, 2010.
van ’t Hoff, J. H.: Lectures on Theoretical and Physical Chemistry, Edward Arnold, 1898.
Wang, B., Zha, T. S., Jia, X., Wu, B., Zhang, Y. Q., and Qin, S. G.: Soil moisture modifies the response of soil respiration to temper-ature in a desert shrub ecosystem, Biogeosciences Discuss., 10, 9213–9242, doi:10.5194/bgd-10-9213-2013, 2013.
Wang, Y., Wang, Z.-L., Wang, H., Guo, C., and Bao, W.: Rainfall pulse primarily drives litterfall respiration and its contribution to soil respiration in a young exotic pine plantation in subtropical China, Can. J. Forest Res., 42, 657–666, 2012.
Wardle, D.: A. Communities and ecosystems: linking the above-ground and belowabove-ground components, Vol. 34, Princeton Uni-versity Press, 2002.
Welsch, D. L. and Hornberger, G. M.: Spatial and temporal simula-tion of soil CO2concentrations in a small forested catchment in Virginia, Biogeochemistry, 71, 413–434, 2004.
Wen, X.-F., Yu, G.-R., Sun, X.-M., Li, Q.-K., Liu, Y.-F., Zhang, L.-M., Ren, C.-Y., Fu, Y.-L., and Li, Z.-Q.: Soil moisture effect on the temperature dependence of ecosystem respiration in a sub-tropical Pinus plantation of southeastern China, Agr. Forest Me-teorol., 137, 166–175, 2006.
Xu, J., Chen, J., Brosofske, K., Li, Q., Weintraub, M., Hender-son, R., Wilske, B., John, R., Jensen, R., Li, H., and others: In-fluence of timber harvesting alternatives on forest soil respiration and its biophysical regulatory factors over a 5-year period in the Missouri Ozarks, Ecosystems, 14, 1310–1327, 2011.
Xu, M. and Qi, Y.: Soil-surface CO2efflux and its spatial and tem-poral variations in a young ponderosa pine plantation in northern California, Glob. Change Biol., 7, 667–677, 2001.
Yan, L., Chen, S., Huang, J., and Lin, G.: Differential responses of auto-and heterotrophic soil respiration to water and nitrogen addition in a semiarid temperate steppe, Glob. Change Biol., 16, 2345–2357, 2010.
Zanchi, F. B., Waterloo, M. J., Dolman, A. J., Groenendijk, M., Kesselmeier, J., Kruijt, B., Bolson, M. A., Luizão, F. J., and Manzi, A. O.: Influence of drainage status on soil and water chemistry, litter decomposition and soil respiration in central Amazonian forests on sandy soils, Rev. Ambient. e Água, 6, 6–29, 2011.