Anthropogenic and Ecological Drivers of
Amphibian Disease (Ranavirosis)
Alexandra C. North1*, David J. Hodgson2, Stephen J. Price3, Amber G. F. Griffiths1*
1Environment and Sustainability Institute, University of Exeter, Penryn Campus, Penryn, Cornwall, United Kingdom,2Centre for Ecology and Conservation, University of Exeter, Penryn Campus, Penryn, Cornwall, United Kingdom,3UCL Genetics Institute, Gower Street, London, United Kingdom
*acn202@exeter.ac.uk(ACN); A.Griffiths3@exeter.ac.uk(AGFG)
Abstract
Ranaviruses are causing mass amphibian die-offs in North America, Europe and Asia, and have been implicated in the decline of common frog (Rana temporaria) populations in the UK. Despite this, we have very little understanding of the environmental drivers of disease occurrence and prevalence. Using a long term (1992-2000) dataset of public reports of am-phibian mortalities, we assess a set of potential predictors of the occurrence and prevalence ofRanavirus-consistent common frog mortality events in Britain. We reveal the influence of biotic and abiotic drivers of this disease, with many of these abiotic characteristics being an-thropogenic. Whilst controlling for the geographic distribution of mortality events, disease prevalence increases with increasing frog population density, presence of fish and wild newts, increasing pond depth and the use of garden chemicals. The presence of an alterna-tive host reduces prevalence, potentially indicating a dilution effect. Ranavirosis occurrence is associated with the presence of toads, an urban setting and the use of fish care products, providing insight into the causes of emergence of disease. Links between occurrence, prev-alence, pond characteristics and garden management practices provides useful manage-ment implications for reducing the impacts ofRanavirusin the wild.
Introduction
Amphibians are the most endangered taxonomic group on the planet, with one third of species currently holding a threatened status (IUCN categories Vulnerable, Endangered or Critically Endangered; [1], [2]). Emerging diseases are one main driver of these amphibian declines [3], alongside a range of other threats including over-exploitation, habitat loss and climate change [4]. Ranaviruses impact amphibians worldwide [5] and are causing notable die-offs in North America, Europe and Asia [5–11]. The pathogen has been implicated in population declines of several European species [10] including declines of over 80% in UK common frogs (Rana tem-poraria) [9] and models suggest thatRanavirushas the potential to cause local extinction in wood frog (Lithobates sylvaticus) populations [12].
Ranaviruses are large, double-stranded DNA viruses belonging to the familyIridoviridae [13] that infect amphibians, fish and reptiles [14], [15]. They can cause systemic disease
OPEN ACCESS
Citation:North AC, Hodgson DJ, Price SJ, Griffiths AGF (2015) Anthropogenic and Ecological Drivers of Amphibian Disease (Ranavirosis). PLoS ONE 10(6): e0127037. doi:10.1371/journal.pone.0127037
Academic Editor:Jacob Lawrence Kerby, University of South Dakota, UNITED STATES
Received:December 8, 2014
Accepted:April 10, 2015
Published:June 3, 2015
Copyright:© 2015 North et al. This is an open access article distributed under the terms of the
Creative Commons Attribution License, which permits unrestricted use, distribution, and reproduction in any medium, provided the original author and source are credited.
Data Availability Statement:The data analysed in this manuscript has been deposited in Dryad (doi:
http://dx.doi.org/10.5061/dryad.66k59). Third party data was obtained from Froglife and are therefore available through the charity Froglife (Registered Charity No. 1093372 in England and Wales). Please submit queries for data toinfo@froglife.organd asking for access to the data for research purposes. Further contact details can also be found on their websitehttp://www.froglife.org/contact-us/.
Funding:This work received support from Marie Curie (http://ec.europa.eu/research/
(ranavirosis), resulting in cell death [13] and overt signs—ulcerations, haemorrhaging, muscle necrosis or lip erythema [16]—which may depend on the stage of disease progression [17]. In the wild,Ranavirusinduced mortality rates can be in excess of 90%, with year on year re-occur-rence of die-offs in the same amphibian populations [7] and observed die-offs as large as 200 individuals [9]. Susceptibility toRanavirusdoes however differ between host developmental stages [18], populations [19], and species [15], [20], and is influenced by a range of biotic and abiotic characteristics, including differences in habitat [20] and temperature [21]. Differences in susceptibility may also relate to the virus genotype [22], though only a single species of Ranavirusis thought to be present in the UK [14]. Incidence of mortality events can show sea-sonal variation, peaking in summer months in the UK [23] in contrast to North America where incidence is highest in autumn and winter [24].
Emerging pathogens are classed as novel if, for example, they have been introduced to new regions by humans, and endemic if they were already present in a region but have moved into a new host or increased in pathogenicity [25]. The distinction is important since the dif-ferent histories will likely warrant difdif-ferent management approaches.Ranavirusspread has been strongly linked to human activity, including international trade [14], [26]—[28], the use of infected salamanders as fishing bait [29] and industrial and agricultural activities [30]. Modelling the emergence of ranavirosis in the UK reveals human population density as an important predictor of spread [17], though it is challenging to determine which aspects of human activity are responsible.
Commonly used anthropogenic chemicals such as pesticides are known to cause immuno-suppression in amphibians [31]. The herbicide atrazine for example reduces leukocyte produc-tion and increases host susceptibility toRanavirus[32], and the insecticide chlorpyrifos increasesRanavirusinfection rates in the tiger salamander (Ambystoma tigrinum) [33]. Carbyl insecticide has also been shown to decrease host survival when in combination withRanavirus and predator cues [34]. Few studies have however looked at the relationship between chemical use andRanavirusinfection in free living populations, and those that have, focus on North American species and correlates such as distance to agricultural or industrial activity [30] or other abiotic contaminants such as aluminium [35] and water ammonia levels [36].
Biotic characteristics such as the presence of alternative host species have also been shown to influence the incidence and impact ofRanavirus. Identical ranaviruses have been isolated from wild sympatric amphibians and fish, suggesting one could be a reservoir for the other [37]. Ranaviruses have also been isolated from a range of economically important fish [38], and it has been suggested thatRanavirusmay have entered the UK through goldfish and bull-frog imports from North America [14], [26]. In the UKRanavirusinfection is also associated with common toads (Bufo bufo), with known susceptibility of common frogs to virus isolated from a toad [39]. Common toads were less susceptible than common frogs to experimental challenge with a number of differentRanavirusisolates; toad tadpoles showed lower prevalence of infection and fewer signs of disease [40]. Smooth newts (Lissotriton vulgaris) have also tested positive forRanavirus[41], and in Europe mass mortalities of palmate newts (Lissotriton helve-ticus) as well as alpine newts (Mesotriton alpestris), an introduced species in the UK [42], have been associated withRanavirusinfection [8].
The availability of alternative hosts within a multi-host system affects transmission dynam-ics [43]. Inter-specific transmission can mean counts of all available hosts contribute to total host density and promote pathogen persistence when transmission is density dependent. In some cases an amplification effect may be seen, whereby each species contributes to the pool of susceptible hosts, so that pathogen abundance may be higher than in the presence of just one host species alone [43]. Alternatively, if additional hosts are of lower quality, their presence may decrease the pathogen’s ability to persist [44], [45]. The mechanisms behind this decrease
are likely to vary according to transmission dynamics and the complexity of the system in ques-tion [46], [47]. Generally, the presence of poor quality hosts may result in fewer new infections compared to in the presence of the primary host alone, as a result of decreased encounter rates between primary hosts [47], reduced downstream transmission or reduced propagule produc-tion [46]. This is referred to as a dilution effect [43], [45], [47] and has been reported in North American anurans infected with the fungal pathogenBatrachochytrium dendrobatidis[48].
The amphibian life history stage most susceptible toRanavirusinfection varies geographical-ly: adults appear worst affected in UK common frogs [49] compared to larvae and recent meta-morphs in North American anurans [7]. In the UK, vertical transmission seems unlikely, as Ranaviruslevels in early life history stages are negligible [49] and mathematical models suggest adult to adult transmission could be sufficient to allow persistence [50]. LargerRanavirus -con-sistent die-offs were associated with larger populations in common frogs [9], which could high-light a role for density in transmission. Density dependent transmission would result in natural regulation of disease levels, due to differing transmission efficiencies at different host densities, enabling host population recovery at low contact rates. However, asRanavirusis a multi-host pathogen [7], [15] and can persist in sediment and water [51–53] it seems likely that the virus could be maintained at low host densities too. A better understanding of factors associated with outbreaks of ranavirosis could provide useful insights into the transmission dynamics at play.
In this study we analysed a long term dataset of common frog mortalities from across Brit-ain to identify characteristics associated with ranavirosis occurrence and prevalence. Ranaviro-sis occurrence was defined as the presence or absence ofRanavirus-consistent deaths at a site, and prevalence was defined as the proportion of the estimated total frog population killed in the mortality event. Only one species from the genusRanavirusis known to be present in the UK (Frog Virus 3) and so here the species is assumed to be consistent across mortality events. Possible predictors focused on (i) biotic characteristics including the presence of alternate hosts (toads, newts and ornamental fish) and common frog population density, and (ii) abiotic characteristics including pond depth, level of urbanisation, pond management (use of fish care products) and the use of garden chemicals (pesticides and herbicides) (SeeS1 Tablefora priori justification of the choice of predictors).
Methods
Study System
Common frogs are one of seven native amphibian species found in the UK [54]. They are thought to be largely philopatric, with relatively short maximum dispersal distances recorded [55], [56]. In the UK, it is the adult life stage of common frogs that is impacted byRanavirus [23], [49]. Much of what we know aboutRanavirustransmission is based on infection trials in a laboratory setting [39], [57]. Experimental trials found both the route of exposure and the source ofRanavirusto influence disease development and mortality rates in common frogs, suggesting transmission could occur through direct contact and via exposure to infected water [57].
Frog Mortality Project Database
ensure the accuracy of the information received. Later reports were filed via a mix of paper and electronic questionnaires. All reports were subsequently consolidated in a digital database which is analysed here. Species identification is relatively straightforward, as the only common, native UK species are common frogs, common toads, palmate, smooth (Lissotriton vulgaris) and great crested newts (Triturus cristatus). Pool frogs (Pelophylax lessonae) and natterjack toads (Bufo calamita) may also be present, but these species are rare with restricted ranges [54], [58].
Here we have analysed mortality reports of diseased and non-diseased amphibians submit-ted by the public between 1992 and 2000 (Maximum complete reports analysed here,
n = 2,219, although some analyses use subsets of the dataset). Each report lists the number of deaths, any signs of disease or injury observed, an estimated healthy population size and details about the pond and garden management. Total frog population size estimates were validated via correlation analyses between additional independent measures of population size recorded within the database (For details seeS1 File). Due to the citizen science nature of the dataset, ad-ditional explanatory variables could not be formally validated. Anecdotal evidence from au-thors working alongside pond owners who have contributed to this database suggests reporters are reliable and conscientious. Whilst the lack of formal validation means our results should be interpreted with caution, large sample sizes recommend confidence in the patterns detected. A set of criteria for filtering database records has been applied previously to identify Ranavirus-consistent mortality events within the FMP database and established this method as a reliable predictor ofRanavirusinfection [9]. Records identified asRanavirus-consistent by these crite-ria were validated through molecular screening of frogs for infection and gross examination for signs of past infection. The disease status of all carcasses screened matched the disease status classified using the filtering criteria [9]. These criteria were (i) mortality event occurring be-tween the warmer months of May-September due to the peak occurrence ofRanavirusdisease in warmer months and to exclude winterkill related mortalities which is thought to be the other main cause of mass mortalities in the UK [23], and (ii) pathognomonic signs of ulcera-tions or highly diagnostic systemic haemorrhaging [9] (Criteria 1,Ranavirus-consistent posi-tive events: n = 702). These overt signs are not associated with any other pathogen in the UK, and interactions with winter mortality are highly unlikely since winter mortality is strongly as-sociated with bloated and pale bodies, neither of which are signs asas-sociated withRanavirus mortality [23]. To ensure the robustness of any conclusions made from these criteria, analyses were also conducted using a second previously defined set of criteria [17]. This second set of criteria removes the requirement for events to occur during summer months and defines a Ranavirus-consistent mortality event as (i) signs of systemic haemorrhaging, ulcerations or limb necrosis, alongside (ii) at least five deaths in the mortality event (Criteria 2,Ranavirus -consistent positive events: n = 740).
The inclusion of non-summer mortality events in criteria 2 was considered to be the largest difference between criteria. To determine the cause of any differences in the results between criteria, criteria 2 [17] was subsequently restricted to exclude mortalities outside of May-Sep-tember as per criteria 1 [9] (Ranavirus-consistent events: n = 653).
Statistical analysis
A multi-model inference approach was adopted with all possible combinations of main effects being ranked according to their (Q)/AIC (Quasi/Akaike Information Criterion). The AIC pro-vides an estimate of the Kullback-Leibler distance and can be used to select the best fitting model or set of models [59]. Model averaging was conducted across all models withΔ(Q)/ AIC<6 [60] to account for model selection uncertainty and to determine the effect size and
conducted in R [62] using packages mgcv for generalized additive models [63] and MuMIN for model ranking and averaging [64]. To control for duplicate records through time, the first event from each postcode was included and subsequent duplicate records removed.
a) Factors affecting ranavirosis occurrence. Ranavirosis occurrence was defined as the presence or absence ofRanavirus-consistent deaths at a site and is a binary response term in this global model (presence/absence). Nine explanatory variables were included (SeeS1 Table
fora priorijustification). Biotic predictors included: fish (91% of ponds within the database that specified fish had goldfish varieties, 24% had koi, 19% had orfe and 12% had tench), newt (species unspecified) and toad presence (species unspecified but assumed to be largely common toads due to the highly restricted range and specialised habitat requirements of natterjack toads [54], [65]), frog population density (total population size divided by maximum total pond volume). Abiotic predictors included: average pond depth, level of urbanisation (urban/ rural) and whether chemicals such as herbicides, slug pellets or fish care products were used in the garden (Criteria 1: n = 2,113, Criteria 2: n = 2,219, Criteria 2 excluding mortalities outside of May-September: n = 2,160). Missing data and uncertain species identification meant we ad-dressed fish as a class and not at the level of species.
b) Factors affecting ranavirosis prevalence. Ranavirosis prevalence was defined as the proportion of the estimated total frog population killed in the mortality event. Analysis of prev-alence used the subset of the data containingRanavirus-consistent events only (Criteria 1: n = 702, Criteria 2: n = 740, Criteria 2 excluding mortalities outside of May-September: n = 653). Estimated total frog population size was used to compute a log-odds ratio of ranaviro-sis-caused frog deaths compared to the total population, analysed with a binomial error struc-ture. All explanatory variables used in the occurrence analysis were included.
Spatial non-independence of residuals was determined by the significance of a spatial smoothing term in generalized additive models and by confirming improved model fits of spa-tial versus non-spaspa-tial models. Generalized additive models with binomial error structures were subsequently used with a smoothing term to account for the geographic pattern of disease events. Covariates were modelled as parametric terms and the northings and eastings of each mortality event were included as a non-parametric thin plate regression spline smoothing term. Continuous explanatory variables were standardized to zero mean and divided by 2 stan-dard deviations [66] to enable relative interpretation of averaged model coefficients. Models were ranked according to their Akaike Information Criterion (AIC) (Occurrence analysis), or QAIC (Prevalence analysis) for over-dispersed data, due to inflated residual deviance com-pared to degrees of freedom. Model averaging was then conducted across all models withΔ(Q) AIC<6 [60]. All analyses were repeated for each ranavirosis criteria. Variables were classed as
significant if the 95% confidence intervals did not span zero [61]. As an indication of the use-fulness of any findings for real life application, the proportion of deviance explained by the models was noted (calculated as 1-residual deviance/null deviance).
Results
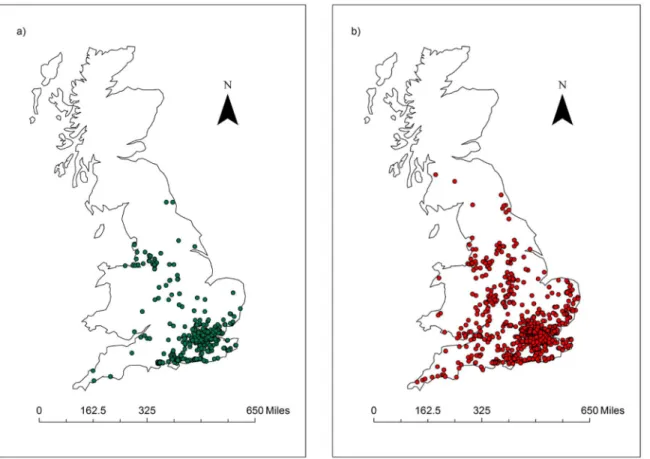
Using criteria 1 [9] for identifyingRanavirus-consistent mortalities, and excluding incomplete and duplicate records resulted in 702Ranavirus-consistent records and a total of 2,113 records (Fig 1). The magnitude of aRanavirus-consistent mortality event ranged between 1 and 251 in-dividuals (Median: 15 inin-dividuals).
a) Factors affecting ranavirosis occurrence
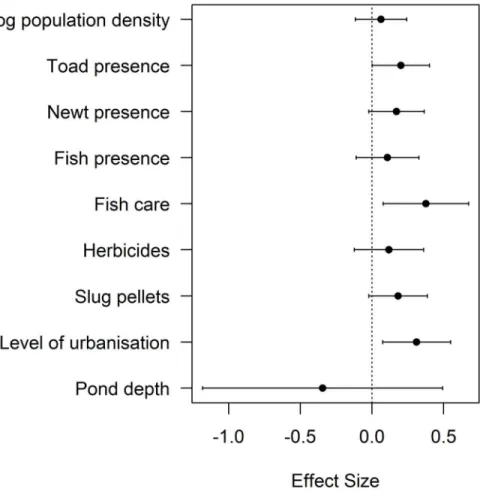
products (CI: 0.079, 0.675) (Fig 2,S2 Table). Confidence intervals of these parameters did not span zero and positive trends were found for each variable, with each increasing the likelihood of ranavirosis occurrence (Fig 2). All other variables had confidence intervals that spanned zero. As would be expected for disease cases, a geographic pattern of disease occurrence was de-tected (χ214.38= 55.67, p<0.0001). The inclusion of the northings and eastings of each
mortali-ty event therefore ensured independence of residuals for the variables of interest. The
explanatory power of this model (Spatial model: 4.39% deviance explained, non-spatial model: 1.50% deviance explained), was low.
b) Factors affecting ranavirosis prevalence
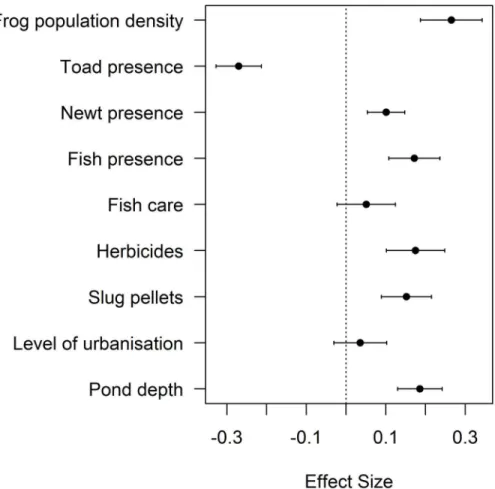
A negative association was found between ranavirosis prevalence in common frogs and the presence of toads (CI: -0.327, -0.213), with a large effect size and confidence intervals not over-lapping zero (Fig 3,S3 Table). In order of largest effect size first, ranavirosis prevalence was positively associated with frog population density (CI: 0.188, 0.343), pond depth (CI: 0.130, 0.242), the presence of fish (CI: 0.107, 0.236), the use of herbicides (CI: 0.101, 0.248) and slug pellets (CI: 0.089, 0.215), and the presence of newts (CI: 0.054, 0.148). The use of fish care products and the level of urbanisation did not help explain ranavirosis prevalence, with confi-dence intervals that spanned zero. The geographic distribution of mortality events was impor-tant in explaining ranavirosis prevalence (χ228.22= 850.4, p<0.001) and so its inclusion
ensured independence of residuals for the variables of interest. The deviance explained by this model was 18.1% compared to the non-spatial equivalent of 5.5% deviance explained.
Fig 1. Spatial distribution of amphibian mortality records.Distribution of amphibian mortality records analysed here (1992–2000) showing a) Ranavirosis positive records and b) Ranavirosis negative records (Occurrence analysis Criteria 1; n = 2,113).
Comparing ranavirosis criteria
When considering Criteria 2 [17], 740 reports were consideredRanavirus-consistent and an additional four variables helped explain ranavirosis occurrence: frog population density (CI: 0.042, 0.410), newt (CI: 0.116, 0.495) and fish presence (CI: 0.077, 0.515) and the use of slug pellets (CI: 0.055, 0.455) (SeeS4 Table). The deviance explained by this model was again very low at 5.07% but higher than the non-spatial equivalent (Deviance explained 2.7%). Ranaviro-sis prevalence results were very similar between criteria, though the level of urbanisation was important for Criteria 2 only (CI: -0.247, -0.133) and the direction of significance differed for pond depth (CI: -0.211, -0.118) (SeeS5 Table). The deviance explained by this model was 21.1%, which is marginally higher than found for criteria 1 and much higher than the non-spa-tial equivalent (Deviance explained 6.2%).
Due to the differences between the results using criteria 1 and 2, we re-ran the analysis ex-cluding mortality events outside of May-September from criteria 2 [17], as this was the main difference between the criteria. This re-analysis resulted in 653Ranavirus-consistent mortality events and both criteria subsequently having very similar predictors for ranavirosis occurrence and prevalence. There was no qualitative difference in results when excluding mortalities out-side of May-September for the occurrence analysis (SeeS6 Table, Deviance explained 7.18%,
Fig 2. Abiotic and Biotic Variables Influencing Ranavirosis Occurrence.Model estimates and 95% confidence intervals for top ranking parametersΔAIC<6 for ranavirosis occurrence (Criteria 1; [9]). Zero is indicated with a dotted line to demonstrate the importance of parameters in which confidence intervals do not overlap zero. Effect sizes above zero denote a positive relationship between each variable and
ranavirosis occurrence.
deviance explained by the non-spatial model 3.33%). The exclusion of mortality events outside of May-September resulted in a positive association between ranavirosis prevalence and pond depth (CI: 0.048, 0.149) and no longer any effect of level of urbanisation (CI: -0.124, 0.005) (SeeS7 Table, Deviance explained 15.3%, Deviance explained of non-spatial model 5.5%).
Discussion
This study has yielded insights into the factors associated with the occurrence and prevalence of ranavirosis in UK common frogs, highlighting the role of bioticandabiotic processes in its impacts. Many of these abiotic characteristics are anthropogenic, highlighting the potential role for human intervention to limit the impacts of this disease. When considering the first dis-ease criteria (Criteria 1, [9]), increased ranavirosis prevalence was associated with increasing frog population density, the presence of fish and newts, increasing pond depths and the use of garden chemicals. Decreased prevalence was associated with the presence of toads (Fig 3,S3 Table). Ranavirosis occurrence was best explained by the presence of toads, an urban setting and the use of fish care products (Fig 2,S2 Table), but these predictors had low explanatory power. Spatial models explained substantially more deviance than non-spatial, highlighting the importance of accounting for the geographic distribution of mortality events.
Fig 3. Abiotic and Biotic Variables Influencing Ranavirosis Prevalence.Model estimates and 95% confidence intervals for top ranking parametersΔQAIC<6 for ranavirosis prevalence (Criteria 1; [9]). Zero is indicated with a dotted line to demonstrate the importance of parameters in which confidence intervals do not overlap zero. Effect sizes below zero indicate a negative relationship between the variable and ranavirosis prevalence and effect sizes above zero indicate a positive relationship.
Biotic drivers
The strong association found here between fish presence and increased ranavirosis prevalence (using both criteria), but only weak evidence for an association between fish presence and the occurrence of ranavirosis (only apparent with criteria 2) may suggest that fish are not neces-sarily a direct source of infection. Common frogs are known to be susceptible to pike-perch iridovirus in experimental conditions [67], and in the wild fish may amplify environmental viral levels, increase the density of potential disease reservoirs, or influence immune function through energy trade-offs or stress hormone production induced from predation risk [68]. Fish susceptibility toRanavirusappears to be low [69], with mortality being in the region of 0–10% [15], [69] but with the ability for viral replication and transfer of the virus to other ver-tebrate classes [15], [69]. Mosquito fishGambusia affinisfor example have been shown to transferRanavirusto 10% of conspecific tadpoles in a controlled environment whilst no fish mortality was detected when tadpoles were initially infected [15]. WhilstRanaviruscould not be re-isolated from experimentally infected goldfish [70], these were not infected with UK iso-lates and so the amplification ability of fish commonly stocked in ponds across the UK is currently unknown.
Alternatively or additionally, predator presence can result in reduced amphibian foraging rates and have subsequent knock on effects for immune system development [68], [71]. Fish are known predators of pre-metamorphic amphibians [72], [73] and wood frog tadpoles exhib-ited delayed development in the presence of predatory dragonfly larvae, resulting in reduced immune function [68]. Dragonfly predator cues have also been shown to decrease survival when in combination withRanavirusexposure for larval tiger salamanders [34]. Further work is needed to confirm the impacts of early life predator exposure on adult common frog immu-nity. Future experiments should determine viral replication rates in commonly stocked pond fish, the effects fish predator cues have on immune function in common frogs throughout life history stages, and how these effects differ among different fish species.
Increased population density of common frogs was an important determinant of increased ranavirosis prevalence, with a large effect size. Whilst this relationship is correlational, it is sug-gestive of density dependent transmission. This would suggest natural regulation of disease lev-els, with low transmission efficiency at low densities resulting in reduced pathogen persistence [76]. Further research with more accurate population density estimates are needed to confirm this pattern, especially since strong associations between fish and newt presence and ranaviro-sis prevalence have been found, which could allowRanaviruspersistence at low primary host densities. Frequency dependent transmission has been found inRanavirus-amphibian systems in North America [53], and previous work in the UK found three outcomes after the first Ranavirus-caused die-off in common frog populations—population extinction, persistent in-fection or recovery [9]—which could indicate a combination of both frequency and density de-pendent transmission [77].
Abiotic drivers
Deeper ponds were associated with increased ranavirosis prevalence. Pond characteristics may have important consequences for disease prevalence due to the short dispersal distances of common frogs [55], [56] and the pathogen’s ability to persist in both pond water and sediment [51]. Deeper ponds could be linked to a multitude of biotic and abiotic characteristics that could influence disease prevalence, such as differing temperatures [21], [78] associated with thermal stratification, water quality [36], levels of emergent vegetation [79] or the presence of predators [34].
The second criteria forRanavirus-consistent mortalities confirmed the positive association between pond depth and disease prevalence, but only when mortalities outside of May-Septem-ber were excluded from the analysis. Deeper ponds may therefore have protective qualities for overwintering frogs, providing decreased likelihood of freezing, cooler temperatures and higher oxygen levels [80], though dissolved oxygen content is likely influenced by multiple factors [81]. Whilst common frogs are thought to be predominantly aquatic hibernators [82], terrestri-al hibernation does terrestri-also occur [83]. Deeper ponds may also be correlated with larger ponds and larger gardens, which may provide more terrestrial hibernacula.
Ranavirosis occurrence was associated with more urban areas, and previous work suggests increased disease prevalence in relation to human modified landscapes is fairly common across taxonomic groups [84]. For example, increased chronic wasting disease prevalence in mule deer was associated with more developed land use [85] and West Nile Virus antibody preva-lence was increased in urban compared to rural songbirds [86]. The mechanisms behind these patterns however differ greatly among host-pathogen systems. Here, the association between ranavirosis occurrence and urban areas may be due to anthropogenic barriers between popula-tions reducing genetic variation and impacting on fitness [87] and disease susceptibility [19] or increased exchange of pond materials between gardens and increased likelihood of introduced species. Densely populated areas will likely be associated with international trade, which is a known route ofRanavirusspread [14], [26–28]. Indeed, urban areas are associated with intro-duced species [88] and species that have been introduced into the UK such as the alpine newt are susceptible toRanavirus[8], [42]. It has also been speculated that introduced North Ameri-can bullfrogs and goldfish have been involved in the spread ofRanavirusinto the UK from its origin in North America [14], [26]. The dataset analysed here only contained records of the presence of ornamental fish, and the full extent of other non-native species in the ponds ana-lysed was unknown.
linked to agricultural run-off associated with rural landscapes and subsequent amphibian im-munosuppression [32], [89]. However, when excluding mortalities outside of May-September, increased ranavirosis prevalence was no longer associated with rural areas, suggesting it is the mortalities in cooler months driving this pattern, perhaps due to harsher winter conditions in rural areas increasing general mortality. Urban and rural common frog populations are known to differ in growth rates [90], gene flow [87] and heavy metal levels [91] but it is unclear how these may interact with disease susceptibility and season to explain this association.
Chemicals used to manage gardens and ponds are known to influence amphibian immune function, with even low pesticide doses resulting in reduced antibody production in leopard frogs (Rana pipiens) [31]. Slug pellets and herbicides are pesticides well known for their detri-mental impacts on wildlife [92–94] and here their use was associated with increased ranavirosis prevalence. Experimental studies on North American species corroborate these findings with increased susceptibility of tiger salamander (Ambystoma tigrinum) larvae toRanavirus infec-tion when exposed to the herbicide atrazine [32] and insecticide chlorpyrifos [33]. Alternative-ly, the association found with slug pellet use could be due to a correlated unrecorded variable rather than the presence of the chemicals themselves. For example, slug pellet use is likely linked to high slug activity, which in turn could be linked to increased temperatures [95] and viral replication, asRanavirusvirulence can be temperature dependent [78]. A better under-standing of the associations found between pesticides and ranavirosis prevalence could be de-termined with further information on quantities of chemicals used, as increasing pesticide concentration has been associated with increasedRanavirusinfection rates [33]. Propensity to use fish care products could be influenced by the general health and condition of the pond, which could explain the association found here between fish care use and ranavirosis occur-rence, though this is unclear and requires further investigation.
The criteria used to define ranavirosis cases were robust, with similar outcomes across anal-yses. The slight differences between criteria in prevalence analyses were re-aligned by the exclu-sion of mortalities outside of May-September. Our concluexclu-sions require some caution because the data were generated by citizens and measurements of environmental variables could not be formally validated. However, the large sample sizes, and informal validation of a subset of data, give us confidence in the conclusions drawn. The explanatory power of the models likely reflect the complexity of wild disease systems which cannot be fully captured by the predominant use of binary variables. The largest predictor of ranavirosis occurrence may more likely be the his-tory ofRanavirusin the area or other environmental conditions such as temperature, which could influence virus replication rate and subsequent detection [13]. Due to the citizen science nature of the data collection, and the fine scale differences in temperature that would be likely within and between gardens, temperature could not be included in the models.
to note that the covariates considered here could have caused sub-lethal affects, such as impacts on growth rates [98] that are not detected in this study due to the focus on mortality.
Conclusions and management implications
Ranavirusis a global issue [5], and has already been implicated in global mass mortalities and the declines of amphibian populations in Spain and the UK [5], [9], [10]. An increased under-standing of the causes of spread ofRanavirusand prevalence of ranavirosis are vital in limiting the impacts of one of several threats—alongside habitat loss and fragmentation—facing am-phibians in the UK [58]. We highlight the role of both ecological and anthropogenic processes as drivers of disease in common frogs. Whilst these should be interpreted with caution, this is the first time that fine scale biotic and abiotic characteristics have been associated with rana-virosis in free living populations in the UK. Though the effects of any garden management changes may be small, these findings represent large scale patterns and should therefore have useful applications for decreasing the number of deaths caused byRanavirus. Beneficial man-agement practises will include reducing the use of herbicides and slug pellets, especially in the summer months whenRanavirusmortalities are at their highest [23], alongside limiting the troduction of non-native species. Whilst our results suggest deeper ponds have the risk of in-creased ranavirosis prevalence, we do not recommend the in-fill of deep ponds until we understand the mechanistic link between pond depth and disease. There are an estimated 2.5– 3.5 million ponds in the UK [99], many of which are stocked with ornamental fish, and public opinion surveys suggest garden chemical use is high (71% of respondents use at least one chemical product) [100]. Pond owners care about the health of their ponds, as evidenced by their mass participation in the Frog Mortality Project over the past twenty years. Furthermore, nearly half of respondents opposing the use of fertilizers in the countryside did so due to the damage caused to wildlife [100]. These factors demonstrate the potential for garden owners to decrease the impacts of human activities on ranavirosis prevalence and the health of garden wildlife as a whole.
Supporting Information
S1 File. Validation of total frog population size estimates.
(DOCX)
S1 Table. Parameters included in all global models.Parameters included in all global models and reasons for their potential relevance to ranavirosis occurrence and prevalence.
(DOCX)
S2 Table. Abiotic and Biotic Variables Influencing Ranavirosis Occurrence for Criteria 1.
Estimates, standard error and confidence intervals for factors affecting ranavirosis occurrence as defined by Criteria 1.
(DOCX)
S3 Table. Abiotic and Biotic Variables Influencing Ranavirosis Prevalence for Criteria 1.
Estimates, standard error and confidence intervals for factors affecting ranavirosis prevalence as defined by Criteria 1.
(DOCX)
S4 Table. Abiotic and Biotic Variables Influencing Ranavirosis Occurrence for Criteria 2.
Estimates, standard error and confidence intervals for factors affecting ranavirosis occurrence as defined by Criteria 2.
S5 Table. Abiotic and Biotic Variables Influencing Ranavirosis Prevalence for Criteria 2.
Estimates, standard error and confidence intervals for factors affecting ranavirosis prevalence as defined by Criteria 2.
(DOCX)
S6 Table. Abiotic and Biotic Variables Influencing Ranavirosis Occurrence for Criteria 2 Excluding Mortalities outside of May-September.Estimates, standard error and confidence intervals for factors affecting ranavirosis occurrence as defined by Criteria 2 but with mortali-ties outside of May-September excluded.
(DOCX)
S7 Table. Abiotic and Biotic Variables Influencing Ranavirosis Prevalence for Criteria 2 Excluding Mortalities outside of May-September.Estimates, standard error and confidence intervals for factors affecting ranavirosis prevalence as defined by Criteria 2 but with mortali-ties outside of May-September excluded.
(DOCX)
Acknowledgments
We would like to thank Froglife (Charity No. 1093372 in England and Wales) for providing the Frog Mortality Project database and for members of the public for submitting their mortali-ty records. Thanks also to Trent Garner for helpful advice throughout and an anonymous re-viewer whose insights and helpful comments improved the quality of our final manuscript.
Author Contributions
Conceived and designed the experiments: AGFG SJP ACN DJH. Analyzed the data: ACN. Wrote the paper: ACN DJH SJP AGFG.
References
1. Stuart SN, Chanson JS, Cox NA, Young BE, Rodrigues ASL, Fischman DL, et al. Status and trends of amphibian declines and extinctions worldwide. Science. 2004; 306: 1783–1786. PMID:15486254
2. IUCN. IUCN Red List Categories and Criteria: Version 3.1. 2nd ed. Gland, Switzerland and Cam-bridge, UK: IUCN; 2012.
3. Skerratt LF, Berger L, Speare R, Cashins S, McDonald KR, Phillott AD, et al. Spread of chytridiomyco-sis has caused the rapid global decline and extinction of frogs. EcoHealth. 2007; 4: 125–134. 4. Collins JP, Storfer A. Global amphibian declines: sorting the hypotheses. Divers Distrib. 2003; 9: 89–
98.
5. Miller D, Gray M, Storfer A. Ecopathology of ranaviruses infecting amphibians. Viruses. 2011; 3: 2351–2373. doi:10.3390/v3112351PMID:22163349
6. Daszak P, Berger L, Cunningham AA, Hyatt AD, Green DE, Speare R. Emerging infectious diseases and amphibian population declines. Divers Distrib. 1999; 9: 141–150.
7. Green DE, Converse KA, Schrader AK. Epizootiology of sixty-four amphibian morbidity and mortality events in the USA, 1996–2001. Ann N Y Acad Sci. 2002; 969: 323–339. PMID:12381613
8. Balseiro A, Dalton KP, Cerro AD, Marquez I, Parra F, Prieto JM, et al. Outbreak of common midwife toad virus in alpine newts (Mesotriton alpestris cyreni) and common midwife toads (Alytes obstetri-cans) in Northern Spain: A comparative pathological study of an emergingRanavirus. Vet J. 2010; 186: 256–258. doi:10.1016/j.tvjl.2009.07.038PMID:19703784
9. Teacher AGF, Cunningham AA, Garner TWJ. Assessing the long-term impact ofRanavirusinfection in wild common frog populations. Anim Conserv. 2010; 13: 514–522.
11. Geng Y, Wang KY, Zhou ZY, Li CW, Wang J, He M, et al. First Report of a Ranavirus Associated with Morbidity and Mortality in Farmed Chinese Giant Salamanders (Andrias davidianus). J Comp Pathol. 2011; 145: 95–102 doi:10.1016/j.jcpa.2010.11.012PMID:21256507
12. Earl JE, Gray MJ. Introduction ofRanavirusto isolated wood frog populations could cause local extinc-tion. EcoHealth. 2014; doi:10.1007/s10393-014-0950-y
13. Chinchar VG. Ranaviruses (familyIridoviridae): emerging cold-blooded killers. Arch Virol. 2002; 147: 447–470. PMID:11958449
14. Hyatt AD, Gould AR, Zupanovic Z, Cunningham AA, Hengstberger S, Whittington RJ, et al. Compara-tive studies of piscine and amphibian iridoviruses. Arch Virol. 2000; 145: 301–331. PMID:10752555 15. Brenes R, Gray MJ, Waltzek TB, Wilkes RP, Miller DL. Transmission ofRanavirusbetween
ectother-mic vertebrate hosts. PLOS ONE. 2014a; 9: e92476. doi:10.1371/journal.pone.0092476PMID:
24667325
16. Gray MJ, Miller DL, Hoverman JT. Ecology and pathology of amphibian ranaviruses. Dis Aquat Org. 2009; 87: 243–266. doi:10.3354/dao02138PMID:20099417
17. Price SJ. Emergence of a virulent wildlife disease: using spatial epidemiology and phylogenetic meth-ods to reconstruct the spread of amphibian viruses. PhD Thesis, Queen Mary University of London. 2013.
18. Haislip NA, Gray MJ, Hoverman JT, Miller DL. Development and disease: How susceptibility to an emerging pathogen changes through anuran development. PLOS ONE. 2011; 6: e22307. doi:10. 1371/journal.pone.0022307PMID:21799820
19. Pearman PB, Garner TWJ. Susceptibility of Italian agile frog populations to an emerging strain of
Ranavirusparallels population genetic diversity. Ecol let. 2005; 8: 401–408. PMID:16119702
20. Hoverman JT, Gray MJ, Haislip NA, Miller DL. Phylogeny, life history, and ecology contribute to differ-ences in amphibian susceptibility to ranaviruses. EcoHealth. 2011; 8: 301–319. doi: 10.1007/s10393-011-0717-7PMID:22071720
21. Rojas S, Richards K, Jancovich JK, Davidson EW. Influence of temperature onRanavirusinfection in larval salamandersAmbystoma tigrinum. Dis Aquat Organ. 2005; 63: 95–100. PMID:15819423
22. Hoverman JT, Gray MJ, Miller DL. Anuran susceptibilities to ranaviruses: role of species identity, ex-posure route, and a novel virus isolate. Dis Aquat Organ. 2010; 89: 97–107. doi:10.3354/dao02200 PMID:20402227
23. Cunningham AA. Investigations into mass mortalities of the common frog (Rana temporaria) in Britain: Epidemiology and aetiology. PhD thesis, University of London; 2001.
24. Gray MJ, Miller DL, Schmutzer AC, Baldwin CA. Frog virus 3 prevalence in tadpole populations inhab-iting cattle-access and non-access wetlands in Tennessee, USA. Dis Aquatic Organ. 2007; 77: 97– 103. PMID:17972750
25. Rachowicz LJ, Hero JM, Alford RA, Taylor JW, Morgan JAT, Vredenburg VT, et al. The Novel and En-demic Pathogen Hypotheses: Competing Explanations for the Origin of Emerging Infectious Diseases of Wildlife. Conserv Biol. 2005; 19: 1441–1448
26. Cunningham AA, Daszak P, Rodriguez JP. Pathogen pollution: Defining a parasitological threat to biodiversity conservation. J Parasitol. 2003; 89: S78–S83.
27. Schloegel LM, Picco AM, Kilpatricka AM, Davies AJ, Hyatt AD, Daszak P. Magnitude of the US trade in amphibians and presence ofBatrachochytrium dendrobatidisandRanavirusinfection in imported North American bullfrogs (Rana catesbeiana). Biol Conserv. 2009; 142: 1420–1426.
28. Kolby JE, Smith KM, Berger L, Karesh WB, Preston A, Pessier AP, et al. First evidence of amphibian chytrid fungus (Batrachochytrium dendrobatidis)andRanavirusin Hong Kong amphibian trade. PLOS ONE. 2014; 9: e90750. doi:10.1371/journal.pone.0090750PMID:24599268
29. Jancovich JK, Davidson EW, Parameswaran N, Mao J, Chinchar VG, Collins JP, et al. Evidence for emergence of an amphibian iridoviral disease because of human-enhanced spread. Mol Ecol. 2005; 14: 213–224. PMID:15643965
30. St-Amour V, Wong WM, Lesbarrères D. Anthropogenic Influence on prevalence of 2 amphibian
patho-gens. Emerg Infect Dis. 2008; 14: 1175–1176. doi:10.3201/eid1407.070602PMID:18598658
31. Albert A, Drouillard K, Haffner GD, Dixon B. Dietary exposure to low pesticide doses causes long-term immunosuppression in the leopard frog (Rana pipiens). Environ Toxicol Chem. 2007; 26: 1179– 1185. PMID:17571683
33. Kerby JL, Storfer A. Combined effects of atrazine and chlorpyrifos on susceptibility of the tiger sala-mander toAmbystoma tigrinumvirus. EcoHealth. 2009; 6: 91–98. doi:10.1007/s10393-009-0234-0
PMID:19415385
34. Kerby JL, Hart AJ, Storfer A. Combined effects of virus, pesticide, and predator cue on the larval tiger salamander (Ambystoma tigrinum). EcoHealth. 2011; 8: 46–54. doi:10.1007/s10393-011-0682-1
PMID:21523490
35. Gahl MK, Calhoun AJK. The role of multiple stressors inRanavirus-caused amphibian mortalities in Acadia National Park wetlands. Can J Zool. 2010; 88: 108–121.
36. Hoverman JT, Gray MJ, Miller DL, Haislip NA. Widespread occurrence ofRanavirusin pond-breeding amphibian populations. EcoHealth. 2012; 9: 36–48. doi:10.1007/s10393-011-0731-9PMID:
22173292
37. Mao J, Green DE, Fellers G, Chinchar VG. Molecular characterization of iridoviruses isolated from sympatric amphibians and fish. Virus Res. 1999; 63: 45–52. PMID:10509715
38. Hedrick RP, McDowell TS. Properties of iridoviruses from ornamental fish. Vet Res. 1995; 26: 423– 427. PMID:8581016
39. Cunningham AA, Hyatt AD, Bennett PM. Experimental transmission of aRanavirusdisease of com-mon toads (Bufo bufo) to common frogs (Rana temporaria). Epidemiol Infect. 2007; 135: 1213–1216. PMID:17274859
40. Duffus ALJ, Nichols RA, Garner TWJ. Experimental evidence in support of single host maintenance of a multihost pathogen. Ecosphere. 2014a; 5: art142 doi:10.1890/ES14-00074.1
41. Duffus ALJ, Nichols RA, Garner TWJ. Detection of a Frog Virus 3-like Ranavirus in Native and Intro-duced Amphibians in the United Kingdom in 2007 and 2008. Herpetol Rev. 2014; 45: 608–610. 42. Arntzen JW, Denoël M, Kuzmin S, Ishchenko V, Beja P, Andreone F, et al.Mesotriton alpestris. The
IUCN red list of threatened species. Version 2014.1.2009. Available:<www.iucnredlist.org>.
Ac-cessed 23 June 2014.
43. Holt RD, Dobson AP, Begon M, Bowers RG, Schauber EM. Parasite establishment in host communi-ties. Ecol Let. 2003; 6: 837–842.
44. Begon M, Bowers RG. Host-Host-Pathogen Models and Microbial Pest Control: The effect of host reg-ulation. J Theor Biol. 1994; 169: 275–287. PMID:7967619
45. Ostfeld RS, Keesing F. The function of biodiversity in the ecology of vector-borne zoonotic diseases. Can J Zool. 2000; 78: 2061–2078.
46. Johnson PTJ, Thieltges DW. Diversity, decoys and the dilution effect: how ecological communities af-fect disease risk. J Exp Biol. 2010; 213: 961–970. doi:10.1242/jeb.037721PMID:20190121
47. Keesing F, Holt RD, Ostfeld RS. Effects of species diversity on disease risk. Ecol Lett. 2006; 9: 485– 498. PMID:16623733
48. Searle CL, Biga LM, Spatafora JW, Blaustein AR. A dilution effect in the emerging amphibian patho-genBatrachochytrium dendrobatidis. Proc Natl Acad Sci U S A. 2011; 108: 16322–16326. doi:10.
1073/pnas.1108490108PMID:21930900
49. Duffus ALJ, Nichols RA, Garner TWJ. Investigations into the life history stages of the common frog (Rana temporaria) affected by an amphibianRanavirusin the United Kingdom. Herpetol Rev. 2013; 44: 260–263.
50. Duffus ALJ.Ranavirusecology in common frogs (Rana temporaria) from the United Kingdom: trans-mission dynamics, alternate hosts and host-strain interactions. PhD thesis, Queen Mary University of London and Zoological Society London; 2009.
51. Nazir J, Spengler M, Marschang RE. Environmental persistence of amphibian and reptilian rana-viruses. Dis Aquat Organ. 2012; 98: 177–184. doi:10.3354/dao02443PMID:22535867
52. Harp EM, Petranka JW.Ranavirusin wood frogs (Rana sylvatica): potential sources of transmission within and between ponds. J Wildlife Dis. 2006; 42: 307–318. PMID:16870853
53. Brunner JL, Schock DM, Collins JP. Transmission dynamics of the amphibianRanavirus Ambystoma tigrinumvirus. Dis Aquat Org. 2007; 77: 87–95. PMID:17972749
54. Arnold HR. Atlas of amphibians and reptiles in Britain. London: HMSO; 1995.
55. Kovar R, Brabec M, Vita R, Bocek R. Spring migration distances of some Central European amphibian species. Amphib-Reptil. 2009; 30: 367–378.
56. Smith MA, Green DM. Dispersal and the metapopulation paradigm in amphibian ecology and conser-vation: are all amphibian populations metapopulations? Ecography. 2005; 28:110–128
58. Beebee TJC. Amphibian conservation in Britain: A 40-year history. J Herpetol. 2014; 48: 2–12. 59. Burnham KP, Anderson DR. Model selection and multimodel inference. 2nd Ed. New York,
Spring-er-Verlag; 2002.
60. Richards SA. Dealing with overdispersed count data in applied ecology. J Appl Ecol. 2008; 45: 218– 227.
61. Grueber CE, Nakagawa S, Laws RJ, Jamieson IG. Multimodel inference in ecology and evolution: challenges and solutions. J Evolution Biol. 2011; 24: 699–711. doi:10.1111/j.1420-9101.2010. 02210.xPMID:21272107
62. R Development Core Team. R: A language and environment for statistical computing. R Foundation for Statistical Computing, Vienna, Austria; 2013. doi:10.3758/s13428-013-0330-5PMID:23519455
63. Wood SN. Fast stable restricted maximum likelihood and marginal likelihood estimation of semipara-metric generalized linear models. J Roy Stat Soc B. 2011; 73: 3–36.
64. Barton K. MuMIn: Multi-model inference. R package version 1.9.13. Available:http://cran.r-project. org/web/packages/MuMIn/MuMIn.pdf. 2013.
65. Buckley J, Beebee TJC. Monitoring the conservation status of an endangered amphibian: the natter-jack toadBufo calamitain Britain. Anim Conserv. 2004; 7: 221–228.
66. Gelman A. Scaling regression inputs by dividing by two standard deviations. Stat Med. 2008; 27: 2865–2873. PMID:17960576
67. Bayley AE, Hill BJ, Feist SW. Susceptibility of the European common frogRana temporariato a panel ofRanavirusisolates from fish and amphibian hosts. Dis Aquat Organ. 2013; 103: 171–83. doi:10. 3354/dao02574PMID:23574703
68. Seiter SA. Predator presence suppresses immune function in a larval amphibian. Evol Ecol Res. 2011; 13: 283–293.
69. Brenes R, Miller DL, Waltzek TB, Wilkes RP, Tucker JL, Chaney JC, et al. Susceptibility of fish and turtles to three ranaviruses isolated from different ectothermic vertebrate classes. J Aquat Anim Health. 2014b; 26: 118–126. doi:10.1080/08997659.2014.886637PMID:24895866
70. Jensen BB, Reschova S, Cinkova K, Ariel E, Vesely T. Common carp (Cyprinus carpio) and goldfish (Carassius auratus)were not susceptible to challenge withRanavirusunder certain challenge condi-tions. Bull Eur Ass Fish Pathol. 2011; 31: 112–118.
71. Narayan EJ, Cockrem JF, Hero JM. Sight of a predator induces a corticosterone stress response and generates fear in an amphibian. PLOS ONE. 2013; 8: e73564. doi:10.1371/journal.pone.0073564
PMID:24009756
72. Monello RJ, Wright RG. Predation by goldfish (Carassius auratus) on eggs and larvae of the eastern long-toed salamander (Ambystoma macrodactylum columbianum). J Herpetol. 2001; 35: 350–353. 73. Leu T, Luscher B, Zumbach S, Schmidt BR. Small fish (Leucaspius delineates) that are often released
into garden ponds and amphibian breeding sites prey on eggs and tadpoles of the common frog (Rana temporaria). Amphibia-Reptilia. 2009; 30: 290–293.
74. Duffus ALJ, Pauli BD, Wozney K, Burnetti CR, Berrill M. Frog virus 3-like infections in aquatic amphibi-an communities. J Wildlife Dis. 2008; 44: 109–120. PMID:18263826
75. Brenes RM. Mechanisms contributing to the emergence ofRanavirusin ectothermic vertebrate com-munities. PhD thesis, University of Tennessee, Knoxville; 2013.
76. Anderson RM, May R. Regulation and stability of host-parasite population interactions: I. Regulatory processes. J Anim Ecol. 1978; 47: 219–247.
77. Ryder JJ, Miller MR, White A, Knell RJ, Boots M. Host-parasite population dynamics under combined frequency- and density-dependent transmission. Oikos. 2007; 116: 2017–2026.
78. Brand M, Gray M, Wilkes B, Brenes R, Miller D. Water temperature affects susceptibility to Ranavirus. 2013 International Symposium on Ranaviruses, Tennessee; 2013.
79. Greer AL, Collins JP. Habitat fragmentation as a result of biotic and abiotic factors controls pathogen transmission throughout a host population. J Anim Ecol. 2008; 77: 364–369. PMID:18005032
80. Said A, Stevens DK, Sehlke G. An Innovative index for evaluating water quality in streams. Environ Manage. 2004; 34: 406–414. PMID:15520897
81. Wilkins Smith D, Piedrahita RH. The relation between phytoplankton and dissolved oxygen in fish ponds. Aquaculture. 1988; 68: 249–265.
82. Tattersall GJ, Ultsch GR. Physiological ecology of aquatic overwintering in ranid frogs. Biol Rev Camb Philos Soc. 2008; 83: 119–40. doi:10.1111/j.1469-185X.2008.00035.xPMID:18429765
84. Brearley G, Rhodes J, Bradley A, Baxter G, Seabrook L, Lunney D, et al. Wildlife disease prevalence in human-modified landscapes. Biol Rev. 2013; 88: 427–442. doi:10.1111/brv.12009PMID:
23279314
85. Farnsworth ML, Wolfe LL, Hobbs NT, Burnham KP, Williams ES, Theobald DM, et al. Human land use influences chronic wasting disease prevalence in mule deer. Ecol Appl. 2005; 15: 119–126. 86. Bradley CA, Gibbs SE, Altizer S. Urban land use predicts West Nile virus exposure in songbirds. Ecol
Appl. 2008; 18: 1083–1092. PMID:18686573
87. Hitchings SP, Beebee JC. Genetic substructuring as a result of barriers to gene flow in urbanRana temporaria(common frog) populations: implications for biodiversity conservation. Heredity. 1997; 79: 117–127. PMID:9279008
88. Riley SPD, Busteed GT, Kats LB, Vandergon TL, Lee LFS, Dagit RG, et al. Effects of urbanization on the distribution and abundance of amphibians and invasive species in southern California streams. Conserv Biol. 2005; 19: 1894–1907.
89. Wauchope RD. The pesticide content of surface water draining from agricultural fields—A review. J Environ Qual. 1978; 7: 459–472.
90. Zeisset I, Beebee TJC. Larval fitness, microsatellite diversity and MHC class II diversity in common frog (Rana temporaria) populations. Heredity. 2010; 104: 423–430. doi:10.1038/hdy.2009.157PMID:
19920858
91. Stolyar OB, Loumbourdis NS, Falfushinska HI, Romanchuk LD. Comparison of metal bioavailability in frogs from urban and rural sites of Western Ukraine. Arch Environ Con Tox. 2008; 54: 107–113. 92. Skinner JA, Lewis KA, Bardon KS, Tucker P, Catt JA, Chambers BJ. An overview of the
environmen-tal impact of agriculture in the UK. J Environ Manage. 1997; 50: 111–128.
93. Kleinkauf A, MacDonald DW, Tattersall FH. A bitter attempt to prevent non-target poisoning of small mammals. Mammal Rev. 1999; 29: 201–204.
94. Freemark K, Boutin C. Impacts of agricultural herbicide use on terrestrial wildlife in temperate land-scapes: A review with special reference to North America. Agr, Ecosyst Environ. 1995; 52: 67–91. 95. Kozlowski J, Jaskulska M, Kaluski T, Kozlowska M. The effect of temperature and humidity on the grazing activity ofDeroceras reticulatumand the damage to rape plants. Folia Malacologica. 2011; 19: 267–271
96. Teacher AGF, Garner TWJ, Nichols R. Evidence for directional selection at a novel major histocom-patibility class I marker in wild common frogs (Rana temporaria) exposed to a viral pathogen ( Rana-virus). PLOS ONE. 2009; 4: e4616. doi:10.1371/journal.pone.0004616PMID:19240796
97. Echaubard P, Leduc J, Pauli B, Chinchar VG, Robert J, Lesbarrères D. Environmental dependency of
amphibian–Ranavirusgenotypic interactions: evolutionary perspectives on infectious diseases. Evol Appl. 2014; 7: 723–733. doi:10.1111/eva.12169PMID:25469155
98. Echaubard P, Little K, Pauli B, Lesbarreres D. Context-dependent effects of ranaviral infection on northern leopard frog life history traits. PLOS ONE. 2010; 5: e13723. doi:10.1371/journal.pone. 0013723PMID:21060894
99. Davies ZG, Fuller RA, Loram A, Irvine KN, Sims V, Gaston KJ. A national scale inventory of resource provision for biodiversity within domestic gardens. Biol Conserv. 2009; 142: 761–771