Movement Discordance between Healthy
and Non-Healthy US Adults
Ann M. Swartz1,2*, Young Cho2,3, Whitney A. Welch1, Scott J. Strath1,2
1Department of Kinesiology, University of Wisconsin-Milwaukee, Milwaukee, WI, United States of America,
2Center for Aging and Translational Research, University of Wisconsin-Milwaukee, Milwaukee, WI, United States of America,3Zilber School of Public Health, University of Wisconsin-Milwaukee, Milwaukee, WI, United States of America
*aswartz@uwm.edu
Abstract
Introduction
Physical activity is known to significantly impact cardiometabolic health. Accelerometer data, as a measure of physical activity, can be used to objectively identify a disparity in movement (movement discordance) between healthy and unhealthy adults. The purpose of
this study was to examine the Movement Discordancebetween healthy and unhealthy
adults in a large US population sample.
Methods
Demographic, health and accelerometer data from the National Health and Nutrition
Exami-nation Study (NHANES) 2003–2004 and 2005–2006 cohorts were used for this study.
Participants were classified as either having a“normal”or“abnormal”value for each
cardio-metabolic health parameter examined, based on published criteria. Linear regression analy-ses were performed to determine significance of each abnormal health parameter (risk factor) in its unique effect on the accelerometer counts, controlling for age and gender. Average accelerometer counts per minute (cpm) by gender and age categories were esti-mated separately for the groups of normal and abnormal cardiometabolic risk.
Results
Average cpm for those with healthy levels of each individual cardiometabolic health param-eter range from 296 cpm (for C reactive protein) to 337 cpm (for waist circumference), while average cpm for those with abnormal levels of each individual cardiometabolic health parameter range from 216 cpm (for insulin) to 291 cpm (for LDL-cholesterol). After control-ling for age and gender, waist circumference, HbA1c, Insulin, Homocysteine, and HDL-Cho-lesterol were the cardiometabolic health parameters that showed significant, unique and independent effects on cpm. Overall, individuals who have abnormal values for all
signifi-cant cardiometabolic health parameters (“unhealthy”) averaged 267 cpm (SE = 15 cpm),
while the healthy sample of this study averaged 428 cpm (SE = 10 cpm). The difference in cpm between the unhealthy and healthy groups is similar between males and females. OPEN ACCESS
Citation:Swartz AM, Cho Y, Welch WA, Strath SJ (2016) Movement Discordance between Healthy and Non-Healthy US Adults. PLoS ONE 11(2): e0150325. doi:10.1371/journal.pone.0150325
Editor:Alejandro Lucia, Universidad Europea de Madrid, SPAIN
Received:October 29, 2015
Accepted:February 11, 2016
Published:February 26, 2016
Copyright:© 2016 Swartz et al. This is an open access article distributed under the terms of the Creative Commons Attribution License, which permits unrestricted use, distribution, and reproduction in any medium, provided the original author and source are credited.
Data Availability Statement:National Health and Nutrition Examination Survey (NHANES) data are available from the Centers for Disease Control and Prevention (CDC) (http://wwwn.cdc.gov/Nchs/ Nhanes/Search/nhanes_continuous.aspx).
Funding:The authors have no support or funding to report.
Further, for both males and females, the cpm gap between unhealthy and healthy is largest in the 30s (males: 183 cpm; females 144 cpm) and lessens as age increases, with the low-est gap seen in those 80+ years (males, 81 cpm; females, 85 cpm).
Conclusion
ThisMovement Discordancebetween healthy and unhealthy adults represents a gap in
movement that needs to be closed to improve the health of individuals with, or at risk for car-diometabolic disease.
Introduction
Accelerometer-based motion sensors have become a widely used method to assess physical activity. Researchers have used various methods to interpret the accelerations recorded by the device, with the use of cut-points being the most widely employed. The cut-point method of interpreting accelerometer data gained quick popularity because it was easy to use and easy to interpret. Further, this method allowed researchers to determine whether individuals were accumulating sufficient moderate-to vigorous physical activity to meet national physical activ-ity recommendations. However, as many have communicated [1,2], there are a number of con-cerns when using the cut-point method of interpreting accelerometer data. First, the ability to compare results between studies applying different cut points become difficult. Second, the cut points are only valid for the specific accelerometer in question and the populations and activi-ties on which they have been developed, resulting in no universal cut-point method for assess-ing physical activity behavior.
Recently there has been interest in the use of total activity counts (TACs) to interpret accel-erometer data. Based on the NHANES dataset, researchers have shown that TACs tend to decrease with age; males tend to have higher TACs than females, with the difference between genders decreasing with age [3,4]. Wolff et al reported that, for the NHANES 2003–2006 sam-ple, males (all ages) in the 50thpercentile accumulated 288,140 TAC/day and females (all ages) in the 50thpercentile accumulated 235,741 TAC/day [5]. Males aged 20, 50, and 80 years in the 50thpercentile accumulated 345,920; 294,720; and 129,282 TAC/day, while females aged 20, 50, and 80 years in the 50thpercentile accumulated 259,903; 241,915; and 117,549 TAC/day, respectively. Finally, TAC has been shown to be more strongly associated with biomarkers of cardiometabolic health than moderate to vigorous physical activity accumulated in bouts of 10 minutes or longer, suggesting the importance of total daily activity to health [6]. Proponents of TACs suggest that this method of reporting accelerometer output provides information on the whole day of activity and includes both the health enhancing and health detracting behaviors because each accelerometer count is reflective of the intensity of the activity [1,5]. However, these values do not account for total daily wear time, and therefore may reflect 12 hours of activity for one individual and 16 hours of activity for another.
To address total daily wear time, others have used cpm for depicting activity patterns across age and gender. Troiano [4] reported mean activity counts per minute (cpm) from the 2003–
averaged 852.4 cpm and the least active group averaged 135.4 cpm. Further, recent studies have reported cpm for those with disease. Individuals with angina (198 ±10 cpm), coronary heart disease (189 ±8 cpm), congestive heart failure (172 ±10 cpm), and myocardial infarction (197 ±9 cpm) had significantly lower cpm than the referent group without disease (245 ±7 cpm), however, stroke survivors (190 ±22 cpm) did not significantly differ from their referent group who did not have a stroke (227 ±22 cpm) [8,9].
Given the relationship between physical activity and chronic acquired diseases, it is impor-tant to explore differences in cpm between those who are healthy and those who have chronic acquired diseases. While researchers are beginning to use cpm more frequently, and provide normative values based upon demographic characteristics, there remains a paucity of data exploring TAC or cpm levels denoting thresholds relative to a full array of cardiometabolc risk factors. This study extends previous work by examining cpm for those with positive and nega-tive risk factors by age and gender to identify a disparity in movement (Movement Discor-dance) between healthy and unhealthy adults. This Movement Discordance represents a gap in movement that needs to be closed to improve the health of individuals with chronic disease or at risk for chronic disease. Examining cpm to determine the Movement Discordance is a simple method that takes into account all the elements of movement and lack of movement (seden-tary, light-, moderate- and vigorous-intensity physical activity), and presents a simple metric that supports the Move for Health message.
Therefore, the purpose of this study was to examine the Movement Discordance between healthy and unhealthy adults based on NHANES data. Specifically, this study aimed to deter-mine the cpm values associated with a healthy individual, and those cpm values associated with elevated risk for cardiometabolic disease by age and gender.
Methods
Participants
Data from the National Health and Nutrition Examination Study (NHANES) 2003–2004 and 2005–2006 cohorts were used for this study. Data included the non-institutionalized, in-person home interview which collected demographic, socioeconomic, health-related information as well as the data collected during the mobile examination center visit (MEC; medical and labo-ratory measures). Inclusion criteria for these analysis consisted of ambulatory adults aged 20 years or older, valid accelerometer data (10h/d of accelerometer wear for at least 4 d) [4], and valid measures of the health variables of interest.
Participants were classified as either having a“normal”or“abnormal”value for each health parameter based on published criteria. Normal systolic blood pressure (SBP; mmHg) was defined as<120 and normal diastolic blood pressure (DBP; mmHg) was defined as<80 [10].
Normal body mass index (BMI; kg/m2) was defined as<25; Normal waist circumference was
defined as Men<= 102, Females<= 88[11]. Normal total cholesterol (mg/dL)<200; Normal
high density lipoprotein cholesterol (HDL-C; mg/dL) was defined as>40; Normal low density
lipoprotein cholesterol (LDL-C; mg/dL) was defined as<100; Normal triglycerides (trig;
mg/dL) was defined as<150 [12]. Normal HbA1c (%) was defined as<5.7; Normal fasting
glucose (mg/dL) was defined as<100; Normal fasting insulin was defined as<25 mIU/L
(<174 pmol/L) [13]. Normal C reactive protein was defined as 1.0–3.0 mg/L; Normal Plasma
homocysteine was defined as Age 0–30 years: 4.6–8.1μmol/L, Age 30–59 years: 6.3–11.2μmol/L,
(males); 4-5-7.9μmol/L (females), Age>59 years: 5.8–11.9μmol/L [14,15].
Study Design & Measures
As part of the NHANES MEC data collection, participants were asked to wear an Actigraph 7164 accelerometer on their right hip during all waking hours for seven consecutive days, and only to remove it while swimming, bathing, or while submerged in water. Data was collected in 60- second epochs. Vertical accelerations were filtered, full-wave rectified, and integrated over time to produce a“count”representative of the intensity of the activity being performed [17].
Non-wear time was defined as 60 or more consecutive minutes of zero counts, allowing up to 2 consecutive minutes with limited movement (<100 cts/min) within the period [4].
A valid day was defined as 10 or more hours of wear, where daily wear time was calculated by subtracting non-wear time from 24 hours[4]. A valid week was defined as 4 or more days [4]. The primary output from the accelerometers was cpm of the vertical axis.
Statistical Analysis
All analyses were conducted using Stata 13 with the survey data analysis module to account for the complex sampling design NHANES employs and the sample weights calculated according to the NHANES analytical guidelines [18]. The outcome variable was normalized by transfor-mation into cube rooted average cpm. Descriptive analyses were conducted to estimate differ-ences between groups of normal and abnormal status of each cardiometabolic risk factors in the level of activity cpm. Second, linear regression analyses were performed to determine sig-nificance of each risk factor in its unique effect on the activity counts, controlling for age and gender. Third, average activity cpm by gender and age categories were estimated separately for the groups of normal and abnormal cardiometabolic risk statuses. Analyses were based on a sample of individuals who met the aforementioned inclusion criteria.
Results
There were 6091 individuals from the NHANES 2003–2004 and 2005–2006 samples who met our inclusion criteria (20+ years of age, valid accelerometer wear time with one or more of the health variables measured) for this analysis (Table 1). However, sample sizes for each specific health variable were lower, based on inclusion/exclusion criteria (Table 2). Overall, approxi-mately half of the sample was female, the majority of the sample was Non-Hispanic White, and over half the sample had a least some college and/or an Associate degree.
Of the sample included in this analysis, over 40% of the sample had elevated systolic blood pressure, diastolic blood pressure, BMI, waist circumference, total cholesterol, LDL-C,
Table 1. Descriptive Statistics of Sample (N = 6091).
Mean (or %)
Age (yr) 48.32 (SE = .45)
Gender (% female) 51.7%
Race/ethnicity (%)
Non-Hispanic White 74.0%
Non-Hispanic Black 9.8%
Mexican American 11.0%
Other 5.2%
Education
<High School 15.8%
High School degree/ GED 25.5%
Some College and/or Associate degree 32.0%
College degree or advance degree 26.7%
triglycerides and glucose (Table 2). Less than one-third of the sample had abnormal levels of HDL-C, HbA1c, fasting insulin, C-reactive protein, and homocysteine.
Table 3shows the mean cpm for individuals who have normal levels versus abnormal levels of each individual cardiometabolic risk factor. Average cpm for those with healthy levels of Table 2. Proportion of sample*with normal or abnormal cardiometabolic health values.
Normal Value Abnormal Value
Total N n % n %
Systolic blood pressure 5913 2216 41.5% 3697 58.5%
Diastolic blood pressure 5913 3394 59.7% 2519 40.3%
BMI 6042 1860 32.8% 4182 67.2%
Waist circumference 5920 2650 46.7% 3270 53.3%
Total cholesterol 5930 2443 42.9% 3487 57.2%
HDL-Cholesterol 2997 2144 73.0% 853 27.0%
LDL-Cholesterol 2705 692 25.9% 2013 74.1%
Triglycerides 2785 1546 59.2% 1239 40.8%
Glucose 2995 1567 57.0% 1428 43.0%
HbA1c 5926 4165 77.1% 1761 22.9%
Insulin 2972 2476 86.5% 496 13.5%
C reactive protein 5897 5820 98.8% 77 1.2%
Homocysteine 5894 4057 70.4% 1837 29.6%
Note.
*Among those 20+ years old with valid day and time of wear. Normal systolic blood pressure (SBP; mmHg)<120; Normal diastolic blood pressure (DBP; mmHg)<80; Normal body mass index (BMI; kg/m2)<25; Normal waist circumference Males<= 102, Females<= 88; Normal total cholesterol (mg/dL) <200; Normal high density lipoprotein cholesterol (HDL-C; mg/dL)<40; Normal low density lipoprotein cholesterol (LDL-C; mg/dL)<100; Normal
triglycerides (trig; mg/dL)<150; Normal HbA1c (%)<5.7; Normal fasting glucose (mg/dL)<100; Normal fasting insulin<25 mIU/L (<174 pmol/L); Normal C reactive protein 1.0–3.0 mg/L; Normal Plasma homocysteine Age 0–30 years: 4.6–8.1μmol/L, Age 30–59 years: 6.3–11.2μmol/L, (males); 4-5-7.9μmol/L
(females), Age>59 years: 5.8–11.9μmol/L.
doi:10.1371/journal.pone.0150325.t002
Table 3. Counts per Minute of Sample by Normal vs. Abnormal Cardiometabolic Risk Factors.
Cardiometabolic risk factors Normal Abnormal Difference Test
Mean* SE Mean* SE t p
Systolic blood pressure 332 3 270 4 13.07 0.000
Diastolic blood pressure 322 3 257 5 11.63 0.000
BMI 316 4 286 4 5.62 0.000
Waist circumference 337 3 264 3 19.07 0.000
Total cholesterol 317 4 279 3 7.99 0.000
HDL-Cholesterol 310 5 257 8 6.47 0.000
LDL-cholesterol 314 8 291 6 2.47 0.019
Triglycerides 320 4 262 8 7.00 0.000
Glucose 319 5 256 6 8.72 0.000
HbA1c 313 3 239 5 13.22 0.000
Insulin 304 4 216 8 10.40 0.000
C reactive protein 296 3 238 15 3.87 0.001
Homocysteine 303 3 277 4 5.35 0.000
Note.
each individual cardiometabolic risk factor range from 296 cpm to 337 cpm, while average cpm for those with abnormal levels of each individual cardiometabolic risk factor range from 216 cpm to 291 cpm. Significant differences between cpm for those with normal and abnormal lev-els of each individual cardiometabolic risk are present for all risk factors, with differences rang-ing from as little as 26 cpm to as large as 88 cpm.
The overall model to predict cube rooted cpm from cardiometabolic factors, controlling for age and gender, was significant (R2= .39, p<.0001). Based on the results of the linear
regres-sion, five risk factors showed significant, unique and independent effects on cube rooted cpm after controlling for gender and age: waist circumference (b = 0.261, SE = 0.053, t = 4.95, p<0.001), HbA1c (b = 0.167, SE = 0.037, t = 4.48, p<0.001), Insulin (b = 0.307, SE = 0.090,
t = 3.42, p = 0.004), Homocysteine (b = 0.223, SE = 0.055, t = 4.06, p = 0.001), and HDL-Cho-lesterol (b = 0.178, SE = 0.082, t = 2.170, p = 0.047), where the beta coefficient of each risk fac-tor indicates the difference between normal and abnormal condition in the cube-rooted cpm. Together, these five risk factors accounted for 14% of the variance in the activity cpm. These data suggest the importance of metabolic (waist circumference, insulin, HbA1c) and cardiovas-cular health (homocysteine, HDL-C) to the activity level of the individual.
Because age and gender were unique and significant contributors to cpm in the model, cpm were explored by age and gender for those with and without cardiometabolic risk factors. Table 4andFig 1show estimated mean cpm for males (Fig 1A) and females (Fig 1B) by age cat-egory who have normal values and who have abnormal values for those 5 cardiometabolic risk
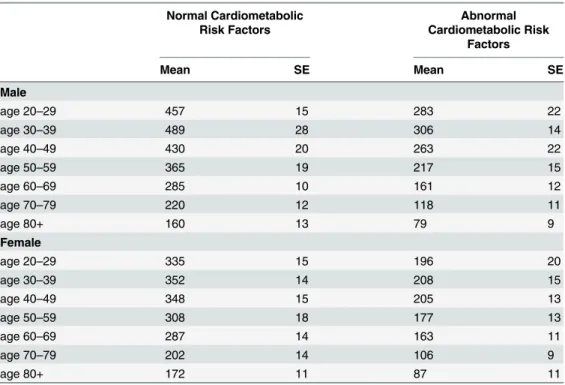
Table 4. Estimated Means of Activity Counts per Minute for healthy adults and adults with cardiometa-bolic disease risk factors#by age and gender (N = 1426
*).
Normal Cardiometabolic Risk Factors
Abnormal Cardiometabolic Risk
Factors
Mean SE Mean SE
Male
age 20–29 457 15 283 22
age 30–39 489 28 306 14
age 40–49 430 20 263 22
age 50–59 365 19 217 15
age 60–69 285 10 161 12
age 70–79 220 12 118 11
age 80+ 160 13 79 9
Female
age 20–29 335 15 196 20
age 30–39 352 14 208 15
age 40–49 348 15 205 13
age 50–59 308 18 177 13
age 60–69 287 14 163 11
age 70–79 202 14 106 9
age 80+ 172 11 87 11
Note
*Overall estimation; gender and age adjusted; No Cardiometabolic Risk Factors (all 5 risk factors within normal limits)
#Cardiometabolic Risk Factors include those signi
ficant contributors to the model: waist circumference, HbA1c, insulin, homocysteine, and HDL-cholesterol
factors identified in the linear regression model. Overall, the healthy sample of this study aver-aged 428 cpm (SE = 10 cpm), with the highest cpm occurring for males and females in their 30s. The difference in cpm between healthy males and females is the largest in the fourth decade of life (ages 30–39 years; d = 137, p =<.001) and decreases with age. In those healthy
individuals 60 years and older, there is little difference in cpm between males and females. For males, cpm increased from 20–29 to 30–39y, and then declined thereafter, with those healthy males aged 80+ years averaging 329 cpm less than healthy males aged 30–39 years. For healthy females, cpm increased slightly from 20–29 to 30–39 years, then remain fairly constant from 30–39 to 40–49 years after which cpm decreased with increasing age. Healthy females show a similar magnitude of decrease in cpm to males, with 300 fewer cpm, on average, at age 80 + years compared with 30–39 years.
Overall, individuals who have abnormal values for all 5 cardiometabolic risk factors (“unhealthy”) averaged 267 cpm (SE = 15 cpm), with the highest cpm occurring for males and females in their 30s (Table 4). Unhealthy males tended to have higher cpm values than unhealthy females, with the largest gender difference in cpm seen in the 30–39 year age cate-gory (98 cpm). This gender difference in cpm decreases with age. In those 60 years and older with cardiometabolic risk factors, there is little difference in cpm between males and females. For unhealthy males, cpm increases from the age group of 20–29 to 30–39, and then declines thereafter, with those unhealthy males aged 80+ years averaging 329 cpm less than males aged 30–39 years. For unhealthy females, cpm increases slightly from 20–29 years to 30–39 years, then remain fairly constant from 30–39 to 40–49 years, and thereafter cpm decrease with increasing age. Unhealthy females show a similar magnitude of decrease in cpm to males, with 300 fewer cpm, on average, at age 80+ years compared with 30–39 years.
The discordance in cpm between healthy individuals and those with cardiovascular risk fac-tors is shown inFig 1. The difference in cpm between those with cardiometabolic risk factors and those without is similar between males and females (Fig 1A & 1B), however, the cpm dif-ference between healthy individuals and individuals with all 5 of the cardiometabolic disease risk factors ranges from 183 cpm (30–39y) to 81 cpm (80+ years) in males (Fig 1A) and 144 cpm (30–39y) to 85 cpm (80+ years) in females (Fig 1B). For both males and females, the gap is lessened as age increases.
Discussion
Research has begun to explore TAC or cpm as a metric of activity, and provided normative cpm based on demographic characteristics, or a single disease. However, there is a knowledge Fig 1. Movement Discordance Gap between healthy individuals and those with cardiometabolic disease risk factors (a) by age for males and (b) by age for females.
gap in the current literature pertaining to TAC or cpm thresholds relative to a full array of car-diometabolc risk factors. This study is the first to report aMovement Discordancein cpm between individuals with and without cardiometabolic risk factors using a nationally represen-tative sample. These differences represent a physical activity gap between healthy and
unhealthy or at-risk individuals, with average cpm of 428 ± 10 cpm for those with healthy levels of individual cardiometabolic risk factors to 267 ± 15 cpm for those with abnormal levels of individual cardiometabolic risk factors. When extrapolating these values out for a full 14 hour day, the healthy individual would accumulate 359,520 total activity counts, and the individual with cardiometabolic risk factors would accumulate 224,280 total activity counts. When com-paring these values to the population-referenced percentiles for total activity counts [5] for a 48 year old (the mean age of this sample), this would place a female between the 75thand 90th per-centile and between the 25thand 50thpercentile, respectively; while a male would be placed between the 50thand 75thpercentiles and just below the 25thpercentile, respectively. Further, these mean values are higher than those reported for individuals with diagnosed cardiovascular disease [8,9]. This discordance represents a goal for individuals to strive towards- those with disease should work towards increasing their cpm up to the level of those without disease through an increase in physical activity and/or a decrease in sedentary behavior. This discor-dance represents a public health opportunity- an activity goal in which all movement and time spent in sedentary behavior is accounted.
When examining each individual risk factor, differences in cpm between those with and without the risk factor range from as little as 26 cpm for homocysteine to as large as 88 cpm for insulin, with the largest gaps, in general, seen in risk factors associated with glucose homeosta-tis and the smallest gaps seen in risk factors associated with cholesterol. These differences in cpm for risk factors are not insurmountable for an unhealthy individual to achieve. For exam-ple, if an individual sits for 10.5 h/d (average cpm = 50), engages in 5h 15min/day of light intensity physical activity (average cpm = 500) and engages in 15 min of moderate intensity physical activity (average cpm = 3000), this individual would average 244 cpm for the day. If this individual then replaced 30 minutes of sitting (50 cpm) with 30 minutes of moderate inten-sity activity (3000 cpm), their average cpm would be 336, a difference of 92 cpm. Alternatively, if this individual did not change the amount of time in any intensity of physical activity or the amount of time they sat, but increased the average cpm in light intensity from 500 to 1000 cpm, this would result in an increase in the average cpm for the day to 408 cpm, a difference of 164 cpm. Therefore, these data support the notion that small changes in physical activity or sedentary behavior can impact the health of an individual with disease.
Previous researchers have reported cpm by age and gender [4–7,19], with decreases in mod-erate- to vigorous physical activity (MVPA) contributing to the decrease in total activity counts, while light intensity physical activity (LPA) remains stable [4,5,20]. The data in this study support previous studies showing a decrease in cpm with age, and a gender influence with males generally having higher cpm than females until the seventh decade of life. After approximately 75 years of age, females accumulate higher cpm than males. These data extend this previous research to examine the influence of cardiometabolic risk factors on cpm, while accounting for age and gender. Results of this study show a strong influence of risk factors on activity level, even after accounting for age and gender. However, it should be noted that this movement gap gets smaller as age increases and the model presented in this paper shows that the cardiometabolic risk factors, age and gender only account for 40% of the variance in cpm, suggesting that there are other factors not explored in this paper that have a strong influence on physical activity level in adults.
measures of movement/physiological response (time spent in various intensities of movement-MVPA). However, these secondary or tertiary data reduction techniques are only valid and reliable when applied to similar populations and using similar equipment and placement of equipment as the original development. Therefore, this study builds upon the work of Wolff and colleagues [20,21] and extends that work to examine the unique effect of disease on cpm, and provides cpm targets for individuals to aspire. A cpm goal allows the individual to achieve that goal by either engaging in more physical activity and/or by sitting less. If a sedentary indi-vidual is given a cpm goal, they may, at first, achieve that goal by sitting less and engaging in more LPA. As they become more comfortable with physical activity and begin to form habits around physical activity, they can start to engage in more intense physical activity to achieve that goal, and ultimately achieve the national physical activity recommendations.
This study is strengthened by the nationally representative sample and large sample size. Further, measurement of physical activity through objective methods and measurement of car-diometabolic risk factors provide concrete values on which to base these analyses. Finally, the use of first order data (cpm) removes any error that would be introduced and possibly magni-fied with the translation of data into second or third order data. Despite these strengths, limita-tions remain. The use of a single hip worn accelerometer may not record all movement, especially upper body work and movement with an external load. However, walking is the most commonly performed activity in the US [21], therefore a hip worn accelerometer should provide a good indication of overall activity level. Future studies should explore more deeply the patterns of physical activity and cpm within day and throughout the week to identify move-ment patterns and opportunities for intervention.
This study introduces a new approach to examine the relationship between movement and disease, providing a clear movement discordance between healthy adults and adults with dis-ease. A clear movement gap, such as this, provides an opportunity for physicians, clinical exer-cise physiologists, and public health officials to use concrete physical activity goals to increase the physical activity levels and decrease sedentary time of those with whom they work in order to improve their cardiometabolic health.
Author Contributions
Conceived and designed the experiments: AS YC WW SS. Analyzed the data: YC. Wrote the paper: AS YC WW SS.
References
1. Bassett DR, Troiano RP, McClain JJ, Wolff DL (2015) Accelerometer-based physical activity: total vol-ume per day and standardized measures. Med Sci Sports Exerc 47: 833–838. doi:10.1249/MSS. 0000000000000468PMID:25102292
2. Strath SJ, Kaminsky LA, Ainsworth BE, Ekelund U, Freedson PS, et al. (2013) Guide to the assessment of physical activity: Clinical and research applications: a scientific statement from the American Heart Association. Circulation 128: 2259–2279. doi:10.1161/01.cir.0000435708.67487.daPMID:24126387 3. Wolff-Hughes DL, Fitzhugh EC, Bassett DR, Churilla JR (2015) Waist-Worn Actigraphy:
Population-Referenced Percentiles for Total Activity Counts in U.S. Adults. J Phys Act Health 12: 447–453. doi:
10.1123/jpah.2013-0464PMID:24905055
4. Troiano RP, Berrigan D, Dodd KW, Masse LC, Tilert T, et al. (2008) Physical activity in the United States measured by accelerometer. Med Sci Sports Exerc 40: 181–188. PMID:18091006
5. Wolff D, Fitzhugh E, Bassett D, Churilla J (2015) Waist-Worn Actigraphy: Population-Referenced Per-centiles for Total Activity Counts in U.S. Adults. Journal of Physical Activity & Health 12: 447–453
7. Evenson KR, Wen F, Metzger JS, Herring AH (2015) Physical activity and sedentary behavior patterns using accelerometry from a national sample of United States adults. Int J Behav Nutr Phys Act 12: 20. doi:10.1186/s12966-015-0183-7PMID:25889192
8. Evenson KR, Butler EN, Rosamond WD (2014) Prevalence of physical activity and sedentary behavior among adults with cardiovascular disease in the United States. J Cardiopulm Rehabil Prev 34: 406–
419. doi:10.1097/HCR.0000000000000064PMID:25068393
9. Butler EN, Evenson KR (2014) Prevalence of physical activity and sedentary behavior among stroke survivors in the United States. Top Stroke Rehabil 21: 246–255. doi:10.1310/tsr2103-246PMID:
24985392
10. James PA, Oparil S, Carter BL, Cushman WC, Dennison-Himmelfarb C, et al. (2014) 2014 evidence-based guideline for the management of high blood pressure in adults: report from the panel members appointed to the Eighth Joint National Committee (JNC 8). JAMA 311: 507–520. doi:10.1001/jama. 2013.284427PMID:24352797
11. (1998) Clinical Guidelines on the Identification, Evaluation, and Treatment of Overweight and Obesity in Adults—The Evidence Report. National Institutes of Health. Obes Res 6 Suppl 2: 51S–209S. PMID:
9813653
12. National Cholesterol Education Program Expert Panel on Detection E, Treatment of High Blood Cho-lesterol in A (2002) Third Report of the National ChoCho-lesterol Education Program (NCEP) Expert Panel on Detection, Evaluation, and Treatment of High Blood Cholesterol in Adults (Adult Treatment Panel III) final report. Circulation 106: 3143–3421. PMID:12485966
13. American Diabetes A (2015) (2) Classification and diagnosis of diabetes. Diabetes Care 38 Suppl: S8–
S16. doi:10.2337/dc15-S005PMID:25537714
14. Melmed S, Polonsky KS, Larsen PR, Kronenberg HM, editors (2011) Williams Textbook of Endocrinol-ogy. 12 ed. Philadelphia, PA: Elsevier Saunders.
15. Ferri FF, editor (2012) Laboratory Tests and Interpretation of Results, Section IV. 1 ed: Elsevier Mosby.
16. Centers for Disease Control and Prevention (2007) National Health and Nutrition Examination Survey (NHANES), Laboratory Procedures Manual. Atlanta, GA: Centers for Disease Control and Prevention.
17. Chen KY, Bassett DR Jr. (2005) The technology of accelerometry-based activity monitors: current and future. Med Sci Sports Exerc 37: S490–500. PMID:16294112
18. Johnson CL, Paulose-Ram R, Ogden CL, Carroll MD, Kruszon-Moran D, et al. (2013) National health and nutrition examination survey: analytic guidelines, 1999–2010. Vital Health Stat 2: 1–24.
19. Copeland JL, Esliger DW (2009) Accelerometer assessment of physical activity in active, healthy older adults. J Aging Phys Act 17: 17–30. PMID:19299836
20. Hawkins MS, Storti KL, Richardson CR, King WC, Strath SJ, et al. (2009) Objectively measured physi-cal activity of USA adults by sex, age, and racial/ethnic groups: a cross-sectional study. Int J Behav Nutr Phys Act 6: 31. doi:10.1186/1479-5868-6-31PMID:19493347