TCD
6, 1085–1115, 2012Widespread glacier thinning in Svalbard
T. D. James et al.
Title Page
Abstract Introduction
Conclusions References
Tables Figures
◭ ◮
◭ ◮
Back Close
Full Screen / Esc
Printer-friendly Version Interactive Discussion
Discussion
P
a
per
|
Dis
cussion
P
a
per
|
Discussion
P
a
per
|
Discussio
n
P
a
per
|
The Cryosphere Discuss., 6, 1085–1115, 2012 www.the-cryosphere-discuss.net/6/1085/2012/ doi:10.5194/tcd-6-1085-2012
© Author(s) 2012. CC Attribution 3.0 License.
The Cryosphere Discussions
This discussion paper is/has been under review for the journal The Cryosphere (TC). Please refer to the corresponding final paper in TC if available.
Observations of widespread accelerated
thinning in the upper reaches of Svalbard
glaciers
T. D. James1, T. Murray1, N. E. Barrand2, H. J. Sykes1, A. J. Fox2, and M. A. King3
1
Department of Geography, Swansea University, Swansea, UK 2
British Antarctic Survey, Cambridge, UK 3
School of Civil Engineering and Geosciences, Newcastle University, Newcastle upon Tyne, UK
Received: 5 February 2012 – Accepted: 5 March 2012 – Published: 15 March 2012
Correspondence to: T. D. James ([email protected])
TCD
6, 1085–1115, 2012Widespread glacier thinning in Svalbard
T. D. James et al.
Title Page
Abstract Introduction
Conclusions References
Tables Figures
◭ ◮
◭ ◮
Back Close
Full Screen / Esc
Printer-friendly Version Interactive Discussion
Discussion
P
a
per
|
Dis
cussion
P
a
per
|
Discussion
P
a
per
|
Discussio
n
P
a
per
|
Abstract
The measured rise in eustatic sea level over the 20th century was dominated by mass loss from the world’s mountain glaciers and ice caps, and predictions suggest that these fresh water reservoirs will remain significant into the 21st century. However, estimates of this mass transfer to the ocean are based on a limited number of
obser-5
vations extrapolated to represent not only regional changes but often changes across individual glaciers. Combining high resolution elevation data from contemporary laser-altimetry surveys and archived aerial photography makes it possible to measure histor-ical changes across a glacier’s entire surface. Here we present a high spatial resolution time-series for six Arctic glaciers in the Svalbard Archipelago spanning 1961 to 2005.
10
We find increasing thinning rates before and after 1990 with elevation losses occurring most notably in the glaciers’ upper reaches. In the absence of a clear meteorological driver, we recommend further investigation into a possible albedo amplification of pre-vailing meteorological trends to explain these higher elevation changes, which could have important consequences on the region’s mass balance due to the sensitivity of
15
its hypsometric distribution. However, the strong influence of decadal-scale variability, while explaining lower rates of mass loss reported in earlier studies, highlights that caution must be exercised when interpreting thinning rates when averaged over long periods.
1 Introduction
20
Reconstructions of global sea level between 1870 and 2004 indicate a 20th century rise of 1.7±0.3 mm a−1including a 0.013±0.006 mm a−2acceleration (Church and White,
2006). The most significant contribution from the cryosphere to this rise in sea level has come from the world’s mountain glaciers and ice caps (Kaser et al., 2006; Lemke et al., 2007; Cazenave et al., 2009; Berthier et al., 2010). While the significance of
25
TCD
6, 1085–1115, 2012Widespread glacier thinning in Svalbard
T. D. James et al.
Title Page
Abstract Introduction
Conclusions References
Tables Figures
◭ ◮
◭ ◮
Back Close
Full Screen / Esc
Printer-friendly Version Interactive Discussion
Discussion
P
a
per
|
Dis
cussion
P
a
per
|
Discussion
P
a
per
|
Discussio
n
P
a
per
|
21st century, the complex drivers of glacier behaviour and thus mass balance are still not entirely understood (Meier et al., 2007).
A compilation of global mass balance records of glaciers and ice caps excluding those associated with the Greenland and Antarctic ice sheets reveal sea level contri-butions of 0.43±0.19 mm a−1 sea level equivalent (SLE) in the last 50 yr with rates of
5
0.33±0.17 mm a−1SLE from 1961 to 1990 and 0.77
±0.15 mm a−1 SLE from 2001 to
2004 (Kaser et al., 2006). Similar estimates for the period 2001 to 2005 are as high as 1.12±0.14 mm a−1SLE (Cogley, 2009). The timing of this increased rate of cryospheric
mass loss agrees well with observed changes in sea level rise (Merrifield et al., 2009). However, there remains a high degree of uncertainty in mass change estimates and
10
therefore in future sea level predictions due largely to a shortage of long-term glacier mass balance records. Records that do exist often rely on the extrapolation of sparse point or profile measurements to the glaciers and regions they are meant to represent, which is especially problematic in mountainous, coastal regions with strong climatic gradients like the Svalbard archipelago.
15
The glaciers and ice caps of Svalbard are considered to be an early indicator of Arctic cryospheric response to climate change due to their position at the northern extent of the warm North Atlantic currents and consequent sensitivity to climatic trends (Fleming et al., 1997; Lefauconnier et al., 1999). Thus, there have been a number of important investigations into the mass balance of the archipelago’s ice. Early reports of stake
20
and pit records dating back to the 1950s found that several Svalbard glaciers were in negative balance and the authors hypothesized that this had probably been the case since their Little Ice Age maximum in the early 20th century (Hagen and Liestøl, 1990; Lefauconnier et al., 1999). The consistent negative balance suggested that Svalbard glaciers were not in balance with current climatic conditions. However, the lack of
25
significant trend in the rates of mass loss indicated no response to climatic warming. A pan-Arctic study of mass balance also reported high rates of mass loss in Svalbard at three glaciers between 1945 and 1995 (−0.55 m water equivalent (w.e.) a−1) but again
TCD
6, 1085–1115, 2012Widespread glacier thinning in Svalbard
T. D. James et al.
Title Page
Abstract Introduction
Conclusions References
Tables Figures
◭ ◮
◭ ◮
Back Close
Full Screen / Esc
Printer-friendly Version Interactive Discussion
Discussion
P
a
per
|
Dis
cussion
P
a
per
|
Discussion
P
a
per
|
Discussio
n
P
a
per
|
in the high annual variability (Dowdeswell et al., 1997). In contrast, more recent studies reported accelerated rates of thinning up to 2005 at three sites in western Svalbard, which were consistent with local climate records (Kohler et al., 2007).
The difficulty in generalising volume or mass balance changes to the archipelago from point, profile or a small number of sites is that it does not account for the ice
hyp-5
sometric distribution or the strong climatic gradients that prevail in Svalbard (Førland and Hanssen-Bauer, 2003). The importance of these parameters were recognized by Hagen et al. (2003) who applied average net balance/altitude curves derived from di-rect mass balance measurements, ice cores and ground penetrating radar (GPR) in 13 identified regions around the archipelago. Using data that covered the period 1969
10
to 1999, they measured a “slightly negative” net balance (−0.014±0.003 m w.e. a−1)
with the majority of loss coming from smaller mountain glaciers with the higher eleva-tion ice caps closer to balance. Advances in airborne and spaceborne surveying have significantly improved the distribution of mass balance measurements to better cap-ture regional variability. Centreline airborne laser surveys in 1996 and 2002 over 16 ice
15
caps and glaciers revealed a complex pattern of elevation change with mean changes of −0.19 m w.e. a−1 (Bamber et al., 2005). A historical context was provided using
old topographic maps and aerial photographs which gave estimated mass changes of
−0.30 m w.e. a−1from the mid 1930s to 1990 in the west and southwest regions (Nuth
et al., 2007) and−0.36±0.02 m w.e. a−1for the period when 1960s data was compared
20
to the early 2000s laser surveys (Nuth et al., 2010).
The mass balance results of the studies cited above vary considerably and compar-ison is difficult due to differences in methodology, study area and temporal coverage. However, there is general agreement that the ice of the Svalbard archipelago is signif-icantly losing mass. While reports based on data from the 1990s and earlier found no
25
TCD
6, 1085–1115, 2012Widespread glacier thinning in Svalbard
T. D. James et al.
Title Page
Abstract Introduction
Conclusions References
Tables Figures
◭ ◮
◭ ◮
Back Close
Full Screen / Esc
Printer-friendly Version Interactive Discussion
Discussion
P
a
per
|
Dis
cussion
P
a
per
|
Discussion
P
a
per
|
Discussio
n
P
a
per
|
evidence suggests that sparse direct or indirect mass balance data are not necessarily representative of regional-scale or even glacier-wide mass changes (Barrand et al., 2010; Berthier et al., 2010). As yet no study of Svalbard mass balance has been able to provide: (i) a distributed sample of study sites; (ii) long-term time series (up to 44 yr); (iii) over several epochs; (iv) using high resolution, full-area topographic data that does
5
not rely on extrapolation.
In this paper we combine historical aerial photographs and contemporary airborne laser altimetry (lidar) surveys to produce a minimum of three epochs of high resolution DEMs for six sites around Svalbard. The resulting volume change measurements are produced from tens of thousands of individual change measurements for each site that
10
cover the full glacier width without extrapolation. This approach enables the resolution of spatially variable changes that are not necessarily represented by centreline pro-files and therefore will provide improved understanding of glacier mass balance in the Svalbard Archipelago.
2 Data and methods
15
2.1 Topographic modelling
We targeted a number of potential sites around the Svalbard archipelago for topo-graphic modelling. Site selection was based on a number of factors including spatial distribution, elevation range, aspect, and suitability for photogrammetry. Since pho-togrammetry is dependent on stable surfaces from which ground control points (GCP)
20
can be measured in photographs, potential sites were limited to those whose geometry provided a sufficient distribution of exposed bedrock and stable depositional features. Aerial photographic coverage of Svalbard has been frequent but incomplete with only the 1990 campaign offering near complete coverage of the archipelago. Thus, during the site selection process we identified glaciers where at least two epochs of
pho-25
TCD
6, 1085–1115, 2012Widespread glacier thinning in Svalbard
T. D. James et al.
Title Page
Abstract Introduction
Conclusions References
Tables Figures
◭ ◮
◭ ◮
Back Close
Full Screen / Esc
Printer-friendly Version Interactive Discussion
Discussion
P
a
per
|
Dis
cussion
P
a
per
|
Discussion
P
a
per
|
Discussio
n
P
a
per
|
and typically poor image quality, we opted to exclude the high-oblique photographs from the 1930s. Since the methods employed here cannot account for mass losses from tidewater calving or surging glacier dynamics we limited sites to land-terminating, non-surge-type glaciers. Therefore, the results presented below do not account for any dynamically-driven changes in glacier volume in Svalbard although like Nuth et
5
al. (2007) we assume these to be small compared to elevation changes (Paterson, 1994).
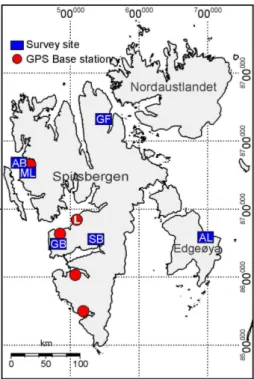
Of the sites selected, high resolution lidar surveys were successfully undertaken for 6 glaciers (Fig. 1 and Table 1). These glaciers included Austre Brøggerbreen (AB), Al-brechtbreen (AL), Grønfjordbreen (GB), Gullfaksebreen (GF), Midtre Lov ´enbreen (ML)
10
and Slakbreen (SB). Surveys were undertaken during summer 2003 and 2005 by the Airborne Research and Survey Facility (ARSF) of the U.K.’s Natural Environment Re-search Council (NERC) using an Optech ALTM 3033 laser scanner that recorded first and last laser return and accompanying 8-bit laser return intensity. Post-processing of lidar data required coincident, high quality global positioning system (GPS) data from
15
base stations within ∼50 km of the aircraft, which we installed and operated during
the field campaigns (Fig. 1). While AL and GF were both beyond this range, com-parison with lidar processed using advanced long-baseline GPS processing produced only negligible improvement in data quality. All lidar post-processing, when laser data are combined with GPS and onboard navigation data, was carried out at the Unit for
20
Landscape Modelling, University of Cambridge.
As an initial data quality control, lidar data points with low laser return intensity were checked for errors since lidar elevation quality are highly dependent on signal-to-noise ratio (Wehr and Lohr, 1999) and thus are more likely to represent erroneous eleva-tion measurements. However, it is important to check lidar data quality independently,
25
TCD
6, 1085–1115, 2012Widespread glacier thinning in Svalbard
T. D. James et al.
Title Page
Abstract Introduction
Conclusions References
Tables Figures
◭ ◮
◭ ◮
Back Close
Full Screen / Esc
Printer-friendly Version Interactive Discussion
Discussion
P
a
per
|
Dis
cussion
P
a
per
|
Discussion
P
a
per
|
Discussio
n
P
a
per
|
thus were influenced by the changing ice surface. Lidar data quality was more ap-propriately assessed at the local airport runway (L, Fig. 1) whose surface had been surveyed with dGPS. The comparison confirmed that the error of the lidar data were within the manufacturers specifications of±0.10 m which we adopt for this study.
Historical DEMs were generated using archived stereo aerial photography held by
5
the Norwegian Polar Institute (Table 1), which were processed in the SOCET SET dig-ital photogrammetry suite. The use of a calibrated metric camera during each historic mission meant that internal camera errors could be modelled and removed to improve DEM quality. GCPs were extracted from lidar DEMs on stable land surfaces around each site with the aid of image enhancement techniques like relief-shading and
con-10
trast stretching. To compensate for the lower quality of lidar-derived GCPs compared to traditional survey-quality ground control, we collected a larger number of GCPs (40 to 80 points) and tie points (>100 points) than would traditionally be used in
photogram-metric processing in order to increase the measurement redundancy in the adjustment of the block of photographs (James et al., 2006; Barrand et al., 2009). DEMs were
15
extracted automatically from the adjusted photographs on a 10 m grid where image contrast permitted good autocorrelation between images. In areas of poor contrast (i.e. where surfaces were snow covered or in dark shadow) DEM points were mea-sured manually where possible using the software’s 3D-editing capabilities.
Since glacier surfaces are not stable over time, the assessment of photogrammetric
20
DEM quality was not straightforward. Typically, DEM quality is measured in terms of: (i) the fit of the measured points and camera calibration parameters to the block adjustment solution given in root mean square error (RMSE) of X, Y and Z coordinates; and (ii) the comparison of the DEM to an independent check data set (Wolf and Dewitt, 2000). It was not possible to collect a temporally coincident DEM over reasonable
25
TCD
6, 1085–1115, 2012Widespread glacier thinning in Svalbard
T. D. James et al.
Title Page
Abstract Introduction
Conclusions References
Tables Figures
◭ ◮
◭ ◮
Back Close
Full Screen / Esc
Printer-friendly Version Interactive Discussion
Discussion
P
a
per
|
Dis
cussion
P
a
per
|
Discussion
P
a
per
|
Discussio
n
P
a
per
|
adjustment suggested a good fit of the measured parameters to the block solution with average RMSE of the ground control in X, Y and Z of 1.33, 1.50 and 0.43 m, respectively. The comparison of the photogrammetric DEMs to the lidar using the test site yielded errors ranging from±0.25 m in good contrast areas to±1.5 m in poor
contrast areas. Since there is a degree of spatial autocorrelation of elevation errors in
5
the differenced DEMs (Rolstad et al., 2009), we conservatively adopted the latter for the photogrammetric DEM error in the following analysis.
2.2 Sequential DEM analysis
Two periods of elevation and volume change were measured across our sample glaciers using sequential DEM analysis approximately covering the periods 1961–1990
10
and 1990–2005 (Table 1). These epochs, which were available at all six sites, were the main focus of this study. However, an photographs from 1977 was also available at AB, ML and SB providing an intermediate period over which to measure elevation and volume changes.
Differencing DEMs for volume change measurement, known as the geodetic method,
15
is the most accurate method over long periods (Cox and March, 2004) and provides measurement of elevation and volume changes across a glacier’s full width. This ap-proach eliminates the need for extrapolation of point or profile measurements, which is especially important in the glaciers’ higher reaches where shadowing and drifting snow can make surface elevation changes more variable at a given elevation. It is ideal for
20
application in Svalbard where climate-driven elevation changes are large compared to ice fluxes and density changes (Kohler et al., 2007).
2.3 Svalbard hypsometry
To put our results in the context of the area-altitude distribution of the archipelago’s ice, we measured Svalbard’s hypsometry for each drainage basin using digitized drainage
25
TCD
6, 1085–1115, 2012Widespread glacier thinning in Svalbard
T. D. James et al.
Title Page
Abstract Introduction
Conclusions References
Tables Figures
◭ ◮
◭ ◮
Back Close
Full Screen / Esc
Printer-friendly Version Interactive Discussion
Discussion
P
a
per
|
Dis
cussion
P
a
per
|
Discussion
P
a
per
|
Discussio
n
P
a
per
|
DEM. Drainage basins were geocoded using map grid intersections and converted to binary masks which were applied to the DEM using only on-ice points. From this ice-DEM, hypsometry curves were produced for each drainage basin.
3 Results
Our sequential DEM analysis revealed changes in frontal position and elevation
consis-5
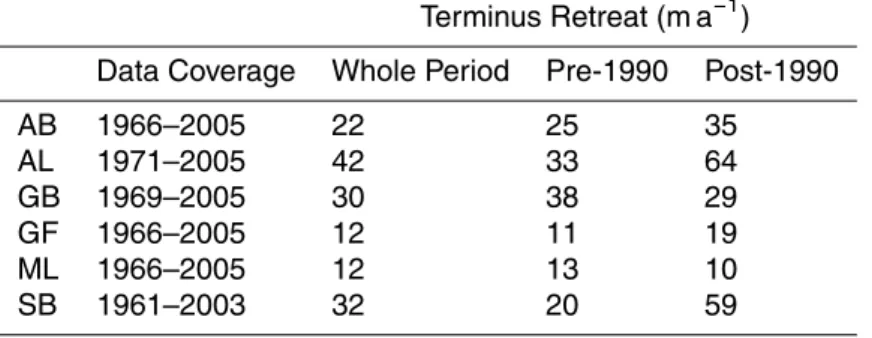
tent with glaciers adjusting to a warming climate with thinning greatest at the retreating termini and decreasing up-glacier (Fig. 2). Terminus position data in Table 2 show that all six of the glaciers experienced significant retreat over the period of observation.
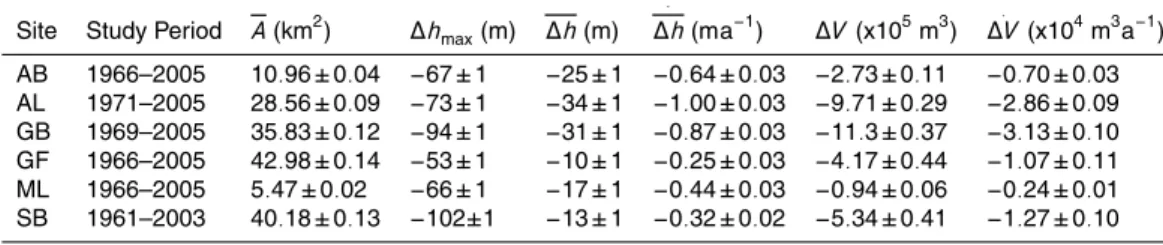
Elevation change statistics (Table 3) show maximum elevation changes (∆hmax) be-tween 1961–2005 were recorded at SL and GB, which both lost more than 90 m of
10
elevation over the study period at their 2003 and 2005 termini, respectively. Even the northeast site (GF), in an area thought to be closer to balance (Nuth et al., 2010), experienced elevation losses of over 50 m. The site with the highest mean annual
el-evation change (
.
∆h), was low-lying AL on the eastern island of Edgeøya, which lost
an average of 1.00±0.03 m a−1over its surface. Elevation changes across all our sites
15
averaged−0.59±0.04 m a−1 between 1961–2005. The terminal retreat and elevation
losses we observe suggest that all six of our sites have been in significant negative mass balance over the period of observation.
Pre- and post-1990
.
∆h for each site are given in Table 4 and reveal a
sig-nificant increase of thinning between these periods. Average
.
∆h increased from
20
−0.52±0.09 m a−1 before 1990 to−0.76±0.10 m a−1 after 1990 representing a 46 % increase in thinning rates between the two periods. Increases in thinning rates over these periods of similar magnitude were previously reported for parts of western Sval-bard (Kohler et al., 2007). However, the inclusion of an intermediate epoch of pho-tographs flown in 1977 at AB, ML and SB illustrates the difficulty of interpreting
eleva-25
TCD
6, 1085–1115, 2012Widespread glacier thinning in Svalbard
T. D. James et al.
Title Page
Abstract Introduction
Conclusions References
Tables Figures
◭ ◮
◭ ◮
Back Close
Full Screen / Esc
Printer-friendly Version Interactive Discussion
Discussion
P
a
per
|
Dis
cussion
P
a
per
|
Discussion
P
a
per
|
Discussio
n
P
a
per
|
periods. The rates of elevation change from Table 4 for AB, ML and SB imply a uniform annual thinning rate before 1990 that is significantly lower than after 1990. However, Fig. 3 shows that the lower thinning rates of the earlier epoch at AB (and to some extent ML) are the result of lower thinning rates during the period 1977–1990. Conversely, SB experienced a fairly constant increase in thinning over the whole period.
5
The most important finding from our analysis is that some of the greatest increases
in
.
∆hoccurred in the higher reaches of the glaciers in areas of former snow
accumu-lation. These findings were possible because of the high resolution, full-width DEMs which provided a detailed analysis of elevation changes by altitude without the need for extrapolation. As expected, elevation changes were greatest at lower altitudes with
10
maximum changes reaching almost−2.5 m a−1 at SB (Fig. 4). Plotting these changes
in
.
∆hagainst elevation for each site emphasises how the glaciers’ upper reaches are
consistently experiencing similar or indeed greater increases in thinning rates than at their termini (Fig. 5).
4 Discussion
15
4.1 Meteorological context
A strong link between net mass balance and both summer temperatures and winter precipitation has been demonstrated in Svalbard (Hagen and Liestøl, 1990; Lefaucon-nier et al., 1999) and thus we interpreted our results in the context of the local meteorol-ogy using data from the Longyearbyen meteorological station (L, Fig. 1). Between 1961
20
and 2005, annual mean temperature at Longyearbyen increased by 1.8◦C. However,
high interannual and decadal variability means long-term trends must be large in or-der to be statistically significant (Førland and Hanssen-Bauer, 2003). Alternatively, the June, July, August (JJA) mean temperature at Longyearbyen increased significantly (with 95 % confidence) by 0.02◦C a−1 between 1961–2005 (Fig. 6). No significant
TCD
6, 1085–1115, 2012Widespread glacier thinning in Svalbard
T. D. James et al.
Title Page
Abstract Introduction
Conclusions References
Tables Figures
◭ ◮
◭ ◮
Back Close
Full Screen / Esc
Printer-friendly Version Interactive Discussion
Discussion
P
a
per
|
Dis
cussion
P
a
per
|
Discussion
P
a
per
|
Discussio
n
P
a
per
|
trend was measured during 1961–1990 but JJA temperatures after 1990 increased significantly by 0.07◦C a−1. These warming temperature trends are likely driving the
acceleration of thinning at low elevations but they cannot independently account for the increased rates of change we see at higher elevation.
To explain the intermediate period of lower thinning rates, we calculated the average
5
annual positive degree day (PDD) for each period and compared them to the mean PDD for the whole time series (Fig. 6). This comparison revealed that the 1980s was indeed a period of significantly cooler summer temperatures than either the preceding or following period. While this accounts for the mass loss at AB and ML during this pe-riod, this appears to have not occurred further south at SB where there is no evidence
10
of glacier response to this cooler period. Coincidentally, the Svalbard mass balance research published in the 1990s was based on time series that terminated around the end of this cold period, which would explain the lack of trend in rates of mass loss for many of these earlier studies. Clearly these results are indicative of the extreme regionality of Svalbard’s climate and the strong sensitivity of glaciers to even decadal
15
meteorological trends. There is clearly a need to interpret geodetic volume and mass changes in the context of the prevailing meteorological conditions at the time of each epoch in the time series.
An analysis of Longyearbyen precipitation data revealed a strong post-1990 negative trend in total precipitation (−4.4 mm a−1) but no significant trend over the whole period.
20
In contrast, solid precipitation decreased significantly since 1961 (−0.9 mm a−1) with
a stronger negative trend since 1990 (−3.0 mm a−1). To put this in context, at these
rates annual precipitation in 2005 was predicted to be ∼45 mm less (750 mm snow
equivalent assuming fresh snow density of 60 kg m−3) than it was in 1990 in a region
with already relatively low accumulation rates of less than 1 m w.e. a−1 (Hagen et al.,
25
2003a).
TCD
6, 1085–1115, 2012Widespread glacier thinning in Svalbard
T. D. James et al.
Title Page
Abstract Introduction
Conclusions References
Tables Figures
◭ ◮
◭ ◮
Back Close
Full Screen / Esc
Printer-friendly Version Interactive Discussion
Discussion
P
a
per
|
Dis
cussion
P
a
per
|
Discussion
P
a
per
|
Discussio
n
P
a
per
|
at Midtre Lov ´enbreen (ML) for the period 2003–2005 (Fig. 4) displays the same pattern of increased high elevation thinning found elsewhere during two years when the entire glacier surface was essentially snow-free at the time of data acquisition. Therefore, we conclude that increased thinning rates in the glaciers’ upper reaches cannot be fully explained by differences in accumulation rate driven by temperature and precipitation
5
trends.
4.2 Role of Albedo
Kohler et al. (2007) suggested an increase in albedo might be responsible for higher thinning rates at higher elevations at ML. The role of surface albedo during the 2010 Greenland melt season was recently demonstrated (Tedesco et al., 2011) and our
ob-10
servations of widespread enhanced thinning at higher elevations are consistent with a decrease in albedo attributable to a loss of summer snow cover from higher sum-mer temperatures and lower winter precipitation. The loss of a reflective and insulat-ing layer of snow amplifies these prevailinsulat-ing meteorological trends and has a signifi-cant and immediate impact on albedo since bare ice absorbs about three times as
15
much of the Sun’s energy as snow (Paterson, 1994). The so-called albedo feedback is closely interconnected with the balance-altitude feedback, where surface lowering from melt or from decreasing winter accumulation, exposes ice to warmer altitudes thereby enhancing melting. Both were described by Kaser et al. (2006) as two of the most important feedbacks reinforcing the response of glacier mass wastage to
post-20
1970 climate warming. The decreasing albedo from the deposition of fossil-fuel black carbon is thought to be responsible for over two thirds of Arctic warming since the mid-1970s (Shindell and Faluvegi, 2009). Measurements of atmospheric black carbon near Ny ˚Alesund in northwest Svalbard were lower between 1979–1989 than during both 1990–1992 (Heintzenberg and Leck, 1994) and 1997–2007 (Eleftheriadis et al.,
25
TCD
6, 1085–1115, 2012Widespread glacier thinning in Svalbard
T. D. James et al.
Title Page
Abstract Introduction
Conclusions References
Tables Figures
◭ ◮
◭ ◮
Back Close
Full Screen / Esc
Printer-friendly Version Interactive Discussion
Discussion
P
a
per
|
Dis
cussion
P
a
per
|
Discussion
P
a
per
|
Discussio
n
P
a
per
|
4.3 Hypsometric context and upscaling
Independent of their cause, the changes we have observed have important implications for the mass balance of the archipelago. Critically, Svalbard’s ice is especially sensitive to changes in the equilibrium line altitude (ELA) due to its hypsometric distribution which places the bulk ofSvalbard’s ice close to the current estimated ELA (Fig. 7).
5
Consequently, even small changes in the ELA will have a large impact on the mass balance of the archipelago (Hagen et al., 2003b). To illustrate, at its estimated average altitude of∼460 m a.s.l., a 50 m increase in the ELA (or an equivalent surface lowering) would result in a loss of ∼3000 km2 of accumulation area, which is equal to ∼8 % of
Svalbard’s ice-covered area and ∼18 % of the accumulation zone according to most
10
recent estimates (Hagen et al., 1993). Additionally, current estimates of Svalbard’s ELA and hypsometry are based largely on the 1990 aerial survey and our results show that Svalbard’s ice has already undergone significant changes since that time. It is clear from Fig. 7 that in the later period, no accumulation area exists at all elevations included in this study.
15
Finally, to put our results in context of other Svalbard mass balance studies, we up-scaled our average thinning rates to the archipelago, excluding Nordaustlandet and Kvitøya, by applying the average elevation change-altitude curves to our hypsometry in 50 m elevation bins (Fig. 7). Using a ice density of 918 kg m−3 and assuming that
changes at elevations above our study sites were within the error limits of this
anal-20
ysis, we calculated a mass balance of −0.46±0.03 m w.e. a−1 over the whole time
series (1961–2005) with balances before and after 1990 of −0.37±0.07 m w.e. a−1 and −0.61±0.07 m w.e. a−1, respectively. There is di
fficultly in comparing the results between different mass balance studies due to the varying time scales and different areas of focus especially given the strong regionality of the area. We expect our
up-25
TCD
6, 1085–1115, 2012Widespread glacier thinning in Svalbard
T. D. James et al.
Title Page
Abstract Introduction
Conclusions References
Tables Figures
◭ ◮
◭ ◮
Back Close
Full Screen / Esc
Printer-friendly Version Interactive Discussion
Discussion
P
a
per
|
Dis
cussion
P
a
per
|
Discussion
P
a
per
|
Discussio
n
P
a
per
|
2010). As such, our estimate for the whole study period is higher than that of Nuth et al. (2010), which looked at a similar period but included the large Vestfonna ice cap in north eastern Svalbard. However, our measured increase in mass loss from pre- to post-1990 is similar in magnitude to the increase in sea level contributions from glaciers and ice caps globally reported by Kaser et al. (2006) for similar periods.
5
For comparison to results from the Gravity Recovery and Climate Experiment (GRACE) satellite mission, we convert our geodetic mass balances using ice area from Nuth et al. (2010) to −11.1±0.8 Gt a−1 from 1961–2005 and increasing from −9±2 to−15±2 Gt a−1 before and after 1990, respectively. Our post-1990 mass loss
(1990–2005), while significantly higher than the Wouters et al. (2008) calculation of
10
−8.8±3 Gt a−1 between February 2003 and January 2008, is in agreement with the −15.5±2.4 Gt a−1 calculated for the period January 2003 to January 2009 using a
destriping-filtered GRACE solution (M ´emin et al., 2011), which suggests similar rates of mass loss over the two decades. However, our results from the intermediate DEM epoch as well as recent reports of non-linear trends in ice mass change over periods as
15
little as 3 yr from superconducting gravimeter time series (Omang and Kierulf, 2011) warns against comparing mass change rates for different time periods.
5 Conclusions
Our high resolution time series of glacier DEMs derived from archived aerial pho-tographs and lidar reveal a significant increase in thinning of Svalbard glaciers from
20
the period 1961–1990 and 1990–2005 with a notable increase in thinning rates in the glaciers’ upper reaches of a similar magnitude to that measured at the glaciers’ termini. Analysis of local meteorological data reveal that while a positive trend in summer tem-perature and a negative trend in winter accumulation are no doubt behind the overall increase in thinning, we find no metrological explanation for this high elevation thinning.
25
TCD
6, 1085–1115, 2012Widespread glacier thinning in Svalbard
T. D. James et al.
Title Page
Abstract Introduction
Conclusions References
Tables Figures
◭ ◮
◭ ◮
Back Close
Full Screen / Esc
Printer-friendly Version Interactive Discussion
Discussion
P
a
per
|
Dis
cussion
P
a
per
|
Discussion
P
a
per
|
Discussio
n
P
a
per
|
factor in the Arctic amplification of climate warming (Serreze et al., 2002; Lemke et al., 2007) and recently demonstrated in Greenland (Tedesco et al., 2011). If this is the case, our study provides the first widespread observation of this amplification effect on the geometry and area-altitude distribution of Arctic glaciers. Taken in the context of Svalbard’s high sensitivity to changes in the ELA, the net effect will be a loss of a
signif-5
icant proportion of the former snow accumulation area to summer ablation. However, our analysis of elevation changes during a colder period in the 1980s showed that decadal-scale meteorological variability, while having a significant impact on glacier surface changes, might be very local in Svalbard, which complicates the interpretation of changes in glacier geometry and mass results when averaged over long time
pe-10
riods and from only a few records. Our findings highlight a need for continued high resolution monitoring and lend support to conclusions that acceleration in the melt of mountain glaciers and ice caps is partly responsible for post-1990 acceleration in sea level rise (Merrifield et al., 2009) and that albedo feedbacks are reinforcing the glacial response to recent climate warming (Kaser et al., 2006).
15
Acknowledgements. SLICES was funded by the UK NERC (NE/B505203/1). TDJ’s work was also supported by the GLIMPSE project funded by The Leverhulme Trust (F/00391/J) and the Climate Change Consortium for Wales (C3W). NEB’s contribution was supported by NERC studentship NER/S/A/2003/11279. Lidar data were flown by the NERC Airborne Research and Survey Facility and processed by the Unit for Landscape Modelling, University of
Cam-20
bridge. Access and facilities at the Ny ˚Alesund geodetic observatory were provided by Statens Kartverk, Norway. The authors would like to thank: BAE Systems (SOCETSET), Applied Im-agery (Quick Terrain Modeler) and Jack Kohler (Norwegian Polar Institute) for their support. Field assistants included Artur Adamek, Trine Abrahamsen, Brian Barrett, Suzanne Bevan, Remko de Lange, Adrian Luckman and Irina Solovjanova.
TCD
6, 1085–1115, 2012Widespread glacier thinning in Svalbard
T. D. James et al.
Title Page
Abstract Introduction
Conclusions References
Tables Figures
◭ ◮
◭ ◮
Back Close
Full Screen / Esc
Printer-friendly Version Interactive Discussion
Discussion
P
a
per
|
Dis
cussion
P
a
per
|
Discussion
P
a
per
|
Discussio
n
P
a
per
|
References
Bamber, J. L., Krabill, W., Raper, V., Dowdeswell, J. A., and Oerlemans, J.: Elevation changes measured on Svalbard glaciers and ice caps from airborne laser data, Ann. Glaciol., 42, 202–208, 2005.
Barrand, N. E., Murray, T., James, T. D., Barr, S. L., and Mills, J. P.: Optimizing photogrammetric
5
DEMs for glacier volume change assessment using laser-scanning derived ground-control points, J. Glaciol., 55, 106–116, 2009.
Barrand, N. E., James, T. D., and Murray, T.: Spatio-temporal variability in elevation changes of two high-Arctic valley glaciers, J. Glaciol., 56, 771–780, 2010.
Berthier, E., Schiefer, E., Clarke, G. K. C., Menounos, B., and R ´emy, F.: Contribution
10
of Alaskan glaciers to sea-level rise derived from satellite imagery, Nat. Geosci., 3, 2, doi:10.1038/NGEO737, 2010.
Cazenave, A., Dominh, K., Guinehut, S., Berthier, E., Llovel, W., Ramillien, G., Ablain, M., and Larnicol, G.: Sea level budget over 2003–2008: a reevaluation from GRACE space gravimetry, satellite altimetry and Argo, Global Planet Change, 65, 83–88,
15
doi:10.1016/j.gloplacha.2008.10.004, 2009.
Church, J. A. and White, N. J.: A 20th century acceleration in global sea-level rise, Geophys. Res. Lett., 33, doi:10.1029/2005GL024826, 2006.
Cogley, J. G.: Geodetic and direct mass-balance measurements: comparison and joint analy-sis, Ann. Glaciol., 50, 96–100, 2009.
20
Cox, L. H. and March, R. S.: Comparison of geodetic and glaciological mass-balance tech-niques, Gulkana Glacier, Alaska, U.S.A., J. Glaciol., 50, 363–370, 2004.
Dowdeswell, J. A., Hagen, J. O., Bj ¨ornsson, H., Glazovsky, A. F., Harrison, W. D., Holmlund, P., Jania, J., Koerner, R. M., Lefauconnier, B., Ommanney, C. S. L., and Thomas, R. H.: The mass balance of circum-Arctic glaciers and recent climate change, Quaternary Res.,
25
48, 1–14, 1997.
Eleftheriadis, K., Vratolis, S., and Nyeki, S.: Aerosol black carbon in the European Arctic: measurements at Zepplin station, Ny ˚Alesund, Svalbard from 1998–2007, Geophys. Res. Lett., 36, L02809, doi:10.1029/2008GL035741, 2009.
Fleming, K. M., Dowdeswell, J. A., and Oerlemans, J.: Modelling the mass balance of northwest
30
TCD
6, 1085–1115, 2012Widespread glacier thinning in Svalbard
T. D. James et al.
Title Page
Abstract Introduction
Conclusions References
Tables Figures
◭ ◮
◭ ◮
Back Close
Full Screen / Esc
Printer-friendly Version Interactive Discussion
Discussion
P
a
per
|
Dis
cussion
P
a
per
|
Discussion
P
a
per
|
Discussio
n
P
a
per
|
Førland, E. J. and Hanssen-Bauer, I.: Past and future climate variations in the Norwegian Arctic: overview and novel analyses, Polar Res., 22, 113–124, 2003.
Hagen, J. O. and Liestøl, O.: Long-term glacier mass balance investigations in Svalbard, 1950– 88, Ann. Glaciol., 14, 102–106, 1990.
Hagen, J. O., Liestøl, O., Roland, E., and Jørgensen, T.: Glacier atlas of Svalbard and Jan
5
Mayen, Norsk Polarinstitutt, Oslo, 141 pp., 1993.
Hagen, J. O., Kohler, J., Melvold, K., and Winther, J. G.: Glaciers in Svalbard: mass balance, runoffand freshwater flux, Polar Res., 22, 145–159, 2003a.
Hagen, J. O., Melvold, K., Pinglot, F., and Dowdeswell, J. A.: On the net mass balance of the glaicers and ice caps in Svalbard, Norwegian Arctic, Arct. Antarct. Alp. Res., 35, 264–270,
10
2003b.
Heintzenberg, J., and Leck, C.: Seasonal variation of the atmospheric aerosol near the top of the marine boundary layer over Spitsbergen related to the Arctic sulphur cycle, Tellus B, 46, 52–67, 1994.
James, T. D., Murray, T., Barrand, N. E., and Barr, S. L.: Extracting photogrammetric ground
15
control from lidar DEMs for change detection., Photogramm. Rec., 21, 310–326, 2006. Kaser, G., Cogley, J. G., Dyurgerov, M. B., Meier, M. F., and Ohmura, A.: Mass balance of
glaciers and ice caps: consensus estimates for 1961–2004, Geophys. Res. Lett., 33, L19501, doi:10.1029/2006GL027511, 2006.
Kohler, J., James, T. D., Murray, T., Nuth, C., Brandt, O., Barrand, N. E., Aas, H. F., and
20
Luckman, A. J.: Acceleration in thinning rate on western Svalbard glaciers, Geophys. Res. Lett., 34, L18502, doi:10.1029/2007GL030681, 2007.
Lefauconnier, B., Hagen, J. O., Ørbæk, J. B., Melvold, K., and Isaksson, E.: Glacier balance trends in the Kongsfjorden area, western Spitsbergen, Svalbard, in relation to climate, Polar Res., 18, 307–313, 1999.
25
Meier, M. F., Dyurgerov, M. B., Rick, U. K., O’Neel, S., Pfeffer, W. T., Anderson, R. S., Anderson, S. P., and Glazovsky, A. F.: Glaciers dominate Eustatic sea-level rise in the 21st century, Science, 317, 1064–1067, doi:10.1126/SCIENCE.1143906, 2007.
M ´emin, A., Rogister, Y., Hinderer, J., Omang, O. C., and Luck, B.: Secular gravity variation at Svalbard (Norway) from ground observations and GRACE satellite data, Geophys. J. Int.,
30
184, 1119–1130, doi:10.1111/j.1365-246X.2010.04922.x, 2011.
TCD
6, 1085–1115, 2012Widespread glacier thinning in Svalbard
T. D. James et al.
Title Page
Abstract Introduction
Conclusions References
Tables Figures
◭ ◮
◭ ◮
Back Close
Full Screen / Esc
Printer-friendly Version Interactive Discussion
Discussion
P
a
per
|
Dis
cussion
P
a
per
|
Discussion
P
a
per
|
Discussio
n
P
a
per
|
Moholdt, G., Nuth, C., Hagen, J. O., and Kohler, J.: Recent elevation changes of Svalbard glaciers derived from ICESat laser altimetry, Remote Sens. Environ., 114, 2756–2767, 2010. Nuth, C., Kohler, J., Aas, H. F., Brandt, O., and Hagen, J. O.: Glacier geometry and elevation
changes on Svalbard (1936–90): a baseline dataset, Ann. Glaciol., 46, 106–116, 2007. Nuth, C., Moholdt, G., Kohler, J., Hagen, J. O., and K ¨a ¨ab, A.: Svalbard glacier
eleva-5
tion changes and contribution to sea level rise, J. Geophys. Res.-Earth, 115, F01008, doi:10.1029/2008JF001223, 2010.
Omang, O. C. and Kierulf, H. P.: Past and present-day ice mass variation on Svalbard revealed by superconducting gravimeter and GPS measurements, Geophys. Res. Lett., 38, L22304, doi:10.1029/2011GL049266, 2011.
10
Paterson, W. S. B.: The Physics of Glaciers, 3rd. ed., Pergamon, New York, 481 pp., 1994. Rolstad, C., Haug, T., and Demby, B.: Spatially integrated geodetic glacier mass balance and
its uncertainty based on geostatistical analysis: application to the western Svartisen ice cap, Norway, J. Glaciol., 55, 666–680, 2009.
Serreze, M. C., Maslanik, J. A., Scambos, T. A., Fetterer, F., Stroeve, J., Knowles, K., Fowler,
15
C., Drobot, S., Barry, R. G., and Haran, T. M.: A record minimum Arctic sea ice extent and area in 2002, Geophys. Res. Lett., 30, 1110, doi:10.1029/2002GL016406, 2002.
Shindell, D. and Faluvegi, G.: Climate response to regional radiative forcing during the twentieth century, Nat. Geosci., 2, 294–300, doi:10.1038/NGEO473, 2009.
Lemke, P., Ren, J., Alley, R. B., Allison, I., Carrasco, J., Flato, G., Fujii, Y., Kaser, G., Mote,
20
P., Thomas, R. H., and Zhang, T.: Observations: Changes in Snow, Ice and Frozen Ground, in: Climate Change 2007: The Physical Science Basis, Contribution of Working Group I to the Fourth Assessment Report of the Intergovernmental Panel on Climate Change, edited by: Solomon, S., Qin, D., Manning, M., Chen, Z., Marquis, M., Averyt, K. B., Tignor, M., and Miller, H. L., Cambridge University Press, Cambridge, United Kingdom and New York, NY,
25
USA, 2007.
Tedesco, M., Fettweis, X., van den Broeke, M. R., Van de Wal, R. S. W., Smeets, C. J. P. P., van de Berg, W. J., Serreze, M. C., and Box, J. E.: The role of albedo and accumulation in the 2010 melting record in Greenland, Environ. Res. Lett., 6, 014005, doi:10.1088/1748-9326/6/1/014005, 2011.
30
TCD
6, 1085–1115, 2012Widespread glacier thinning in Svalbard
T. D. James et al.
Title Page
Abstract Introduction
Conclusions References
Tables Figures
◭ ◮
◭ ◮
Back Close
Full Screen / Esc
Printer-friendly Version Interactive Discussion
Discussion
P
a
per
|
Dis
cussion
P
a
per
|
Discussion
P
a
per
|
Discussio
n
P
a
per
|
Wolf, P. R. and Dewitt, B. A.: Elements of Photogrammetry, with Applications in GIS, 3 ed., McGraw-Hill, New York, 608 pp., 2000.
TCD
6, 1085–1115, 2012Widespread glacier thinning in Svalbard
T. D. James et al.
Title Page
Abstract Introduction
Conclusions References
Tables Figures
◭ ◮
◭ ◮
Back Close
Full Screen / Esc
Printer-friendly Version Interactive Discussion
Discussion
P
a
per
|
Dis
cussion
P
a
per
|
Discussion
P
a
per
|
Discussio
n
P
a
per
|
Table 1.Acquisition details of airborne laser altimetry (lidar) and photographic surveys.
Lidar Photography
Elevation Range Acquisition # of Points Acquisition Scale (m a.s.l.) Date (x 106) Date
Austre Brøggerbreen (AB) 90–650 06-07-2005 31.8 28-07-1966 1:50 000 05-08-1977 1:50 000 20, 25-08-1990 1:50 000 Albrechtbreen (AL)a 50–300 14-08-2005 42.0 08-1971b 1:30 000 22, 27-07-1990 1:50 000 Grønfjordbreen (GB) 35–700 07-07-2005 54.4 19-08-1969 1:50 000 02-07-1990 1:50 000 Gullfaksebreen (GF)a 65–890 09-07-2005 98.7 07, 09-07-1961c 1:45 000 30-07-1966 1:50 000 22, 28-07-1990 1:50 000 Midtre Lov ´enbreen (ML) 75–650 09-08-2003 23.5 28-07-1966 1:50 000
05-07-2005 05-08-1977 1:50 000
20, 25-08-1990 1:50 000 Slakbreen (SB) 180–1000 08-08-2003 46.3 23-25-08-1961 1:40 000 16-08-1977 1:20 000 22-07-1990 1:50 000 a
Photographic and lidar coverage do not cover the whole catchment area of these glaciers whose highest elevations include featureless ice sheet which is unsuitable for photogrammetry.
b
Exact acquisition date unknown. c
TCD
6, 1085–1115, 2012Widespread glacier thinning in Svalbard
T. D. James et al.
Title Page
Abstract Introduction
Conclusions References
Tables Figures
◭ ◮
◭ ◮
Back Close
Full Screen / Esc
Printer-friendly Version Interactive Discussion
Discussion
P
a
per
|
Dis
cussion
P
a
per
|
Discussion
P
a
per
|
Discussio
n
P
a
per
|
Table 2.Site terminus position relative to earliest epoch along dotted lines shown in Fig. 2.
Terminus Retreat (m a−1 )
Data Coverage Whole Period Pre-1990 Post-1990
AB 1966–2005 22 25 35
AL 1971–2005 42 33 64
GB 1969–2005 30 38 29
GF 1966–2005 12 11 19
ML 1966–2005 12 13 10
TCD
6, 1085–1115, 2012Widespread glacier thinning in Svalbard
T. D. James et al.
Title Page
Abstract Introduction
Conclusions References
Tables Figures
◭ ◮
◭ ◮
Back Close
Full Screen / Esc
Printer-friendly Version Interactive Discussion
Discussion
P
a
per
|
Dis
cussion
P
a
per
|
Discussion
P
a
per
|
Discussio
n
P
a
per
|
Table 3. Glacier elevation and volume change statistics derived from full-coverage DEM differencing over the full period of data coverage.
Site Study Period A(km2) ∆hmax(m) ∆h(m)
.
∆h(ma−1
) ∆V (x105m3)
.
TCD
6, 1085–1115, 2012Widespread glacier thinning in Svalbard
T. D. James et al.
Title Page
Abstract Introduction
Conclusions References
Tables Figures
◭ ◮
◭ ◮
Back Close
Full Screen / Esc
Printer-friendly Version Interactive Discussion
Discussion
P
a
per
|
Dis
cussion
P
a
per
|
Discussion
P
a
per
|
Discussio
n
P
a
per
|
Table 4. Mean annual elevation change rates ( .
∆h) for pre-1990, post-1990 and whole period
of data coverage.
.
∆h(ma−1 )
Whole Period Pre-1990 Post-1990 AB 1966–2005 −0.64±0.03 −0.62±0.09 −0.74±0.10 AL 1971–2005 −1.00±0.03 −0.95±0.11 −1.21±0.10 GB 1969–2005 −0.87±0.03 −0.74±0.10 −1.17±0.10 GF 1966–2005 −0.25±0.03 −0.23±0.09 −0.28±0.10 ML 1966–2005 −0.44±0.03 −0.38±0.09 −0.58±0.10
TCD
6, 1085–1115, 2012Widespread glacier thinning in Svalbard
T. D. James et al.
Title Page
Abstract Introduction
Conclusions References
Tables Figures
◭ ◮
◭ ◮
Back Close
Full Screen / Esc
Printer-friendly Version Interactive Discussion
Discussion
P
a
per
|
Dis
cussion
P
a
per
|
Discussion
P
a
per
|
Discussio
n
P
a
per
|
Fig. 1. Sites included in the study are Austre Brøggerbreen (AB); Albrechtbreen (AL); Grønfjordbreen (GB); Gullfaksebreen (GF); Midtre Lov ´enbreen (ML); and Slakbreen (SB). GPS base station locations are shown by red circles. Meteorological data were collected at Longyearbyen (L). The station at Longyearbyen was relocated∼6 km from the town site to its
TCD
6, 1085–1115, 2012Widespread glacier thinning in Svalbard
T. D. James et al.
Title Page
Abstract Introduction
Conclusions References
Tables Figures
◭ ◮
◭ ◮
Back Close
Full Screen / Esc
Printer-friendly Version Interactive Discussion
Discussion
P
a
per
|
Dis
cussion
P
a
per
|
Discussion
P
a
per
|
Discussio
n
P
a
per
|
(a) (b)
(c)
TCD
6, 1085–1115, 2012Widespread glacier thinning in Svalbard
T. D. James et al.
Title Page
Abstract Introduction
Conclusions References
Tables Figures
◭ ◮
◭ ◮
Back Close
Full Screen / Esc
Printer-friendly Version Interactive Discussion
Discussion
P
a
per
|
Dis
cussion
P
a
per
|
Discussion
P
a
per
|
Discussio
n
P
a
per
|
(d) (e) (f)
TCD
6, 1085–1115, 2012Widespread glacier thinning in Svalbard
T. D. James et al.
Title Page
Abstract Introduction
Conclusions References
Tables Figures
◭ ◮
◭ ◮
Back Close
Full Screen / Esc
Printer-friendly Version Interactive Discussion
Discussion
P
a
per
|
Dis
cussion
P
a
per
|
Discussion
P
a
per
|
Discussio
n
P
a
per
|
Fig. 3.Average annual elevation change ( .
TCD
6, 1085–1115, 2012Widespread glacier thinning in Svalbard
T. D. James et al.
Title Page
Abstract Introduction
Conclusions References
Tables Figures
◭ ◮
◭ ◮
Back Close
Full Screen / Esc
Printer-friendly Version Interactive Discussion
Discussion
P
a
per
|
Dis
cussion
P
a
per
|
Discussion
P
a
per
|
Discussio
n
P
a
per
|
Fig. 6.JJA Temperature data from the Longyearbyen station (L, Fig. 1). Trend for whole period (black dotted line) is 0.02◦C a−1
TCD
6, 1085–1115, 2012Widespread glacier thinning in Svalbard
T. D. James et al.
Title Page
Abstract Introduction
Conclusions References
Tables Figures
◭ ◮
◭ ◮
Back Close
Full Screen / Esc
Printer-friendly Version Interactive Discussion
Discussion
P
a
per
|
Dis
cussion
P
a
per
|
Discussion
P
a
per
|
Discussio
n
P
a
per
|