772
CUSTOMER SATISFACTION
REGARDING BANK’S DIS
TRIBUTION CHANNELS
–
THE ATM NETWORK
Radomir Lacramioara
Babes-Bolyai University, Cluj-Napoca
Faculty of Economics and Business Administration
Maniu Andreea Ioana
Babes-Bolyai University, Cluj-Napoca
Faculty of Economics and Business Administration
Scridon Mircea Andrei
Babes-Bolyai University, Cluj-Napoca
Faculty of Economics and Business Administration
Zaharie Monica Maria
Babes-Bolyai University, Cluj-Napoca
Faculty of Economics and Business Administration
In addition to traditional distribution methods (network of territorial units), to better meet market requirements in terms of speed and efficiency of services, banks have developed interactive electronic and computerized systems for clients: banking services via telephone, internet banking, network of automatic teller machines (ATMs), Electronic Funds Transfer at point of sale (EFTPOS). Automatic Teller Machines have become in recent years one of the common instruments through which banks offer the possibility of conducting routine operations such as: cash withdrawals, bill payments, transfer between accounts. This article presents the results obtained following a research that focused on determining the customers’ degree of satisfaction with the distribution channels used by a Top Five Romanian Bank, in particular the ATMs distribution network.
Keywords: distribution channel, Automatic Teller Machines, satisfaction degree, bank
JEL Classification: M31, G29
Introduction
The distribution of banking services can be understood as the place and means by which the bank services are offered to customers.
In general, banks try to create a diversified distribution strategy in order to market their services range, offering customers several ways through which they can benefit from the bank services (a firm applies a diversified distribution strategy when making their products or services available through two or more distribution channels).The three main factors that led to the use of multiple distribution channels by banks are: major changes in the banking sector by growing competition and increasing pressure from competitors, changing customers preferences and the third factor, the difficulties encountered by banks in the attempt of differentiation by offer. As a result, the banks have then resorted to compete on price and now the emphasis is on differentiation by distribution channels used.
Distribution channels used by banks can be divided into two main groups: in the first category are included those channels which typically involves “personal contact with the consumer” - territorial units, and in the second category are included those "channels which may either interact directly with the consumer, by non-personal means, or operate through various intermediaries"524. Thus, in addition
524
773
to traditional distribution methods (network of territorial units), to better meet market requirements in terms of speed and efficiency of services, banks have developed interactive electronic and computerized systems for clients: banking services via telephone, internet, network of automatic teller machines (ATMs), Electronic Funds Transfer at point of sale (EFTPOS).
Research objectives
The main objective of the research was to determine the contentment / satisfaction degree of respondents with distribution channels used by a top five Romanian Bank.
To achieve this, it was necessary to determine the most important factors that customers take into consideration in assessing the various distribution channels and determining how these factors are valued for channels of the analyzed bank525.
The secondary objectives derived from the main objective have been structured as follows: -identifying and measuring the satisfaction degree with the bank’s territorial units;
-identifying and measuring service satisfaction with the Bank’s Call Center services;
-identifying and measuring service satisfaction with the banks internet banking services; -identifying and measuring satisfaction degree with the banks ATMs network.
In this article, only the results from the analysis of the forth secondary objective are presented, because
these are the most relevant for the article’s topic.
Methodology
Data collection was carried out using punctual survey and the research instrument was the questionnaire.
Given the objectives of this study, the surveyed population was composed of banks’ customers
(customer = person who has at least one account with the considered bank), aged at least 18. The research was carried out during June-July of 2009, thus resulting in a sample composed of 515 persons, the margin of error being ± 5.2%, for a 0.95 probability.
Research results
Automatic Teller Machines have become in recent years one of the common instruments through which banks offer the possibility of conducting routine operations526 (cash withdrawals, bill payments, transfer between accounts) which before the introduction of ATMs were carried out over the counter, with the help of bank staff.
The questions regarding this distribution channel were constructed so as to identify the main operations
carried out by the bank’s customers at ATMs and also the frequency with which they are conducted.
Another aim was also to establish those factors that customers consider most important in assessing a distribution channel. A third goal was to identify how the bank’s ATMs are perceived by its customers, to determine the satisfaction of respondents with the bank’s ATMs and, not least, identifying the main
reasons behind reduced customer satisfaction (if present)527.
The results presented in table 1 show that operations with the highest frequency conducted by most respondents are: cash withdrawal and card balance query.
525
Wendy W.N. Wan, Chung-Leung Luk, Cheris W.C. Chow (2005), „Customers’ adoption of banking channels in Hong Kong”, International Journal of Bank Marketing, Vol. 23, No. 3, pp. 255-272
526
Luis M. Huete, Aleda V. Roth, (1988), „The Industrialisation and Span of Retail Banks' Delivery Systems”, International Journal of Operations & Production Management, Vol. 8, No. 3, pp.46-66
527
774
Table 1. Services structure according to the frequency of their request
Frequency of the service use
Once a week or more often
Once every two weeks
Once a month
Once every 2-3 months
Less
often Total
Bill payments to utilities providers
Frequencies 14 29 65 10 15 133
% of the persons requesting this
service
10,5% 21,8% 48,9% 7,5% 11,3% 100,0%
Cash withdrawal
Frequencies 242 157 80 14 19 512
% of the persons requesting this
service
47,3% 30,7% 15,6% 2,7% 3,7% 100,0%
Card balance query
Frequencies 116 126 80 18 69 409
% of the persons requesting this
service
28,4% 30,8% 19,6% 4,4% 16,9% 100,0%
Changing the PIN Code
Frequencies 2 1 2 1 79 85
% of the persons requesting this
service
2,4% 1,2% 2,4% 1,2% 92,9% 100,0%
The higher percentages of customers who carry out these operations can be explained by the original purpose of this alternative distribution channel - cash withdrawal outside the bank's working hours. Another explanation is the low rate of POS payments (compared with the large number of people who withdraw cash from ATMs), and when such payments are made, the customer often wants to ensure for the accuracy of operation. This comes as a surprise because in general it is expected that these two percentages (99.42% for cash withdrawal and 79.42% for card balance query) are closer, considering that usually when cash withdrawal is performed, the customer also requests a receipt to be issued for the account balance. A possible explanation would be that the bank introduced since 2009 a fee for each card balance query. This prompted customers either to reduce the frequency of such operations, or to abandon the balance quarrying through this distribution channel in favor of internet banking (this channel does not charge any fee for checking the account balance).
Changing the PIN code at ATM is carried out less often than every 2-3 months by the majority (92.9%) of respondents. However, there are also customers who choose to change the PIN code more often, this being considered a protection measure against possible frauds.
The second aim is to investigate factors considered important by customers in assessing this distribution channel.
775 reduced using principal components analysis528.
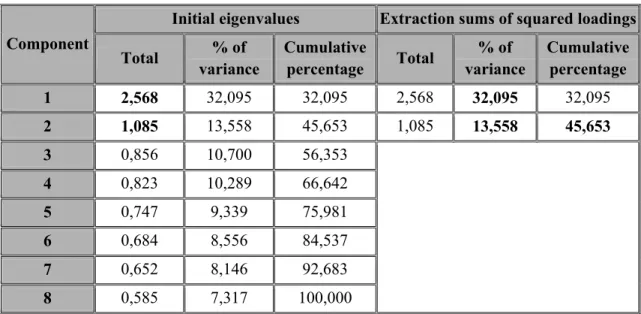
Applying this method has led to the formation of two components. The first one explains almost one third of the total variance, 32.095% and the second component 13.558%.
Table 2. The total variance explained using principal component analysis
Component
Initial eigenvalues Extraction sums of squared loadings
Total % of variance
Cumulative
percentage Total
% of variance
Cumulative percentage
1 2,568 32,095 32,095 2,568 32,095 32,095
2 1,085 13,558 45,653 1,085 13,558 45,653
3 0,856 10,700 56,353
4 0,823 10,289 66,642
5 0,747 9,339 75,981
6 0,684 8,556 84,537
7 0,652 8,146 92,683
8 0,585 7,317 100,000
The first component is a linear combination of 5 factors that customers consider important when assessing alternative distribution channel: The variety of transactions, a factor which has the highest loading - 0.647, Operations rapidity, the factor with the second highest loading - 0.635, Ease of use, Clarity of instructions and The ATM network.529
The second component is a linear combination of 3 factors considered to be important in assessing ATMs: Costs of services, loading - 0.599, Service security, loading - 0.564 and Information provided related to promotional campaigns, a factor with a smaller loading than the first two.
The first component is called ATM, because it contains factors that relate to the functional characteristics of this channel (technical features such as software that allows for quick and easy operations and logistical features – ATMs network).
The second component is called Bank because it contains factors that refer to the financial institution: costs of services or information, displayed on ATMs screens, about its offer.
Grouping eight factors into two components is very useful when the bank seeks to encourage the use of this distribution channel. The percentages of variance explained by each component indicates the issues on which the bank must primarily intervene and aspects through which the ATM distribution channels
is evaluated by most respondents. In this case, the customers’ emphasis more the ATM component,
which means that the bank should try to focus mainly on messages relating to the factors included in this component.
After grouping the considered factors for the overall assessment of the distribution channel, an
evaluation of the bank’s ATMs was performed. Thus, respondents were asked to agree or disagree, on a
528
Mathew Joseph, George Stone, (2003), „An empirical evaluation of US bank customer perceptions of the impact of tehnology on service delivery in the banking sector”, International Journal of Retail & Distribution Management, Vol.31, No. 4, pp. 190-202
529
776
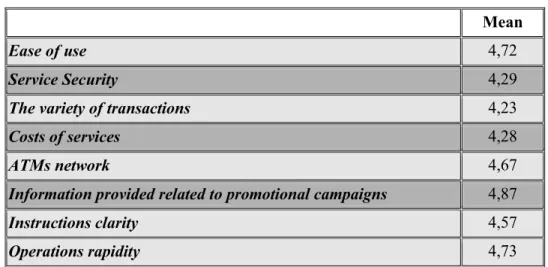
5-step scale where: 1 - totally disagree and 5 – totally agree, on statements about the bank’s ATMs.
Means are presented in table 3.
Table 3. Means obtained for statements relating to the bank’s ATMs
Mean
Ease of use 4,72
Service Security 4,29
The variety of transactions 4,23
Costs of services 4,28
ATMs network 4,67
Information provided related to promotional campaigns 4,87
Instructions clarity 4,57
Operations rapidity 4,73
ATM Component - the lowest score was obtained for the statement: Variety of transactions. Thus, it is recommended that the bank should introduce new services for customers available through this channel. Bank Component - the lowest means were obtained for Cost of services and Service Security. The low score for cost of services shows that some of the bank’s customers consider the costs for operations
performed through this distribution channel as being high. This perception requires further investigation because no additional costs are present other than the fee introduced since 2009.
Knowing what factors customers consider important when assessing a bank’s ATMs and how the analyzed bank’s ATMs are appreciated, it is also important to determine the customers satisfaction with this distribution channel (Customer were asked to express their level of satisfaction on a 5 points scale –
1=very dissatisfied and 5= very satisfied).Therefore the following hypothesis is formulated: H1: Customer satisfaction with the bank’s ATMs is rather high.
Table 4.One-Sample T test results
Based on the results of the One Sample T Test (Sig. (2-tailed) = 0.000 <0.05) the null hypothesis is rejected. In other words, the level of satisfaction is higher than the test value 4 (rather high). Indeed, the sample mean is 4.57, higher than the tested value.
Conclusion
To better meet customer expectations, it is essential that banks take into account both their expectations about the channel distribution mix (the channel mix should be established by customer requirements) and customer perception of the distribution channels. This will likely lead to an increase in sales and also to a more flexible offer matching different customer requirements.
T Test
Test value = 4
t df Sig. (2-tailed) Mean difference Mean Std. error mean 4,57 0,024
777 Limitations and suggestions for future study
This research was carried out only in one city and therefore the sample might not be representative. It is recommended to extend this study in other areas of Romania, especially in the rural areas, where the population characteristics are different from those in the urban areas.
Future study is recommended in order to compare the results obtained periodically for a better
understanding of consumer perceptions towards the bank’s ATM network.
References
1. Kevin Curran, David King, (2008), „Investigating the human computer interaction problems with
automated teller machine navigation menus”, Interactive Technology and Smart Education, Vol. 5, No.
1, pp. 59-79.
2. Luis M. Huete, Aleda V. Roth, (1988), „The Industrialisation and Span of Retail Banks' Delivery
Systems”, International Journal of Operations & Production Management, Vol. 8, No. 3, pp.46-66.
3. Mathew Joseph, George Stone, (2003), „An empirical evaluation of US bank customer perceptions of the impact of tehnology on service delivery in the banking sector”, International Journal of Retail &
Distribution Management, Vol.31, No. 4, pp. 190-202.
4. Peter J. McGoldrick, Steven J. Greenland (1992), “Competition Between Banks and Building Societies in the Retailing of Financial Services”, British Journal of Management, Vol. 3, No. 3, pp. 169 – 179.
5. Robert Rugimbana, Philip Iversen (1994), „Perceived Attributes of ATMs and Their Marketing Implications”, International Journal of Bank Marketing, Vol. 12, No. 2, pp. 30-35.