HESSD
8, 1799–1825, 2011Dissolved inorganic carbon export from
carbonate and silicate
W. J. Shin et al.
Title Page
Abstract Introduction
Conclusions References
Tables Figures
◭ ◮
◭ ◮
Back Close
Full Screen / Esc
Printer-friendly Version Interactive Discussion
Discussion
P
a
per
|
Dis
cussion
P
a
per
|
Discussion
P
a
per
|
Discussio
n
P
a
per
|
Hydrol. Earth Syst. Sci. Discuss., 8, 1799–1825, 2011 www.hydrol-earth-syst-sci-discuss.net/8/1799/2011/ doi:10.5194/hessd-8-1799-2011
© Author(s) 2011. CC Attribution 3.0 License.
Hydrology and Earth System Sciences Discussions
This discussion paper is/has been under review for the journal Hydrology and Earth System Sciences (HESS). Please refer to the corresponding final paper in HESS if available.
Dissolved inorganic carbon export from
carbonate and silicate catchments
estimated from carbonate chemistry and
δ
δ
δ
13
C
DIC
W. J. Shin1,2, G. S. Chung1, D. Lee3, and K. S. Lee2,4
1
Department of Geology and Earth Environmental Sciences, Chungnam National University, Daejeon 305-764, Republic of Korea
2
Division of Earth and Environmental Science, Korea Basic Science Institute, Daejeon 305-333, Republic of Korea
3
Korea Research Institute of Standards and Science, Daejeon 305-340, Republic of Korea
4
HESSD
8, 1799–1825, 2011Dissolved inorganic carbon export from
carbonate and silicate
W. J. Shin et al.
Title Page
Abstract Introduction
Conclusions References
Tables Figures
◭ ◮
◭ ◮
Back Close
Full Screen / Esc
Printer-friendly Version Interactive Discussion
Discussion
P
a
per
|
Dis
cussion
P
a
per
|
Discussion
P
a
per
|
Discussio
n
P
a
per
|
Received: 31 December 2010 – Accepted: 17 January 2011 – Published: 9 February 2011 Correspondence to: K.-S. Lee ([email protected])
HESSD
8, 1799–1825, 2011Dissolved inorganic carbon export from
carbonate and silicate
W. J. Shin et al.
Title Page
Abstract Introduction
Conclusions References
Tables Figures
◭ ◮
◭ ◮
Back Close
Full Screen / Esc
Printer-friendly Version Interactive Discussion
Discussion
P
a
per
|
Dis
cussion
P
a
per
|
Discussion
P
a
per
|
Discussio
n
P
a
per
|
Abstract
We investigated dissolved inorganic carbon (DIC) exchange associated with ground-water discharge and stream flow from two upstream catchments with distinct
base-ment lithology (silicate vs. carbonate). The effects of catchment lithology were
ev-ident in the spring waters showing lower δ13CDIC and alkalinity (−16.2±2.7‰ and
5
0.09±0.03 meq L−1, respectively) in the silicate and higher values (−9.7±1.5‰ and
2.0±0.2 meq L−1) in the carbonate catchment. The streams exhibited relatively high
δ13CDIC values,−6.9±1.6‰ and−7.8±1.5‰, in silicate and carbonate catchments,
respectively, indicating CO2degassing during groundwater discharge and stream flow.
The catchment lithology affected the pattern of DIC export. The CO2 degassing from
10
stream and groundwater could be responsible for 8–55% of the total DIC export in the silicate catchment, whereas the proportion is comparatively low (0.4–5.6%) in the carbonate catchment. We emphasize the importance of dynamic carbon exchange occurring at headwater regions and its variability with catchment lithology for a more reliable carbon budget in river systems.
15
1 Introduction
The current increase of atmospheric carbon dioxide, a greenhouse gas, and associated climate changes necessitate a more in-depth understanding of the global carbon cycle (Friedlingstein et al., 2003; Govindasamy et al., 2005). Rivers play an important role in global carbon cycling by transporting carbon from terrestrial to marine realms. The
20
global flux of carbon transported by rivers in the form of dissolved inorganic carbon
(DIC) is estimated to be 0.43×10¹⁵g C yr−1, representing about 40% of the total global
carbon flux (Meybeck, 1987). Moreover, the evasion of CO2 from rivers during DIC
transport is an important component of the atmospheric CO2 budget (Richey et al.,
2002). Thus, considerable effort has been directed toward quantifying both vertical
25
HESSD
8, 1799–1825, 2011Dissolved inorganic carbon export from
carbonate and silicate
W. J. Shin et al.
Title Page
Abstract Introduction
Conclusions References
Tables Figures
◭ ◮
◭ ◮
Back Close
Full Screen / Esc
Printer-friendly Version Interactive Discussion
Discussion
P
a
per
|
Dis
cussion
P
a
per
|
Discussion
P
a
per
|
Discussio
n
P
a
per
|
In upstream regions (e.g., headwater catchments) where the stream flow is mainly due to groundwater discharge, groundwater acts as a conduit of subsurface DIC trans-port across the interface between terrestrial (e.g., soils) and aquatic reservoirs (e.g., streams). The onset of carbon exchange at the headwater regions is characterized
by enhanced CO2evasion due to strong CO2over-saturation of the groundwater.
Be-5
cause the effect of groundwater DIC is transient and is only observed near the
im-mediate source at the first order stream, carbon exchange at this interface has been
largely unexplored (Johnson et al., 2008; ¨Oquist et al., 2009). Therefore, a more
quan-titative understanding of carbon exchange in headwater systems is essential to derive a reliable carbon budget of river systems.
10
An isotope tracer,δ13CDIC, is especially useful because it reveals reaction pathways
and transport processes that may otherwise be difficult to discern with normative
car-bonate systems (Tan and Edmond, 1993; Taylor and Fox, 1996; Yang et al., 1996).
The DIC in river water originates from several sources, including influx of soil CO2via
groundwater, CO2exchange with the atmosphere, in-river respiration, and dissolution
15
of carbonate rocks. About 67% of the DIC in the world’s rivers is known to originate
from soil CO2(Meybeck, 1987; Ludwig et al., 1997). Based on stoichiometric
consider-ations, the proportion of soil CO2in rivers ranges from∼50% in carbonate catchments
(another 50% is from the carbonate minerals) to ∼100% in silicate catchments. In
upstream regions where groundwater contributes largely to stream flow, the input of
20
groundwater containing DIC from soil CO2lowers the
13
C/12C ratio of DIC in river
wa-ter because soil CO2 is largely derived from the microbial degradation of soil organic
matter (Amiotte-Suchet et al., 1999; Finlay, 2003). In contrast, atmospheric exchange
and dissolution of carbonate minerals increase the13C/12C ratio of DIC because these
sources are enriched in 13C relative to12C (Amiotte-Suchet et al., 1999). In addition
25
to the strong over-saturation with CO2 in groundwater components, stream water in
upstream regions may also be more turbulent, causing rapid degassing of CO2into the
HESSD
8, 1799–1825, 2011Dissolved inorganic carbon export from
carbonate and silicate
W. J. Shin et al.
Title Page
Abstract Introduction
Conclusions References
Tables Figures
◭ ◮
◭ ◮
Back Close
Full Screen / Esc
Printer-friendly Version Interactive Discussion
Discussion
P
a
per
|
Dis
cussion
P
a
per
|
Discussion
P
a
per
|
Discussio
n
P
a
per
|
The uppermost tributaries of the South Han River (SHR), South Korea, provide an
ideal hydro-geological setting to investigate factors controllingδ13CDICand carbonate
chemistry because they drain catchments with contrasting bedrock lithologies: silicate vs. carbonate. Moreover, their drainage system that consists of the first to fifth order streams provides an adequate condition for studies on carbon exchanges from the
5
headwater regions to the main channels. In this study, we measured the stable car-bon isotopic composition of DIC and carcar-bonate chemistry from springs and streams draining upstream catchments with silicate and carbonate basements. The objectives
were to (1) determine factors controlling carbonate chemistry andδ13CDIC in
catch-ments with different lithologies and (2) quantify lateral and vertical transport of DIC at
10
upstream catchments and their possible variation with the catchment lithology.
2 Materials and methods
2.1 Description of the study sites
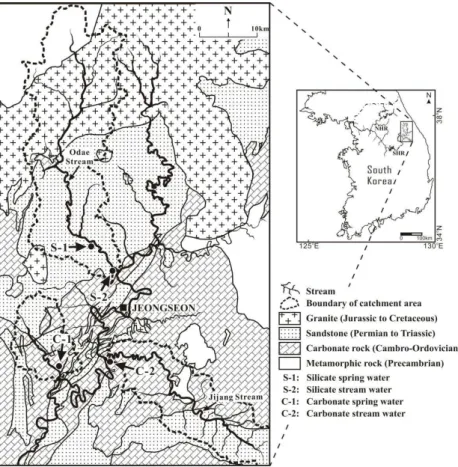
The study sites were two upstream tributaries of the SHR in the middle part of the Korean peninsula (Fig. 1). Both catchments are located at the headwater regions of the
15
SHR basin. The Odae drains a basin (452 km2) dominated exclusively by silicate rocks,
consisting of Precambrian metamorphic crystalline rock, Permian to Triassic sandstone and shale, and Jurassic to Cretaceous granite. In contrast, the Jijang drains a basin
(225 km2) dominated by Cambro-Ordovician carbonate rock with some sandstone at
its upper reach. The elevation of the study sites ranges from 340 to 1560 m for the
20
Odae and from 260 to 1570 m for the Jijang catchment.
The vegetation in the study area consisted largely of C3 plants (mixed deciduous
broadleaf and conifer forests) with seasonally cultivated C4 (e.g., corn) crops.
Ta-ble 1 presents information on the two streams (Water Management Information Sys-tem: www.wamis.go.kr).
HESSD
8, 1799–1825, 2011Dissolved inorganic carbon export from
carbonate and silicate
W. J. Shin et al.
Title Page
Abstract Introduction
Conclusions References
Tables Figures
◭ ◮
◭ ◮
Back Close
Full Screen / Esc
Printer-friendly Version Interactive Discussion
Discussion
P
a
per
|
Dis
cussion
P
a
per
|
Discussion
P
a
per
|
Discussio
n
P
a
per
|
2.2 Sampling and analytical procedures
Water sampling and in-situ measurements of geochemical parameters were conducted at four locations on a biweekly basis for 18 months (July 2004 to December 2005). Water was collected from the two perennial springs and the outlet of the main channel (fifth-order stream) in both catchments. In the silicate catchment (Odae), we chose
5
a perennial spring located at the bottom of a sandstone clifffrom which water was
dis-charging at∼37 m3day−1. In the carbonate catchment (Jijang), we also chose a
peren-nial spring flowing from the base of a carbonate cliff. Although sampling began in July
2004, this study focused on the data from 2005 because a more complete dataset was available in terms of measured parameters and seasonal coverage.
10
Temperature, pH, dissolved oxygen (DO), and electrical conductivity (EC) were mea-sured on site during water sampling using a YK-2001PH portable meter. Alkalinity was measured by titration with 0.05N HCl according to the Gran method (Rounds and Wilde, 2001). To fully characterize the carbonate system, ion activities were
evalu-ated by PHREEQC (Parkhurst and Appelo, 1999). The partial pressure of CO2(pCO2)
15
was calculated by the speciation outputs from PHREEQC. The temperature-dependent
equilibrium constants for the three species (H2CO3, HCO−3, and CO
2−
3 ) of the DIC
sum-marized by Langmuir (1997) were used to calculate the activities of the three species.
Forδ13CDICanalysis, water samples were collected using two evacuated glass
bot-tles (150 mL) pre-loaded with 85% phosphoric acid and a magnetic stir bar, as reported
20
by Atekwana and Krishnamurthy (1998). Water sampling was carried out in the field using a syringe with a 0.45-µm Millipore membrane filter. Samples were stored in a
re-frigerator prior to analysis. The DIC in water samples was converted into CO2 gas by
a gas-evolution technique (Atekwana and Krishnamuthy, 1998). The CO2gas was then
extracted and cryogenically purified. Next, theδ13C values of the evolved CO2 were
25
measured using an Optima isotope-ratio mass spectrometer (GV Instruments, UK) at
Chungnam National University. Carbon isotopic ratios are reported using standardδ
HESSD
8, 1799–1825, 2011Dissolved inorganic carbon export from
carbonate and silicate
W. J. Shin et al.
Title Page
Abstract Introduction
Conclusions References
Tables Figures
◭ ◮
◭ ◮
Back Close
Full Screen / Esc
Printer-friendly Version Interactive Discussion
Discussion
P
a
per
|
Dis
cussion
P
a
per
|
Discussion
P
a
per
|
Discussio
n
P
a
per
|
standard, i.e.,δ(‰)=(Rsample/Rstandard−1)×1000, whereR represents
13
C/12C. The
analytical reproducibility was±0.2‰.
3 Results
3.1 Spring waters
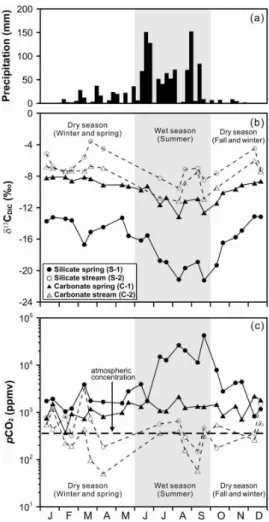
Figure 2 shows the precipitation, δ13CDIC values, and pCO2 of the four water types.
5
Ranges and averages of the measured parameters are shown in Table 2. The pH
val-ues in silicate and carbonate springs were between 5.1 and 6.9 (average of 6.1,n=23)
and between 7.7 and 8.5 (average of 8.0, n=23), respectively. Alkalinities were
be-tween 0.05 and 0.17 meq L−1 (average of 0.09 meq L−1) in the silicate spring and
be-tween 1.50 and 2.21 meq L−1 (average of 1.96 meq L−1) in the carbonate spring.
Fig-10
ure 2b shows seasonal variations inδ13CDICvalues of the spring waters. The silicate
spring hadδ13CDICvalues ranging from−21.2 to−13.1‰ (average of−16.2±2.7‰),
and the carbonate spring had values from−13.2 to−8.1‰ (average of−9.7±1.5‰).
ThepCO2showed contrasting values between silicate and carbonate waters (Fig. 2c).
The silicate spring waters hadpCO2values ranging from 827 to 42,546 ppmv (average
15
of 7520 ppmv), and the carbonate spring waters hadpCO2 values from 372 to 2196
ppmv (average of 1245 ppmv).
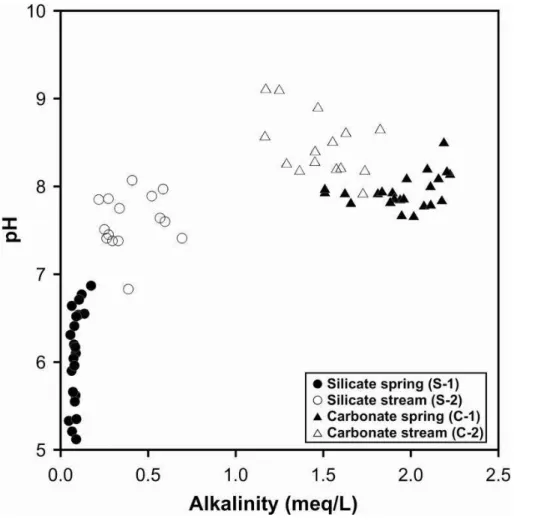
Theδ13CDIC, alkalinity, and pH were the major parameters used to distinguish water
derived from silicate and carbonate catchments. The two spring waters were distin-guished by a pH of 7, and the silicate spring had a wider range than the carbonate
20
HESSD
8, 1799–1825, 2011Dissolved inorganic carbon export from
carbonate and silicate
W. J. Shin et al.
Title Page
Abstract Introduction
Conclusions References
Tables Figures
◭ ◮
◭ ◮
Back Close
Full Screen / Esc
Printer-friendly Version Interactive Discussion
Discussion
P
a
per
|
Dis
cussion
P
a
per
|
Discussion
P
a
per
|
Discussio
n
P
a
per
|
3.2 Stream waters
The pH ranged from 6.8 to 8.1 (average of 7.6, n=15) in the silicate stream and
from 7.9 to 9.1 (average of 8.5, n=15) in the carbonate stream. EC (from 11 to
122 µS cm−1, average of 64, n=20) and alkalinity (from 0.22 to 0.74 meq L−1,
aver-age of 0.44, n=23) were lower in the silicate stream than in the carbonate stream,
5
where EC ranged from 222 to 433 µS cm−1 (average of 301, n=19), and alkalinity
ranged from 1.18 to 1.83 meq L−1(average of 1.46, n=23). As shown in Fig. 2b, the
silicate stream hadδ13CDICvalues from−10 to−3.6‰, with an average of−6.9±1.6‰
(n=23), whereas values from the carbonate stream ranged from−11.2 to−6.1‰, with
an average of−7.8±1.5‰ (n=23). ThepCO2was higher in the silicate stream,
rang-10
ing from 150 to 3380 ppmv (average of 720,n=15), than in the carbonate stream (50
to 1150 ppmv, average of 357). DO was mostly supersaturated with respect to
atmo-spheric O2, showing average DOsat of 1.21 and 1.22 in the streams in the silicate and
carbonate catchments, respectively.
Alkalinity was the parameter that differentiated stream waters (Fig. 3). Both stream
15
waters had higher pH than the respective spring water in each catchment. Compared with the respective spring water, alkalinity was higher in the silicate stream, but was lower in the carbonate stream.
4 Discussion
4.1 Sources of spring water DIC 20
The clear distinction in geochemical and carbon isotope characteristics between the two spring waters indicated that the springs may have retained pristine characteristics of the groundwater in each catchment. To examine this, we calculated expected carbon
isotopic composition of groundwater DIC originating exclusively from soil CO2(silicate
catchment) and from a 1:1 mixture of soil CO2 and carbonate minerals (carbonate
HESSD
8, 1799–1825, 2011Dissolved inorganic carbon export from
carbonate and silicate
W. J. Shin et al.
Title Page
Abstract Introduction
Conclusions References
Tables Figures
◭ ◮
◭ ◮
Back Close
Full Screen / Esc
Printer-friendly Version Interactive Discussion
Discussion
P
a
per
|
Dis
cussion
P
a
per
|
Discussion
P
a
per
|
Discussio
n
P
a
per
|
catchment) (Clark and Fritz, 1997). We assumed that soil organic matter was from C3
plants with a meanδ13C of−27‰ (O’Leary, 1988) and used the temperature
depen-dence of carbon isotope fractionation between CO2 and H2CO3/HCO−3 (Zhang et al.,
1995). The ratio between H2CO3 and HCO−
3 was calculated using K1/a
H+
, where K1
is the first dissociation constant of H2CO3, anda
H+
was calculated from the measured
5
pH. The expected average δ13CDIC in the silicate spring (with 35% HCO−3 and 65%
H2CO3 at the average pH of 6.1) derived from soil CO2 was−24.7‰, which was
sig-nificantly lower than the measured average value of−16.2±2.7‰. For the carbonate
spring, the expected δ13CDIC (over 99.9% HCO−3 at the average pH of 8.0) derived
from 1:1 mixture of soil CO2and carbonate minerals was −9.0‰, which was close to
10
the measured average value (−9.7±1.5‰).
The discrepancy between measured and expected δ13CDIC values may be related
to the presence of C4 plants (mostly corn) in the catchment area and/or degassing of
CO2during the residence of water in the soil and groundwater reservoirs. The effect of
C4 plant material cannot be quantitatively examined due to the lack of carbon isotope
15
data of soil organic matter. The second possibility can explain the greater discrepancy
observed in the silicate catchment. Because the proportion of dissolved CO2(H2CO3)
in the total DIC was large in the silicate spring due to relatively low pH, the effect of
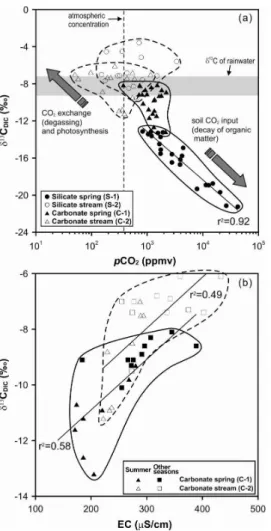
CO2 degassing was more significant. This interpretation is validated by the negative
correlation (r2=0.92) betweenpCO2 andδ
13
CDIC and by the fact that water samples
20
with higherpCO2showedδ
13
CDICvalues closer to those of expected groundwater DIC
(Fig. 4a). To verify the effect of CO2 degassing on δ13CDIC of the silicate spring, we
referred to the study by Doctor et al. (2007). They reported that the increase inδ13CDIC
per natural log-unit decrease of excesspCO2 was 2.4‰, where excess pCO2 is the
measuredpCO2 normalized to the expectedpCO2at atmospheric equilibrium. In our
25
study, the relationship was calculated as a 2.3±0.2‰ increase per unit decrease of
excess pCO2, indicating that the variability in silicate springδ13CDIC closely followed
HESSD
8, 1799–1825, 2011Dissolved inorganic carbon export from
carbonate and silicate
W. J. Shin et al.
Title Page
Abstract Introduction
Conclusions References
Tables Figures
◭ ◮
◭ ◮
Back Close
Full Screen / Esc
Printer-friendly Version Interactive Discussion
Discussion
P
a
per
|
Dis
cussion
P
a
per
|
Discussion
P
a
per
|
Discussio
n
P
a
per
|
water consisted primarily of HCO−3; therefore, the effect of CO2 degassing and
asso-ciated enrichment of13C was not as remarkable as were those effects in the silicate
spring. In summary, the spring waters may well represent the groundwater component
modified by the CO2degassing to a variable degree.
4.2 The evolution ofδδδ13CDICin stream waters 5
Because the spring waters likely represent the source groundwater composition, it is informative to compare spring and stream waters to understand processes occurring
along the hydrological pathways. Although the variability in δ13CDIC values between
stream and spring waters was generally correlated in each catchment (withr2=0.62
in the carbonate andr2=0.31 in the silicate catchment), the difference between
catch-10
ments was reduced (∼0.9‰ between streams compared to ∼6.5‰ between springs)
and DIC was more enriched in 13C in stream waters. The increase in δ13CDIC was
likely related to aquatic photosynthesis and CO2degassing.
To examine the relative importance of aquatic photosynthesis and CO2 degassing,
we plotted the difference inδ13CDICbetween the spring and stream waters (∆δ
13 CDIC)
15
against the dissolved O2 saturation (DOsat) in stream waters (Fig. 5a) and the diff
er-ence inpCO2between the spring and stream waters (∆pCO2) (Fig. 5b). Because the
stream waters were mostly over-saturated with O2relative to atmospheric equilibrium,
photosynthesis was assumed to be prevalent, and associated 13C enrichment was
expected. However, the correlation between∆δ13CDIC and DOsat was low (r
2
<0.1),
20
indicating that aquatic photosynthesis may not have been the major process for13C
en-richment. In addition, if photosynthesis resulted in13C enrichment, there would have
been a seasonal difference inδ13CDICbecause photosynthesis is more intense in
sum-mer than in winter. However, the magnitude of13C enrichment was similar regardless
of the season.
25
In contrast,∆δ13CDICexhibited a higher correlation (r
2
=0.52 and 0.43) with∆pCO2
HESSD
8, 1799–1825, 2011Dissolved inorganic carbon export from
carbonate and silicate
W. J. Shin et al.
Title Page
Abstract Introduction
Conclusions References
Tables Figures
◭ ◮
◭ ◮
Back Close
Full Screen / Esc
Printer-friendly Version Interactive Discussion
Discussion
P
a
per
|
Dis
cussion
P
a
per
|
Discussion
P
a
per
|
Discussio
n
P
a
per
|
13
C in stream water DIC is that it was caused mainly due to CO2degassing along the
pathways from the groundwater reservoirs to the stream. In the carbonate catchment,
∆δ13CDIC was comparatively small because of the minor proportion of dissolved CO2
(<0.1%) in the total DIC; thus, the effect of CO2degassing from the groundwater was
smaller than that in the silicate catchment. Moreover, due to the slight under-saturation
5
with CO2in the carbonate stream, CO2dissolution may also have occurred that led to
a different degree of13C enrichment compared to that expected from CO2degassing.
4.3 Seasonal variation inδδδ13CDICand carbonate chemistry
The spring and stream samples exhibited well-defined seasonal variations
character-ized by lowδ13CDICvalues during summer (June to September) and highδ13CDIC
val-10
ues during winter (November to February) (Fig. 2b). In addition,pCO2showed a
sea-sonal dependence, with higher values during June–October and lower values during November–March, especially in the silicate spring water (Fig. 2c). In the study area, the observed seasonality could have been due to (1) the seasonal change in metabolic activity related to changes in temperature and (2) changes in the water regime related
15
to precipitation patterns.
Because both stream waters were assumed to be dominantly photosynthetic, the
higher pCO2 during summer does not support in-situ production, but likely reflects
CO2transport from soils via groundwater discharge associated with the enhanced
mi-crobial and root respiration during the season (Barth and Veizer, 1999; Hamada and
20
Tanaka, 2001; Hope et al., 2004; Xie et al., 2005; Yao et al., 2007; Jin et al., 2008).
The addition of soil CO2via soil/groundwater resulted in lowδ13CDICvalues of the
wa-ter. A negative correlation betweenδ13CDIC and pCO2 in the spring samples in the
silicate catchment indicates that soil-derived CO2 was the main cause of seasonality
inδ13CDICvalues (Fig. 4a). The correlation betweenδ
13
CDICandpCO2in other types
25
of water was not as obvious as in the spring samples in the silicate catchment. In
HESSD
8, 1799–1825, 2011Dissolved inorganic carbon export from
carbonate and silicate
W. J. Shin et al.
Title Page
Abstract Introduction
Conclusions References
Tables Figures
◭ ◮
◭ ◮
Back Close
Full Screen / Esc
Printer-friendly Version Interactive Discussion
Discussion
P
a
per
|
Dis
cussion
P
a
per
|
Discussion
P
a
per
|
Discussio
n
P
a
per
|
in the spring (r2=0.58) and stream (r2=0.49) waters (Fig. 4b), and waters with low
EC occurred during the summer whenδ13CDICvalues were also low. EC increased as
the residence time of water in soil and groundwater reservoirs increased; thus, during summer, EC decreased due to the higher precipitation and rapid turnover of
subsur-face water (Clark and Fritz, 1997). This indicates that the seasonality ofδ13CDICin the
5
carbonate catchment was related to the change of the water regime due to seasonal precipitation patterns.
Precipitation, which was measured at the Yeongweol meteorological station about 40 km from the study area (data from Korea Meteorological Administration, KMA: www.kma.go.kr), varied throughout the study period (Fig. 2a). The average monthly
10
precipitation during summer and early fall (June to October) was 202.8 mm, but for the rest of the year (November to May) it was only 39.3 mm. The seasonal variation
of precipitation roughly coincided with the fluctuations in δ13CDIC (Fig. 2b) of all
wa-ter samples and in EC (Fig. 4b) of the carbonate catchment. During the dry season (October to May), pore water has a long residence time in the soil horizon, allowing
15
for an extended exchange of CO2 with the atmosphere through the soil zone, thereby
increasingδ13CDICand EC of the soil water. In contrast, during the wet season (June
to September), the frequent infiltration of rainwater into the soil and the outflow of in-terstitial soil waters from the vadose zone result in a shorter residence time for soil
water and limit CO2exchange with the atmosphere. Therefore, soil water in summer
20
and early fall displays lower δ13CDIC values and EC than does soil water during the
winter season (Amiotte-Suchet et al., 1999). The transport of CO2 produced by soil
respiration via soil/groundwaters with distinct EC is facilitated by the concentrated
pre-cipitation in summer. The effect ofpCO2was not clearly observed in the waters from
the carbonate catchment due to lower CO2/HCO−
3 ratios, but the analogous effect
as-25
sociated with seasonal changes in soil respiration and water regime can be expressed
HESSD
8, 1799–1825, 2011Dissolved inorganic carbon export from
carbonate and silicate
W. J. Shin et al.
Title Page
Abstract Introduction
Conclusions References
Tables Figures
◭ ◮
◭ ◮
Back Close
Full Screen / Esc
Printer-friendly Version Interactive Discussion
Discussion
P
a
per
|
Dis
cussion
P
a
per
|
Discussion
P
a
per
|
Discussio
n
P
a
per
|
4.4 DIC export from the river system
The importance of CO2 degassing was suggested from the previous discussion on
the changes inδ13CDIC values of spring and stream waters. The calculated excess
pCO2 was 19.8 in the silicate spring, 3.3 in the carbonate spring, 1.9 in the silicate
stream, and 0.9 in the carbonate stream (all as annual averages in 2005). Except for
5
the carbonate stream, the studied waters were over-saturated with CO2and assumed
to act as the source of atmospheric CO2(Yao et al., 2007). Although the excesspCO2
in the carbonate stream was lower than 1, indicating possible invasion of atmospheric
CO2, its DIC was still depleted in
13
C compared with atmosphere-derived DIC (∼0‰,
assumingδ13C of atmospheric CO2to be−7.8‰ from Brunet et al., 2005).
10
To quantitatively determine the amount of CO2 degassing, we applied the following
flux equation:
F=kCO2(Ceq−C),
whereF is the diffusive flux of CO2 to the atmosphere, kCO2 is the gas transfer
co-efficient, and Ceq andC are the dissolved CO2 concentrations in equilibrium with the
15
atmosphere and as measured, respectively. BecausekCO2 was not determined in this
study, we calculatedF for all possible ranges ofkCO2 using various relationships
be-tween wind speed and kCO2. The estimated kCO2 ranged from 0.14 m d−
1
(based on
Wanninkhof, 1992) to 1.92 m d−1 (based on Borges et al., 2004) at the mean wind
speed of 1.54 m s−1 during the study period (from KMA). The carbon flux to the
at-20
mosphere was estimated at 220 to 3000 g C m−2y−1 for the silicate spring water and
30 to 430 g C m−2y−1 for the carbonate spring water. The silicate stream water had
a carbon flux of 10 to 150 g C m−2y−1, whereas the carbonate stream water may have
incorporated atmospheric CO2at rates of 2 to 30 g C m−
2
y−1. Although the estimated
carbon flux was within the range reported in other studies (Richey et al., 2002; Yao
25
et al., 2007; Brunet et al., 2009; Dubois et al., 2010), it is notable that the effect
HESSD
8, 1799–1825, 2011Dissolved inorganic carbon export from
carbonate and silicate
W. J. Shin et al.
Title Page
Abstract Introduction
Conclusions References
Tables Figures
◭ ◮
◭ ◮
Back Close
Full Screen / Esc
Printer-friendly Version Interactive Discussion
Discussion
P
a
per
|
Dis
cussion
P
a
per
|
Discussion
P
a
per
|
Discussio
n
P
a
per
|
the silicate catchments were assumed to act as stronger sources than the carbonate catchments, and carbonate stream waters may even act as a minor sink.
Table 3 presents a comprehensive carbon budget for the studied river systems. A few assumptions were made to derive the catchment-scale carbon budget. First, the data measured at the mouth of the stream collectively represent the carbon exchange
char-5
acteristics of the stream waters, except for the first-order streams in the catchment. The first-order streams likely retained characteristics of the groundwater, which diminish in the higher-order streams (Johnson et al., 2008). Second, the spring waters represent the subsurface waters in each catchment, as discussed in Sect. 4.1. Third, the stream waters consisted primarily of discharged groundwater, although the hydrograph
sepa-10
ration of the studied streams was not available.
The DIC discharge via the stream was the largest component, ranging from
12.7 g C m−2y−1 in the silicate catchment to 38.3 g C m−2y−1 in the carbonate
catch-ment (data are normalized to the catchcatch-ment area). CO2 degassing from the stream
(higher than second order) was 0.05 to 0.68 g C m−2y−1 in the silicate catchment,
15
whereas CO2 dissolution of −0.01 to −0.17 g C m−
2
y−1 occurred in the carbonate
stream. Notably, the estimated CO2 degassing associated with the groundwater
dis-charge was significant, 1.1 to 14.9 g C m−2y−1 in the silicate catchment and 0.17 to
2.4 g C m−2y−1in the carbonate catchment. Depending on the adoptedkCO2, the CO2
degassing (from both stream and groundwater) may have been responsible for 8–55%
20
of the total DIC export from the silicate catchment, whereas it took up only 0.4–5.6%
in the carbonate catchment. The results clearly indicate that CO2 degassing at the
interface between groundwater and streams in headwater regions needs to be consid-ered to derive a reliable carbon budget in river systems, especially in silicate-dominant catchments.
25
Our carbon budget estimates are different from those in other studies because we
considered the CO2 degassing during groundwater discharge into the stream.
How-ever, uncertainties may exist in our estimation of CO2evasion from groundwater. For
HESSD
8, 1799–1825, 2011Dissolved inorganic carbon export from
carbonate and silicate
W. J. Shin et al.
Title Page
Abstract Introduction
Conclusions References
Tables Figures
◭ ◮
◭ ◮
Back Close
Full Screen / Esc
Printer-friendly Version Interactive Discussion
Discussion
P
a
per
|
Dis
cussion
P
a
per
|
Discussion
P
a
per
|
Discussio
n
P
a
per
|
groundwater and the stream because the quantity of CO2degassing depends on the
di-mension of the water surface. We assumed that the interface was the first-order stream where the immediate confluence of groundwater occurs. Previous studies (Johnson
et al., 2008; ¨Oquist et al., 2009) reported that the evasion of CO2, accompanied by
subsurface water input, was concentrated along a short distance (∼200 m) of stream
5
water from the confluence, which may substantiate our assumption. Another uncer-tainty is related to the proportion of groundwater components in the stream. Stream
waters may contain variable amounts of surface runoffand direct precipitation.
Hydro-graph separation using various tracers can give quantitative estimates of these water components (Genereaux and Hooper, 1998). Because we assumed that the stream
10
water was mostly derived from groundwater, the CO2degassing estimates in this study
likely represent the highest possible amount.
5 Conclusions
The uppermost tributaries of the SHR, South Korea, provided an ideal natural setting to
examine the effects of catchment lithology, seasonality in metabolic activities and
wa-15
ter regimes, and atmospheric exchange onδ13CDIC values and carbonate chemistry.
The relatively pristine DIC sources can be represented by spring waters, which clearly
exhibited the effects of catchment lithology, i.e., silicate vs. carbonate, onδ13CDIC
val-ues. Seasonal variations were obvious in relation to the temperature-induced changes in metabolic activities and the precipitation-induced changes in hydrologic regimes.
20
Both stream waters were enriched with 13C compared to the respective spring
wa-ters. This was in part due to aquatic photosynthesis, but was primarily caused by
CO2 degassing, which occurred from the groundwater and streams, but the
magni-tude was far greater from the groundwater. The estimated carbon budget depended on
the catchment lithology. In the silicate catchment, CO2 degassing associated with the
25
groundwater discharge could be as high as the DIC discharge via the rivers. In
HESSD
8, 1799–1825, 2011Dissolved inorganic carbon export from
carbonate and silicate
W. J. Shin et al.
Title Page
Abstract Introduction
Conclusions References
Tables Figures
◭ ◮
◭ ◮
Back Close
Full Screen / Esc
Printer-friendly Version Interactive Discussion
Discussion
P
a
per
|
Dis
cussion
P
a
per
|
Discussion
P
a
per
|
Discussio
n
P
a
per
|
in the carbonate catchment, with possible CO2 uptake by the stream. We emphasize
the importance of CO2export associated with groundwater discharge at the
headwa-ter regions and its variability with the catchment lithology for a more comprehensive carbon budget of river systems.
Acknowledgements. The authors thank Seong Hoon Chung, Sang Yeol Lee, Woo Ho Myung,
5
Ji Seung Park, Ahn Na Jo, Hee Jin Ahn, Soo Jin Ham, Byeong Il Ahn, and Nam Yeong Jo for their help with the fieldwork and the reviewers who improved the manuscript. This work was supported by an IPET (Korea Institute of Planning and Evaluation for Technology of Food, Agri-culture, Forestry and Fisheries) grant and by the Ministry of Education, Science and Technology (2009-008146).
10
References
Acour, A. M., Sheppard, S. M. F., Guyomar, O., and Wattelet, J.: Use of13C to trace origin and cycling of inorganic carbon in the Rhone River system, Chem. Geol., 159, 87–105. 1999. Amiotte-Suchet, P., Aubert, D., Probst, J. L., Gauthier-Lafaye, F., Probst, A., Andreux, F., and
Viville, D.: δ13C pattern of dissolved inorganic carbon in a small granitic catchment: the
15
Strengbach case study (Vosges Mountains, France), Chem. Geol., 159, 129–145, 1999. Atekwana, E. A. and Krishnamurthy, R. V.: Seasonal variations of dissolved inorganic carbon
andδ13C of surface waters: application of a modified gas evolution technique, J. Hydrol., 205, 265–278, 1998.
Barth, J. A. C. and Veizer, J.: Carbon cycle in St. Lawrence aquatic ecosystems at Cornwall
20
(Ontario), Canada: seasonal and spatial variations, Chem. Geol., 159, 107–128, 1999. Borges, A. V., Vanderborght, J.-P., Schiettecatte, L.-S., Gazeau, F., Ferr ´on-Smith, S., Delille, B.,
and Frankignoulle, M.: Variability of the gas transfer velocity of CO2in a macrotidal estuary (the Scheldt), Estuaries, 27, 593–603, doi:10.1007/BF02907647, 2004.
Brunet, F., Gaiero, D., Probst, J. L., Depetris, P. J., Gauthier Lafaye, F., and Stille, P.:δ13C
trac-25
ing of dissolved inorganic carbon sources in Patagonian rivers (Argentina), Hydrol. Process., 19, 3321–3344, 2005.
HESSD
8, 1799–1825, 2011Dissolved inorganic carbon export from
carbonate and silicate
W. J. Shin et al.
Title Page
Abstract Introduction
Conclusions References
Tables Figures
◭ ◮
◭ ◮
Back Close
Full Screen / Esc
Printer-friendly Version Interactive Discussion
Discussion
P
a
per
|
Dis
cussion
P
a
per
|
Discussion
P
a
per
|
Discussio
n
P
a
per
|
and Probst, J. L.: Terrestrial and fluvial carbon fluxes in a tropical watershed: Nyong Basin, Cameroon, Chem. Geol., 265, 563–572, 2009.
Clark, I. D. and Fritz, P.: Environmental Isotope Hydrogeology, Lewis Publishers, New York, 1997.
Dubois, K. D., Lee, D., and Veizer, J.: Isotopic constraints on alkalinity, dissolved organic
car-5
bon, and atmospheric carbon dioxide fluxes in the Mississippi River, J. Geophys. Res., 115, G02018, doi:10.1029/2009JG001102, 2010.
Finlay, J. C.: Controls of streamwater dissolved inorganic carbon dynamics in a forested wa-treshed, Biogeochemistry, 62, 231–252, 2003.
Friedlingstein, P., Dufresne, J.-L., Cox, P. M., and Rayner, P.: How positive is the feedback
10
between climate change and the carbon cycle?, Tellus, 55B, 692–700, 2003.
Genereux, D. P. and Hooper, R. P.: Oxygen and hydrogen isotopes in rainfall-runoffstudies, in: Isotope Tracers in Catchment Hydrology, edited by: Kendall, C. and McDonell, J. J., Elsevier, Amsterdam, 319–346, 1998.
Govindasamy, B., Thompson, S., Mirin, A., Wickett, M., Caldeira, K., and Delire, C.: Increase
15
of carbon cycle feedback with climate sensitivity: results from a coupled climate and carbon cycle model, Tellus, 57B, 153–163, 2005.
H ´elie, J. F., Haillaire-Marcel, C., and Rondeau, B.: Seasonal changes in the sources and fluxes of dissolved inorganic carbon through the St. Lawrence River – isotopic and chemical con-straint, Chem. Geol., 186, 117–138, 2002.
20
Hamada, Y. and Tanaka, T.: Dynamics of carbon dioxide in soil profiles based on long-term field observation, Hydrol. Process., 15, 1829–1845, 2001.
Hope, D., Palmer, S. M., Billett, M. F., and Dawson, J. J. C.: Variations in dissolved CO2and CH4 in a first-order stream and catchment: an investigation of soil-stream linkages, Hydrol. Process., 18, 3255–3275, 2004.
25
Jin, L., Williams, E. L., Szramek, K. J., Walter, L. M., and Hamilton, S. K.: Silicate and car-bonate mineral weathering in soil profiles developed on Pleistocene glacial drift (Michigan, USA): mass balances on soil water geochemistry, Geochim. Cosmochim. Ac., 72, 1027– 1042, 2008.
Johnson, M. S., Lehmann, J., Riha, S. J., Krusche, A. V., Richey, J. E., Ometto, J. P. H. B., and
30
HESSD
8, 1799–1825, 2011Dissolved inorganic carbon export from
carbonate and silicate
W. J. Shin et al.
Title Page
Abstract Introduction
Conclusions References
Tables Figures
◭ ◮
◭ ◮
Back Close
Full Screen / Esc
Printer-friendly Version Interactive Discussion
Discussion
P
a
per
|
Dis
cussion
P
a
per
|
Discussion
P
a
per
|
Discussio
n
P
a
per
|
explanatory note of the Gangreung-Sokcho sheet, Korea Institute of Geoscience and Mineral Resources, Daejeon, Korea, 2001.
Lee, K. S., Ryu, J. S., Ahn, K. H., Chang, H. W., and Lee, D.: Factors controlling carbon isotope ratios of dissolved inorganic carbon in two major tributaries of the Han River, Korea, Hydrol. Process., 21, 500–509, 2007.
5
Ludwig, W., Amiotte-Suchert, P., Munhoven, G., and Probst, J. L.: Atmospheric CO2 consump-tion by continental erosion: present-day control and implicaconsump-tions for the last glacial maximum, Global Planet. Change, 16–17, 107–120, 1997.
Meybeck, M.: Global chemical weathering of surficial rocks estimated from river dissolved loads, Am. J. Sci., 287, 401–428, 1987.
10
Mortatti, J. and Probst, J. L.: Silicate rock weathering and atmospheric/soil CO2uptake in the Amazon Basin estimated from river water geochemistry: seasonal and spatial variations, Chem. Geol., 197, 177–196, 2003.
O’Leary, M. H.: Carbon isotopes in photosynthesis, Bioscience, 38, 328–336, 1988. ¨
Oquist, M. G., Wallin, M., Seibert, J., Bishop, K., and Laudon, H.: Dissolved inorganic carbon
15
export across the soil/stream interface and its fate in a boreal headwater stream, Environ. Sci. Technol., 43, 7364–7369, 2009.
Parkhust, D. L. and Appelo, C. A. J.: User’s guide to PHREEQC (version 2) – a computer pro-gram for speciation, batch-reaction, one-dimensional transport, and inverse geochemical cal-culations, US Geological Survey Water-Resources Investigations Report, USGS, 99–4259,
20
312 pp., 1999.
Raymond, P. A. and Bauer, J. E.: Atmospheric CO2evasion, dissolved inorganic carbon pro-duction, and net heterotrophy in the York River estuary, Limnol. Oceanogr., 45, 1707–1717, 2000.
Richey, J. E., Melack, J. M., Aufdenkampe, A. K., Ballester, V. M., and Hess, L. L.: Outgassing
25
from Amazonian rivers and wetlands as a large tropical source of atmospheric CO2, Nature, 416, 617–620, 2002.
Round, S. A. and Wilde, F. D.: Field Measurements: US Geological Survey Techniques of Water-Resources investigations, Book 9, Chapt. A6., Sect. 6.2, USGS, 2001.
Tan, F. C. and Edmond, J. M.: Carbon isotope geochemistry of the Orinoco Basin, Estuar.
30
Coast. Shelf S., 36, 541–547, 1993.
HESSD
8, 1799–1825, 2011Dissolved inorganic carbon export from
carbonate and silicate
W. J. Shin et al.
Title Page
Abstract Introduction
Conclusions References
Tables Figures
◭ ◮
◭ ◮
Back Close
Full Screen / Esc
Printer-friendly Version Interactive Discussion
Discussion
P
a
per
|
Dis
cussion
P
a
per
|
Discussion
P
a
per
|
Discussio
n
P
a
per
|
J. Hydrol., 186, 161–190, 1996.
Telmer, K. and Veizer, J.: Carbon fluxes,pCO2 and substrate weathering in a large northern river basin, Canada: carbon isotope perspectives, Chem. Geol., 159, 61–86, 1999.
Wang, X. and Veizer, J.: Respiration-photosynthesis balance of terrestrial aquatic ecosystem, Ottawa area, Canada, Geochim. Cosmochim. Ac., 64, 3775–3786, 2000.
5
Wanninkhof, R.: Relationship between wind speed and gas exchange over the ocean, J. Geo-phys. Res., 97, 7373–7382, doi:10.1029/92JC00188, 1992.
Xie, Z., Cadisch, G., Edwards, G., Baggs, E. M., and Blum, H.: Carbon dynamics in a temperate grassland soil after 9 years exposure to elevated CO2(Swiss FACE), Soil Biol. Biochem., 37, 1387–1395, 2005.
10
Yang, C., Telmer, K., and Veizer, J.: Chemical dynamics of the “St. Lawrence” riverine system:
δDH 2O, δ
18
OH2 O, δ
13
CDIC, δ34Ssulfate, and dissolved 87Sr/86Sr, Geochim. Cosmochim. Ac., 60, 851–866, 1996.
Yao, G., Gao, Q., Wang, Z., Huang, X., He, T., Zhang, Y., Jiao, S., and Ding, J.: Dynamics of CO2 partial pressure and CO2outgassing in the lower reaches of the Xijiang River, a
sub-15
tropical monsoon river in China, Sci. Total Environ., 376, 255–266, 2007.
HESSD
8, 1799–1825, 2011Dissolved inorganic carbon export from
carbonate and silicate
W. J. Shin et al.
Title Page
Abstract Introduction
Conclusions References
Tables Figures
◭ ◮
◭ ◮
Back Close
Full Screen / Esc
Printer-friendly Version Interactive Discussion
Discussion
P
a
per
|
Dis
cussion
P
a
per
|
Discussion
P
a
per
|
Discussio
n
P
a
per
|
Table 1. Comparison of the physical characteristics and mean discharge for the Odae and
Jijang catchments (Water Management Information System: www.wamis.go.kr).
Tributary Odae (silicate) Jijang (carbonate)
Catchment area (km2) 452 225
Total stream length (km) 521 464 1storder stream length (km) 272 230 Main channel∗ length (km) 44 37
Mean width (m) 8.2 5.6
Mean discharge (m3s−1
) 7 3
HESSD
8, 1799–1825, 2011Dissolved inorganic carbon export from
carbonate and silicate
W. J. Shin et al.
Title Page
Abstract Introduction
Conclusions References
Tables Figures
◭ ◮
◭ ◮
Back Close
Full Screen / Esc
Printer-friendly Version Interactive Discussion
Discussion
P
a
per
|
Dis
cussion
P
a
per
|
Discussion
P
a
per
|
Discussio
n
P
a
per
|
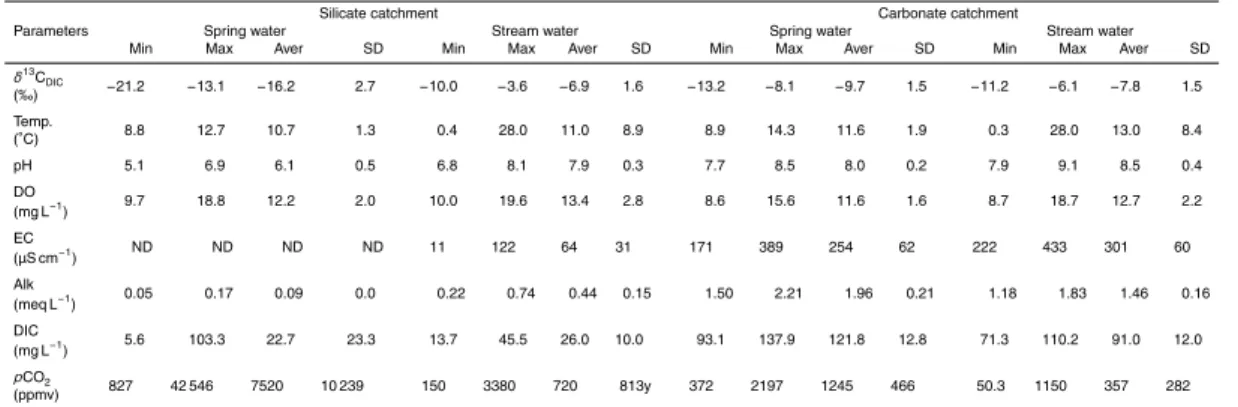
Table 2.Statistical summary of geochemical parameters measured from springs and streams
in the study area.
Silicate catchment Carbonate catchment
Parameters Spring water Stream water Spring water Stream water Min Max Aver SD Min Max Aver SD Min Max Aver SD Min Max Aver SD δ13C
DIC −21.2 −13.1 −16.2 2.7 −10.0 −3.6 −6.9 1.6 −13.2 −8.1 −9.7 1.5 −11.2 −6.1 −7.8 1.5
(‰) Temp.
8.8 12.7 10.7 1.3 0.4 28.0 11.0 8.9 8.9 14.3 11.6 1.9 0.3 28.0 13.0 8.4 (◦C)
pH 5.1 6.9 6.1 0.5 6.8 8.1 7.9 0.3 7.7 8.5 8.0 0.2 7.9 9.1 8.5 0.4 DO
9.7 18.8 12.2 2.0 10.0 19.6 13.4 2.8 8.6 15.6 11.6 1.6 8.7 18.7 12.7 2.2 (mg L−1)
EC
ND ND ND ND 11 122 64 31 171 389 254 62 222 433 301 60 (µS cm−1)
Alk 0.05 0.17 0.09 0.0 0.22 0.74 0.44 0.15 1.50 2.21 1.96 0.21 1.18 1.83 1.46 0.16 (meq L−1)
DIC 5.6 103.3 22.7 23.3 13.7 45.5 26.0 10.0 93.1 137.9 121.8 12.8 71.3 110.2 91.0 12.0 (mg L−1
)
pCO2 827 42 546 7520 10 239 150 3380 720 813y 372 2197 1245 466 50.3 1150 357 282
(ppmv)
ND: not determined.
HESSD
8, 1799–1825, 2011Dissolved inorganic carbon export from
carbonate and silicate
W. J. Shin et al.
Title Page
Abstract Introduction
Conclusions References
Tables Figures
◭ ◮
◭ ◮
Back Close
Full Screen / Esc
Printer-friendly Version Interactive Discussion
Discussion
P
a
per
|
Dis
cussion
P
a
per
|
Discussion
P
a
per
|
Discussio
n
P
a
per
|
Table 3. Estimated annual carbon budget of the studied catchments. All units are g C m2y−1
and normalized to the catchment area.
Tributary Odae (silicate) Jijang (carbonate) DIC discharge via streams 12.7 38.3
CO2degassing from streams∗ 0.05∼0.68 −0.01∼ −0.17 CO2degassing from groundwater∗ 1.1∼14.9 0.17∼2.4 ∗Fluxes were calculated for the range of gas transfer coe
HESSD
8, 1799–1825, 2011Dissolved inorganic carbon export from
carbonate and silicate
W. J. Shin et al.
Title Page
Abstract Introduction
Conclusions References
Tables Figures
◭ ◮
◭ ◮
Back Close
Full Screen / Esc
Printer-friendly Version Interactive Discussion
Discussion
P
a
per
|
Dis
cussion
P
a
per
|
Discussion
P
a
per
|
Discussio
n
P
a
per
|
Fig. 1.Map showing the basement lithology and sampling locations of the studied catchments,
HESSD
8, 1799–1825, 2011Dissolved inorganic carbon export from
carbonate and silicate
W. J. Shin et al.
Title Page
Abstract Introduction
Conclusions References
Tables Figures
◭ ◮
◭ ◮
Back Close
Full Screen / Esc
Printer-friendly Version Interactive Discussion
Discussion
P
a
per
|
Dis
cussion
P
a
per
|
Discussion
P
a
per
|
Discussio
n
P
a
per
|
δ
Fig. 2.Amount of precipitation(a),δ13CDICvalues(b), andpCO2(c)of waters from the silicate
HESSD
8, 1799–1825, 2011Dissolved inorganic carbon export from
carbonate and silicate
W. J. Shin et al.
Title Page
Abstract Introduction
Conclusions References
Tables Figures
◭ ◮
◭ ◮
Back Close
Full Screen / Esc
Printer-friendly Version Interactive Discussion
Discussion
P
a
per
|
Dis
cussion
P
a
per
|
Discussion
P
a
per
|
Discussio
n
P
a
per
|
Fig. 3. Cross plot of alkalinity vs. pH in spring and stream waters. Note that the four different
HESSD
8, 1799–1825, 2011Dissolved inorganic carbon export from
carbonate and silicate
W. J. Shin et al.
Title Page
Abstract Introduction
Conclusions References
Tables Figures
◭ ◮
◭ ◮
Back Close
Full Screen / Esc
Printer-friendly Version Interactive Discussion
Discussion
P
a
per
|
Dis
cussion
P
a
per
|
Discussion
P
a
per
|
Discussio
n
P
a
per
|
–
–
Fig. 4. Cross plots ofpCO2 vs.δ13CDIC(a), and EC vs.δ13CDIC(b). Summer=June through
HESSD
8, 1799–1825, 2011Dissolved inorganic carbon export from
carbonate and silicate
W. J. Shin et al.
Title Page
Abstract Introduction
Conclusions References
Tables Figures
◭ ◮
◭ ◮
Back Close
Full Screen / Esc
Printer-friendly Version Interactive Discussion
Discussion
P
a
per
|
Dis
cussion
P
a
per
|
Discussion
P
a
per
|
Discussio
n
P
a
per
|
vs. δ EC vs. δ
δ
Fig. 5.Cross plots of(a)DOsatvs.∆δ13CDIC[δ13CDIC(stream water)−δ13CDIC(spring water)],

![Fig. 5. Cross plots of (a) DO sat vs. ∆ δ 13 C DIC [δ 13 C DIC (stream water) − δ 13 C DIC (spring water)], and (b) ∆ pCO 2 [pCO 2 (spring water) − pCO 2 (stream water)] vs](https://thumb-eu.123doks.com/thumbv2/123dok_br/17107518.237794/27.918.218.489.42.567/cross-stream-water-spring-water-spring-water-stream.webp)
