AMTD
5, 3499–3518, 2012Isotope reference gas for atmospheric
CH4
P. Sperlich et al.
Title Page
Abstract Introduction
Conclusions References
Tables Figures
◭ ◮
◭ ◮
Back Close
Full Screen / Esc
Printer-friendly Version Interactive Discussion
Discussion
P
a
per
|
Dis
cussion
P
a
per
|
Discussion
P
a
per
|
Discussio
n
P
a
per
|
Atmos. Meas. Tech. Discuss., 5, 3499–3518, 2012 www.atmos-meas-tech-discuss.net/5/3499/2012/ doi:10.5194/amtd-5-3499-2012
© Author(s) 2012. CC Attribution 3.0 License.
Atmospheric Measurement Techniques Discussions
This discussion paper is/has been under review for the journal Atmospheric Measurement Techniques (AMT). Please refer to the corresponding final paper in AMT if available.
A combustion setup to precisely
reference
δ
13
C and
δ
2
H isotope ratios of
pure CH
4
to produce isotope reference
gases of
δ
13
C-CH
4
in synthetic air
P. Sperlich1,*, M. Guillevic1,2,*, C. Buizert1, T. M. Jenk1, C. J. Sapart3, H. Schaefer4, and T. Blunier1
1
Centre for Ice and Climate, University of Copenhagen, Copenhagen, Denmark
2
Laboratoire des Sciences du Climat et de l’Environnement, Gif sur Yvette, France
3
Institute for Marine and Atmospheric Research Utrecht (IMAU), Utrecht University, Utrecht, The Netherlands
4
National Institute for Water and Atmospheric Research (NIWA), Wellington, New Zealand
*
These authors contributed equally to this work.
Received: 17 March 2012 – Accepted: 27 April 2012 – Published: 11 May 2012 Correspondence to: P. Sperlich ([email protected])
AMTD
5, 3499–3518, 2012Isotope reference gas for atmospheric
CH4
P. Sperlich et al.
Title Page
Abstract Introduction
Conclusions References
Tables Figures
◭ ◮
◭ ◮
Back Close
Full Screen / Esc
Printer-friendly Version Interactive Discussion
Discussion
P
a
per
|
Dis
cussion
P
a
per
|
Discussion
P
a
per
|
Discussio
n
P
a
per
|
Abstract
Isotope records of atmospheric CH4can be used to infer changes in the biochemistry
of CH4. One factor limiting quantitative estimates of changes in the biogeochemistry
of CH4are the uncertainties of the isotope measurements due to the lack of a unique isotope reference gas, certified for δ13C-CH4 or δ2H-CH4. We present a method to 5
produce isotope reference gases for CH4in synthetic airs that are precisely anchored
to the VPDB and VSMOW scale and containδ13C-CH4 values typical for the modern and glacial atmosphere. We quantitatively combusted two pure CH4gases from fossil and biogenic sources and determined theδ13C and δ2H values of the produced CO2 and H2O relative to the VPDB and VSMOW scale within a very small analytical
un-10
certainty of 0.04 ‰ and 0.7 ‰, respectively. We found isotope ratios of−39.56 ‰ and −56.37 ‰ forδ13C and−170.1 ‰ and−317.4 ‰ forδ2H in the fossil and biogenic CH4, respectively. We used both CH4types as parental gases from which we mixed two filial
CH4 gases. Theirδ 13
C was determined to be−42.21 ‰ and−47.25 ‰, representing glacial and present atmospheric δ13C-CH4. The δ2H isotope ratios of the filial CH4 15
gases were found with−193.1 ‰ and−237.1 ‰, respectively. Next, we mixed aliquots of the filial CH4gases with ultrapure N2/O2(CH4≤2 ppb) producing two isotope
refer-ence gases of synthetic air with CH4mixing ratios near atmospheric values. We show
that our method is reproducible and does not introduce isotopic fractionation forδ13C within the uncertainties of our detection limit (we cannot conclude this forδ2H because 20
AMTD
5, 3499–3518, 2012Isotope reference gas for atmospheric
CH4
P. Sperlich et al.
Title Page
Abstract Introduction
Conclusions References
Tables Figures
◭ ◮
◭ ◮
Back Close
Full Screen / Esc
Printer-friendly Version Interactive Discussion
Discussion
P
a
per
|
Dis
cussion
P
a
per
|
Discussion
P
a
per
|
Discussio
n
P
a
per
|
1 Introduction
Methane is a powerful greenhouse gas and therefore of major interest when studying the climate system. Records of CH4 in the recent atmosphere exhibit small changes
in seasonal and spatial patterns (e.g., Dlugokencky et al., 2009; Tyler et al., 2007). In contrast, ice core records of CH4 mixing and isotope ratios show much stronger
5
variability on decadal to glacial time scales (e.g., Loulergue et al., 2008; Ferretti et al., 2005; Sowers, 2006; Bock et al., 2010). The isotopic composition of atmospheric CH4 is a function of the relative strengths of its sinks and sources, which are themselves characterized by distinct signatures of the carbon and hydrogen isotope ratios (e.g., Quay et al., 1999), see Fig. 1. Therefore, changes in the biogeochemistry of CH4can 10
be inferred by analyzing the CH4 mixing ratio and isotope records. Isotope ratios are
reported using the delta notation according to Eq. (1):
δ=
Rsample
Rstandard !
−1 (1)
whereR denotes the ratio of the rare over the abundant isotope in the sample and the standard, respectively. Dual Inlet-Isotope ratio mass spectrometry (DI-IRMS) and 15
gas-chromatography coupled isotope ratio mass spectrometry (GC-IRMS) are com-monly applied to measure the isotope ratios of atmospheric CH4(Merritt et al., 1995b;
Rice et al., 2001), following the identical treatment principle (IT-principle), (Werner and Brand, 2001). Isotope reference gases are used to anchor the sample to the interna-tional isotope scales, which is VPDB forδ13C-CH4 and VSMOW forδ2H-CH4. Ideally, 20
the isotope reference gas is similar in mixing ratio and the isotopic composition to the measurand (Werner and Brand, 2001; Brand et al., 2009) to allow for the highest ana-lytical precision and accuracy. Accurate referencing is vital which becomes particularly obvious when datasets from different laboratories are merged for the interpretation of spatial atmospheric processes. In this case, differences could be due to natural variabil-25
AMTD
5, 3499–3518, 2012Isotope reference gas for atmospheric
CH4
P. Sperlich et al.
Title Page
Abstract Introduction
Conclusions References
Tables Figures
◭ ◮
◭ ◮
Back Close
Full Screen / Esc
Printer-friendly Version Interactive Discussion
Discussion
P
a
per
|
Dis
cussion
P
a
per
|
Discussion
P
a
per
|
Discussio
n
P
a
per
|
impact on the quantification of sink and source budgets (Fletcher et al., 2004). One limitation to the accuracy of CH4 isotope measurements is the accuracy to which the
true isotope value of the isotope reference gas is known. Laboratories can increase their compatibility by circulating a suite of isotope reference gases in so called round-robins. Round-robins have been conducted for more than 14 yr and included several 5
measurands e.g. CH4 mixing ratios and CO2 isotopes in air to highlight accuracy off
-sets and to identify scale contraction effects (Brand, 2011). However, the comparison is limited as the flasks are not permanently available to each laboratory. To our current knowledge, round-robin results for CH4 isotopes in air have not been published yet.
The compatibility of measurements on CH4isotopes in air could be achieved by estab-10
lishing a suite of unique isotope reference gases that are available to all laboratories, as it is done for CH4mixing ratios (Dlugokencky et al., 2005) and CO2isotopes (Ghosh
et al., 2005), respectively. An ideal suite of isotope reference gases would cover the isotope and mixing ratio variability of modern and glacial atmospheres. Despite the obvious demand, a suite of unique isotope reference gases is currently not available 15
for CH4 isotopes. Even pure CH4 gases with certified isotope ratios are currently not
available from recognized authorities (such as the International Atomic Energy Agency, IAEA, or the National Institute of Standards and Technology, NIST). Here, we present a method to produce large amounts of isotope reference gases for atmospheric CH4
with targeted and precisely referenced isotope ratios. 20
2 Methods
2.1 Method overview
All standards and gases employed in the method are listed in Table 1, using the termi-nology according to Coplen (2011). We prepared two pure CH4gases that are referred to as fossil and biogenic CH4, respectively, with regards to their origin. Next, we de-25
AMTD
5, 3499–3518, 2012Isotope reference gas for atmospheric
CH4
P. Sperlich et al.
Title Page
Abstract Introduction
Conclusions References
Tables Figures
◭ ◮
◭ ◮
Back Close
Full Screen / Esc
Printer-friendly Version Interactive Discussion
Discussion
P
a
per
|
Dis
cussion
P
a
per
|
Discussion
P
a
per
|
Discussio
n
P
a
per
|
VSMOW for δ13C and δ2H, respectively. This was achieved with a referenced CO2 gas (referred to as CO2-40 339) and three isotope reference waters (named DC
′
02, NM′09 and−15). The mentioned isotope reference materials are calibrated versus in-ternational measurement standards, specified by Verkouteren (1999) and IAEA (2009). From the parental fossil and biogenic CH4, we mixed two filial CH4gases. We matched
5
theδ13C value of the filial mixtures to atmospheric values reported for the present day and the last glacial maximum (Quay et al., 1999; Fischer et al., 2008). The filial CH4
mixtures will hereafter be referred to as the glacial isotope standard (GISp) and the
modern isotope standard (MISp), respectively, where the index p specifies a pure CH4 gas. Bothδ13C-CH4andδ2H-CH4isotope ratios of GISpand MISpwere precisely refer-10
enced versus CO2-40 339 and the isotope reference waters, see Fig. 1. Next, aliquots of GISp and MISp were blended with CH4-free air, until atmospheric mixing ratios of
CH4 were reached. This resulted in two synthetic isotope reference gases containing
CH4withδ 13
C values akin to the glacial and modern atmosphere which will be referred to as GIS and MIS, respectively. We then used GIS and MIS as isotope reference gas 15
to reference a tank of atmospheric air (taken at a clean air site in North-West Green-land (77.45◦N, 51.06◦W) in July 2008, hereafter referred to as NEEM) according to the IT-principle (Werner and Brand, 2001). Finally, our results forδ13C-CH4 of NEEM were compared to the results of two external laboratories (not forδ2H-CH4 because our setup is currently not equipped for such measurement).
20
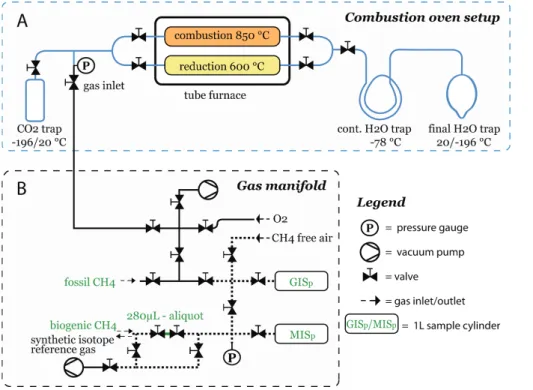
2.2 Calibration of pure CH4
Figure 2a shows the setup used to quantitatively combust pure CH4to CO2 and H2O, which were subsequently trapped for consecutive isotope analysis. This procedure will hereafter be referred to as offline combustion method. The combustion unit is a vacuum system consisting of two quartz glass tubes of 10 and 12 mm inner diameter (ID) and 25
AMTD
5, 3499–3518, 2012Isotope reference gas for atmospheric
CH4
P. Sperlich et al.
Title Page
Abstract Introduction
Conclusions References
Tables Figures
◭ ◮
◭ ◮
Back Close
Full Screen / Esc
Printer-friendly Version Interactive Discussion
Discussion
P
a
per
|
Dis
cussion
P
a
per
|
Discussion
P
a
per
|
Discussio
n
P
a
per
|
throughout the heated zone. The copper oxide is held in place by quartz glass frits to one side and with quartz wool to the other side. Tubes outside the furnace are made of borosilicate glass. Figure 2a shows the H2O section to the right side and the CO2
section with the gas inlet to the left side of the furnace. The H2O section is made
of a glass tube with 10 mm outer diameter (OD). It consists of a double loop used 5
as continuous H2O trap which leads into a 250 ml bottle trap. The tear shaped bottle
bottom enables to focus the H2O in a narrow, well defined spot for easy pipetting of the
sample into a sample vial for subsequentδ2H analysis. The tubes in the CO
2section
are of 12 mm OD, only the branch to the gas inlet is of 6 mm OD so it can be connected to a 1/4′′stainless steel T-piece. A 250 ml cylindrical trap with a stopcock is connected 10
with a 1/2′′ Ultra-Torr connector. It can be removed to transfer the CH4-derived CO2 for subsequent analysis. Figure 2b displays the gas manifold, which represents the interface between the combustion unit and all peripheral units such as the pump, gas tanks and sample cylinders. Manifold and combustion unit are connected via a flexible stainless steel tube that prevents the propagation of vibration from the pump to the 15
glass system. A pressure gauge (2 bar max) between combustion unit and flexible tube is used to quantify the amount of introduced sample gas and to indicate pressure changes inside the combustion unit. The pressure in the mixing part of the manifold is measured by a second pressure gauge (60 bar max). Two 1 l sample cylinders in the high pressure part of the manifold are used as reservoirs to mix and store pure 20
CH4 gases. The copper inside the combustion unit is oxidized with O2 (Table 1) at temperatures of 600◦C according to Reaction (R1):
2Cu+O2⇋2CuO (R1)
O2is released during the combustion by the reverse reaction of R1 when the furnace
is heated to 850◦C. The copper serves as either reducing or oxidizing agent (O2 accep-25
tor or donor) depending on the furnace temperature setting (Merritt et al., 1995a). At the beginning of a combustion process, the continuous H2O trap was cooled to−78
◦
C. Aliquots of 120–160 ml CH4were injected into the evacuated combustion reactor at
AMTD
5, 3499–3518, 2012Isotope reference gas for atmospheric
CH4
P. Sperlich et al.
Title Page
Abstract Introduction
Conclusions References
Tables Figures
◭ ◮
◭ ◮
Back Close
Full Screen / Esc
Printer-friendly Version Interactive Discussion
Discussion
P
a
per
|
Dis
cussion
P
a
per
|
Discussion
P
a
per
|
Discussio
n
P
a
per
|
oxide of the combustion unit released the oxygen for the CH4 oxidation (Merritt et al., 1995a). The CO2 and the H2O trap were alternately submerged in liquid nitrogen to
transfer CO2 and H2O through the system resulting in convection that forced the CH4
through the combustion reactor. This process is hereafter referred to as cryo-transfer. The cryo-transfers generate CO2 and H2O until the CH4 is quantitatively combusted.
5
This step is critical as isotope fractionation occurs in the combustion process so that incomplete oxidization leads to an offset between the δ13C of the initial CH
4 and the
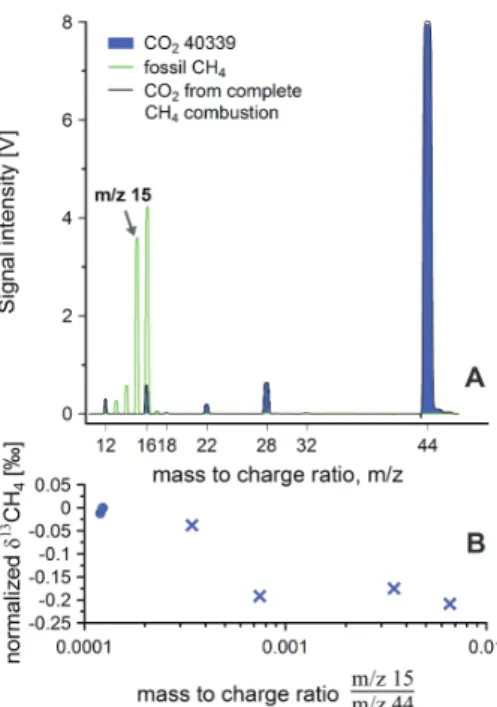
δ13C of the CO2derived from it (Merritt et al., 1995a). Tests showed reproducibleδ13C values when the samples were quantitatively combusted (Fig. 3), which was the case after 25 cryo-transfer cycles.
10
N2O might form from traces of N2 and O2 in the oxidation reactor (Vaughn et al., 2004) and must be eliminated to avoid mass interferences with CO2 in the DI-IRMS
(Ghosh and Brand, 2004). Therefore, we reduced N2O to N2and O2 in the reduction
reactor (Fig. 2a) according to the following Reaction (R2):
N2O+Cu→N2+CuO (R2)
15
First, we cryo-focus the sample gas in the traps and close the trap valves. Next, the reduction unit is evacuated while held at a constant temperature of 850◦C. This step liberates any O2 in the reduction unit according to Reaction (R1), thereby increasing
the reduction capacity of the copper in preparation for the following reduction process (Kapteijn et al., 1996). Afterwards, the oven temperature is decreased to 600◦C and we 20
cryo-transfer the sample gas 10 times through the reduction unit, where N2O is reduced
according to Reaction (R2). While O2 is absorbed by the copper, N2 remains in the
sample gas (Kapteijn et al., 1996). The CO2does not react with the copper at 600
◦
C. This way, N2O is quantitatively eliminated from the sample gas. Subsequently, the CO2 trap is submerged in liquid nitrogen for four minutes until all CO2is trapped. Extending
25
the CO2trapping time to 20 min showed no effect on theδ 13
C values. The CO2trap is
AMTD
5, 3499–3518, 2012Isotope reference gas for atmospheric
CH4
P. Sperlich et al.
Title Page
Abstract Introduction
Conclusions References
Tables Figures
◭ ◮
◭ ◮
Back Close
Full Screen / Esc
Printer-friendly Version Interactive Discussion
Discussion
P
a
per
|
Dis
cussion
P
a
per
|
Discussion
P
a
per
|
Discussio
n
P
a
per
|
liquid nitrogen. From there the water is transferred into a 1 ml glass vial for subsequent analysis. The combustion unit gets re-oxidized with pure O2 at 600◦C in preparation of the consecutive sample. We measured the δ13C of CO2 produced from the CH4 combustion by DI-IRMS (Delta V Plus, Thermo Finnigan, Germany). For δ2H in H2O we used either GC-IRMS coupled to an Elemental Analyzer (Thermo Finnigan, Delta 5
V Advantage) or laser spectroscopy (Picarro Inc., USA).
2.3 Preparation of pure CH4gases and mixing of GISpand MISp
We mixed fossil and biogenic CH4 to obtain GISp and MISp (Fig. (1). The fossil CH4
was commercially purchased and has a high purity level of 99.995%. The biogenic CH4was taken from a biogas reactor (Table 1) and needed purification prior to its use.
10
Biogenic CH4 is produced when methanogenic bacteria ferment organic material in
anaerobic conditions. This process is commercially used to generate biogenic CH4as a green fuel from agricultural products with CH4 concentrations of ∼95 %, where the remaining 5 % are mostly N2/O2 but also traces of CO2, H2O and H2S. We received
a 50 l tank of biogenic CH4 and removed the CO2, H2O and H2S while a CH4 aliquot
15
was transferred from the source tank to a 1 l sample cylinder at the manifold (Fig. 2b). A 1.5 m long, 1/4′′OD tube was filled with sodium hydroxide and magnesium perchlo-rate hydperchlo-rate to absorb CO2 and H2O, respectively. Subsequently, a coiled 1/8
′′
tube (2 m long) submerged in a liquid nitrogen/n-Pentane slush froze out H2S and residual H2O at −131
◦
C. Aliquots of purified biogenic CH4 could then be introduced into the
20
combustion unit from the 1 l sample cylinder for analysis as described in Sect. 2.2. We introduced biogenic CH4 into both 1 l sample cylinders shown in Fig. 2b. Afterwards, we added fossil CH4 and barometrically controlled the mixing ratio between biogenic
and fossil CH4 in each mixture. We produced GISp and MISp with 15 % and 52 % of
biogenic CH4, respectively, and analyzed their isotopic composition using the offline 25
AMTD
5, 3499–3518, 2012Isotope reference gas for atmospheric
CH4
P. Sperlich et al.
Title Page
Abstract Introduction
Conclusions References
Tables Figures
◭ ◮
◭ ◮
Back Close
Full Screen / Esc
Printer-friendly Version Interactive Discussion
Discussion
P
a
per
|
Dis
cussion
P
a
per
|
Discussion
P
a
per
|
Discussio
n
P
a
per
|
2.4 Producing and measuring synthetic isotope reference gases GIS and MIS
The N2/O2mixture that we used for mixing the synthetic isotope reference gases
con-sisted of N2 and O2 in atmospheric mixing ratios but additionally contained 2 ppm of CH4which needed to be removed prior to blending. Therefore, the N2/O2mixture was
routed through a combustion furnace built from a 60 cm long piece of 1/2′′OD seam-5
less stainless steel tube. The central 20 cm of this tube is filled with a catalyst (SF-PH-102S-1008201, PureSphere, South Korea) and heated to 520±1◦C. Downstream of the oven, two traps in series retained H2O in the air flow. The first trap is a 1 m long,
1/4′′OD line filled with magnesium perchlorate, which is followed by a 2 m coil of 1/8′′ OD tube submerged in ethanol-dry ice (−78◦C). The furnace is efficiently removing 10
CH4from the N2/O2mixture to≤2 ppb, i.e., the detection limit of the laser
spectrome-ter (Picarro Inc, USA). The purified N2/O2 mixture is hereafter referred to as CH4-free
air (Table 1).
The produced isotope reference gases based on GISpand MISp will be referred to
as GIS and MIS, respectively. We started preparing the mixing of the synthetic iso-15
tope reference gas by transferring an aliquot of GISpor MISpto the designated aliquot volume of 280±3 µl (Fig. 2b) while measuring the pressure within this section. We used two 6 l air sample flasks (SilcoCan, Restek, USA) to mix and store the synthetic isotope reference gases. Each flask was flushed with CH4-free air and evacuated 3 times prior to the mixing to remove residual air. We first filled the evacuated target flask 20
with CH4-free air through a line bypassing the aliquot (Fig. 2b). At a pressure of 1 bar,
the CH4-free air flow was re-routed through the aliquot volume to inject the CH4 into the flask. We continued filling the flask with CH4-free air until the calculated pressure
to obtain the desired CH4 mixing ratio was reached. For MIS, the final mixing ratio
was 1800±20 ppb. The CH4mixing ratio of GIS was 1420±20 ppb. GIS exceeded the 25
CH4mixing ratio reported for the glacial atmosphere by a factor of∼4, which is due our
limitation to further dilute GISp, given by the maximum pressure of the sample flask.
AMTD
5, 3499–3518, 2012Isotope reference gas for atmospheric
CH4
P. Sperlich et al.
Title Page
Abstract Introduction
Conclusions References
Tables Figures
◭ ◮
◭ ◮
Back Close
Full Screen / Esc
Printer-friendly Version Interactive Discussion
Discussion
P
a
per
|
Dis
cussion
P
a
per
|
Discussion
P
a
per
|
Discussio
n
P
a
per
|
We used GIS and MIS to reference the δ13C-CH4 in NEEM according to the IT-principle, using a GC-IRMS setup designed for measurements of atmospheric sam-ples. In this setup, CH4 is chromatographically separated from the main air compo-nents before it is combusted to CO2 and H2O within a He carrier gas flow. The CH4
derived CO2is then analyzed forδ 13
C. All measurements are referenced to the VPDB 5
scale via the square peaks of CO2-40 339, which is injected into the IRMS via the ref-erence open split. In the following, we assume that the δ13C values of GIS and MIS are identical to those of GISpand MISpi.e., our mixing method does not cause isotopic
fractionation. The deviation between GC-IRMS measurements of GIS or MIS and the respective DI-IRMS measurements of GISp or MISp defines the system offset of the 10
GC-IRMS setup due to fractionation effects, occurring in the cryo-trapping, chromatog-raphy and online combustion steps. We correct our measurements of NEEM for this offset. In order to validate our method to produce isotope reference gases, we com-pare our final results for NEEM to theδ13C-CH4values that two external laboratories have reported for NEEM. These are the Institute of Marine and Atmospheric Research 15
in Utrecht (IMAU), University of Utrecht, The Netherlands, using the system described by Sapart et al. (2011) and the Institute for Climate and Environmental Physics (Bern), University of Bern, Switzerland. IMAU measured NEEM with −47.31±0.05 ‰ (C. J. Sapart, personal commmunication, 2011) and Bern with−47.30±0.11 ‰ (J. Schmitt, personal commmunication, 2011), respectively.
20
3 Results and discussion
All results of CH4 isotope ratios measured by DI-IRMS, laser spectroscopy and GC-IRMS, respectively, are shown in Table 2. Based on the pooled standard deviation of 13 samples (fossil and biogenic CH4, GISp and MISp) the precision of the
of-fline combustion method for pure CH4 gases is 0.04 ‰ for δ 13
C and 0.7 ‰ for δ2H. 25
AMTD
5, 3499–3518, 2012Isotope reference gas for atmospheric
CH4
P. Sperlich et al.
Title Page
Abstract Introduction
Conclusions References
Tables Figures
◭ ◮
◭ ◮
Back Close
Full Screen / Esc
Printer-friendly Version Interactive Discussion
Discussion
P
a
per
|
Dis
cussion
P
a
per
|
Discussion
P
a
per
|
Discussio
n
P
a
per
|
a larger batch of measurements which needed correction for a 4.4 ‰ instrument offset of unknown origin. We found δ13C and δ2H values of −39.56±0.04 ‰ and −170.1±0.7 ‰ in our fossil CH4and −56.37±0.04 ‰ and−317.4±0.7 ‰ in our
bio-genic CH4 in line with values reported by Quay et al. (1999) for those sources. We
mixed these CH4 gases and matched the δ13C values in the filial mixtures to glacial 5
and present atmospheric values. GISpand MISpshowδ 13
C values of−42.21±0.04 ‰ and −47.25±0.04 ‰, respectively. Resulting δ2H values for GISp and MISp are
−193.1±0.7 ‰ and−237.1±0.7 ‰, respectively. Theδ2H values do not correspond to atmospheric values. Atmospheric δ2H-CH4 is so strongly enriched in 2H due to sink fractionation Quay et al. (1999) that it cannot be realized by mixing of CH4 from 10
commonly available sources (Fig. 1). Repeated referencing of the produced isotope reference gases GIS and MIS versus CO2-40 339 in our GC-IRMS system revealed
(i) an offset of the measured versus the true value and (ii) a day to day variability of the offset. This demonstrates the importance of the IT-principle in combination with the availability of atmospheric isotope reference gases. The day to day offset we observe 15
in our GC-IRMS system has typical values of −0.3 ‰ and propagated uncertainties between 0.04 ‰ and 0.07 ‰. We repeatedly measured NEEM against GIS and MIS, applied the offset corrections and obtained−47.29±0.05 ‰ and−47.32±0.08 ‰, re-spectively. The NEEM air was also measured at IMAU and Bern, both partners in the NEEM project. We found a difference of 0.02 ‰ and −0.01 ‰ for our referencing of 20
AMTD
5, 3499–3518, 2012Isotope reference gas for atmospheric
CH4
P. Sperlich et al.
Title Page
Abstract Introduction
Conclusions References
Tables Figures
◭ ◮
◭ ◮
Back Close
Full Screen / Esc
Printer-friendly Version Interactive Discussion
Discussion
P
a
per
|
Dis
cussion
P
a
per
|
Discussion
P
a
per
|
Discussio
n
P
a
per
|
4 Conclusions
We developed a high precision method to reference theδ13C and δ2H isotopic com-position of pure CH4 samples on the VPDB or VSMOW scale, respectively. Based on the pooled standard deviation, we estimate the reproducibility of our offline combustion method to 0.04 ‰ and 0.7 ‰ forδ13C andδ2H. Referenced parental CH4 gases were 5
mixed to obtain pure CH4gases with precisely referenced isotopic composition ofδ 13
C near atmospheric values. Based on these CH4mixtures, we created synthetic isotope reference gases with atmospheric CH4 concentrations and δ
13
C-CH4 isotope values.
The synthetic reference gases allow us to detect and correct for system drifts and off -sets in our GC-IRMS setup for atmospheric samples. The effects we see demonstrate 10
the importance of our effort to produce atmospheric reference gases. We measured an air sample from a Greenland clean air site and found our results to be in excellent agreement with the results from partner laboratories. Isotope measurements become increasingly precise. Therefore it is important to establish a suite of isotope reference gases forδ13C in CH4covering the whole range of investigatedδ13C and CH4mixing 15
ratios, as was done for CH4 mixing ratios (Dlugokencky et al., 2005) and for CO2 iso-tope ratios Ghosh et al. (2005). Our method can be used to produce synthetic isoiso-tope reference gases forδ13C-CH4in air at various mixing ratios. With a heavily fractionated source gas the suite could be extended to atmospheric values ofδ2H-CH4. Further, additional components (e.g. N2O, CO2, CO) can potentially be added which would be 20
beneficial for new analytical systems which are measuring multiple components in one sample.
Acknowledgements. We would like to thank the field team that took the gas samples during the field season 2008 at NEEM. NEEM is directed and organized by the Center for Ice and Climate at the Niels Bohr Institute and US NSF, Office of Polar Programs. It is supported by funding 25
AMTD
5, 3499–3518, 2012Isotope reference gas for atmospheric
CH4
P. Sperlich et al.
Title Page
Abstract Introduction
Conclusions References
Tables Figures
◭ ◮
◭ ◮
Back Close
Full Screen / Esc
Printer-friendly Version Interactive Discussion
Discussion
P
a
per
|
Dis
cussion
P
a
per
|
Discussion
P
a
per
|
Discussio
n
P
a
per
|
like to thank J ¨org Polzer and HAASE Energietechnik AG for kindly providing the biogenic CH4 as well as Michael Bock, Barbara Seth and Jochen Schmitt for measuringδ13C-CH4in “NEEM” air. Many thanks also to Mads Dam Ellehøj, Henriette Lerche, Trevor Popp and Bo Vinther for theδ2H measurements, to Colleen Templeton and furthermore to Pantmann Labglass for Dan-ish Design glass-blowing.
5
References
Bock, M., Schmitt, J., Moller, L., Spahni, R., Blunier, T., and Fischer, H.: Hydrogen isotopes pre-clude marine hydrate CH4emissions at the onset of Dansgaard–Oeschger events, Science, 328, 1686–1689, 2010. 3501
Brand, W. A.: GAW Report No. 194, 15th WMO/IAEA Meeting of Experts on Carbon Dioxide, 10
Other Greenhouse Gases and Related Tracers Measurements Techniques, Jena, Germany, 7–10 September 2009, 2011. 3502
Brand, W. A., Coplen, T. B., Aerts-Bijma, A. T., Bohlke, J. K., Gehre, M., Geilmann, H., Gron-ing, M., Jansen, H. G., Meijer, H. A. J., Mroczkowski, S. J., Qi, H. P., Soergel, K., Stuart-Williams, H., Weise, S. M., and Werner, R. A.: Comprehensive inter-laboratory calibration of 15
reference materials forδ18O versus VSMOW using various on-line high-temperature conver-sion techniques, Rapid Commun. Mass Sp., 23, 999–1019, 2009. 3501
Coplen, T. B.: Guidelines and recommended terms for expression of stable-isotope-ratio and gas-ratio measurement results, Rapid Commun. Mass Sp., 25, 2538–2560, 2011. 3502 Dlugokencky, E. J., Myers, R. C., Lang, P. M., Masarie, K. A., Crotwell, A. M., Thoning, K. W., 20
Hall, B. D., Elkins, J. W., and Steele, L. P.: Conversion of NOAA atmospheric dry air CH4 mole fractions to a gravimetrically prepared standard scale, J. Geophys. Res.-Atmos., 110, D18306, doi:10.1029/2005JD006035, 2005. 3502, 3510
Dlugokencky, E. J., Bruhwiler, L., White, J. W. C., Emmons, L. K., Novelli, P. C., Montzka, S. A., Masarie, K. A., Lang, P. M., Crotwell, A. M., Miller, J. B., and Gatti, L. V.: Observational 25
constraints on recent increases in the atmospheric CH4 burden, Geophys. Res. Lett., 36, L18803, doi:10.1029/2009GL039780, 2009. 3501
AMTD
5, 3499–3518, 2012Isotope reference gas for atmospheric
CH4
P. Sperlich et al.
Title Page
Abstract Introduction
Conclusions References
Tables Figures
◭ ◮
◭ ◮
Back Close
Full Screen / Esc
Printer-friendly Version Interactive Discussion
Discussion
P
a
per
|
Dis
cussion
P
a
per
|
Discussion
P
a
per
|
Discussio
n
P
a
per
|
Unexpected changes to the global methane budget over the past 2000 years, Science, 309, 1714–1717, 2005. 3501
Fischer, H., Behrens, M., Bock, M., Richter, U., Schmitt, J., Loulergue, L., Chappellaz, J., Spahni, R., Blunier, T., Leuenberger, M., and Stocker, T. F.: Changing boreal methane sources and constant biomass burning during the last termination, Nature, 452, 864–867, 5
2008. 3503
Fletcher, S. E. M., Tans, P. P., Bruhwiler, L. M., Miller, J. B., and Heimann, M.: CH4 sources estimated from atmospheric observations of CH4 and its13C/12C isotopic ratios: 2. Inverse modeling of CH4 fluxes from geographical regions, Global Biogeochem. Cy., 18, GB4005, doi:10.1029/2004GB002224, 2004. 3502
10
Ghosh, P. and Brand, W. A.: The effect of N2O on the isotopic composition of air−CO2samples, Rapid Commun. Mass Sp., 18, 1830–1838, 2004. 3505
Ghosh, P., Patecki, M., Rothe, M., and Brand, W. A.: Calcite-CO2mixed into CO2-free air: a new CO2-in-air stable isotope reference material for the VPDB scale, Rapid Commun. Mass Sp., 19, 1097–1119, 2005. 3502, 3510
15
IAEA: Reference Sheet for International Measurement Standards, The International Atomic Energy Agency in cooperation with the National Institute for Science and Technology (NIST), 5 May 2009, 2009. 3503
Kapteijn, F., Rodriguez-Mirasol, J., and Moulijn, J. A.: Heterogeneous catalytic decomposition of nitrous oxide, Appl. Catal. B-Environ., 9, 25–64, 1996. 3505
20
Loulergue, L., Schilt, A., Spahni, R., Masson-Delmotte, V., Blunier, T., Lemieux, B., Barnola, J. M., Raynaud, D., Stocker, T. F., and Chappellaz, J.: Orbital and millennial-scale features of atmospheric CH4over the past 800 000 years, Nature, 453, 383–386, 2008. 3501 Merritt, D. A., Freeman, K. H., Ricci, M. P., Studley, S. A., and Hayes, J. M.: Performance and otpimization of a combustion interface for isotope ratio monitoring gas-chromatography 25
mass-spectrometry, Anal. Chem., 67, 2461–2473, 1995a. 3504, 3505
Merritt, D. A., Hayes, J. M., and Marias, D. J. D.: Carbon isotopic analysis of atmospheric methane by isotope-ratio-monitoring gas-chromatography mass-spectrometry, J. Geophys. Res.-Atmos., 100, 1317–1326, 1995b. 3501
Quay, P., Stutsman, J., Wilbur, D., Snover, A., Dlugokencky, E., and Brown, T.: The isotopic 30
AMTD
5, 3499–3518, 2012Isotope reference gas for atmospheric
CH4
P. Sperlich et al.
Title Page
Abstract Introduction
Conclusions References
Tables Figures
◭ ◮
◭ ◮
Back Close
Full Screen / Esc
Printer-friendly Version Interactive Discussion
Discussion
P
a
per
|
Dis
cussion
P
a
per
|
Discussion
P
a
per
|
Discussio
n
P
a
per
|
Rice, A. L., Gotoh, A. A., Ajie, H. O., and Tyler, S. C.: High-precision continuous-flow measure-ment ofδC-13 andδD of atmospheric CH
4, Anal. Chem., 73, 4104–4110, 2001. 3501
Sapart, C. J., van der Veen, C., Vigano, I., Brass,, M., van de Wal, R. S. W., Bock, M., Fis-cher, H., Sowers, T., Buizert, C., Sperlich, P., Blunier, T., Behrens, M., Schmitt, J., Seth, B., and R ¨ockmann, T.: Simultaneous stable isotope analysis of methane and nitrous oxide on 5
ice core samples, Atmos. Meas. Tech., 4, 2607–2618, doi:10.5194/amt-4-2607-2011, 2011. 3508
Sowers, T.: Late quaternary atmospheric CH4isotope record suggests marine clathrates are stable, Science, 311, 838–840, 2006. 3501
Tyler, S. C., Rice, A. L., and Ajie, H. O.: Stable isotope ratios in atmospheric CH4: 10
implications for seasonal sources and sinks, J. Geophys. Res.-Atmos., 112, D03303, doi:10.1029/2006JD007231, 2007. 3501
Vaughn, B., Miller, J., Ferretti, D. F., and White, J. W. C.: Stable isotope measurements of atmospheric CO2 and CH4, in: Handbook of Stable Isotope Analytical Techniques, Vol. 1, edited by: Groot, P. A., Elsevier B.V., 272–304, 2004. 3505
15
Verkouteren, R. M.: Preparation, characterization, and value assignment of carbon dioxide iso-topic reference materials: RMs 8562, 8563, and 8564, Anal. Chem., 71, 4740–4746, 1999. 3503
Werner, R. A. and Brand, W. A.: Referencing strategies and techniques in stable isotope ratio analysis, Rapid Commun. Mass Sp., 15, 501–519, 2001. 3501, 3503
AMTD
5, 3499–3518, 2012Isotope reference gas for atmospheric
CH4
P. Sperlich et al.
Title Page
Abstract Introduction
Conclusions References
Tables Figures
◭ ◮
◭ ◮
Back Close
Full Screen / Esc
Printer-friendly Version Interactive Discussion
Discussion
P
a
per
|
Dis
cussion
P
a
per
|
Discussion
P
a
per
|
Discussio
n
P
a
per
|
Table 1.Overview of gases and waters. All gases used for measuring, mixing and referencing are mentioned in the top panel, the bottom panel displays all waters that were used to refer-ence theδ2H-CH4. The application and reference path of each measure are described in the second column while the third column informs on material type and purity level if applicable. The fourth column identifies the distributor of materials or specifies the origin of the measure if not commercially purchased.
Gas name Application Gas type Origin
Fossil CH4 parental gas, CH4mixing CH4, N45 Air Liquide, Denmark
Biogenic CH4 parental gas, CH4mixing CH4 biogas plant
GISp pure CH4, glacialδ13C mixed CH4 fossil and biogenic CH4 MISp pure CH4, modernδ
13
C mixed CH4 fossil and biogenic CH4
GIS synthetic isotope reference gas, glacialδ13C CH4in air GISpwith CH4free air MIS synthetic isotope reference gas, modernδ13C CH4in air MISpwith CH4free air NEEM sample, referenced with GIS and MIS atmospheric air NEEM camp, Greenland RM 8563 international measurement standard CO2 IAEA
CO2-40 339 isotope reference gas, RM 8563 CO2, N48 Air Liquide, Denmark CH4-free air matrix air for gas mixing N2/O2, labline 5.0 Strandmøllen, Denmark
O2 oxidation combustion ractor O2, Alphagaz 1 Air Liquide, Denmark Water name Application, reference path Type Origin
DC′
02 isotope reference material, VSMOW-2, SLAP-2 H2O Dome C, Antarctica NM′
09 isotope reference material, VSMOW-2, SLAP-2 H2O NEEM camp, Greenland −15 isotope reference material, VSMOW-2, SLAP-2 H2O internally produced VSMOW-2 international measurement standard H2O IAEA
AMTD
5, 3499–3518, 2012Isotope reference gas for atmospheric
CH4
P. Sperlich et al.
Title Page
Abstract Introduction
Conclusions References
Tables Figures
◭ ◮
◭ ◮
Back Close
Full Screen / Esc
Printer-friendly Version Interactive Discussion
Discussion
P
a
per
|
Dis
cussion
P
a
per
|
Discussion
P
a
per
|
Discussio
n
P
a
per
|
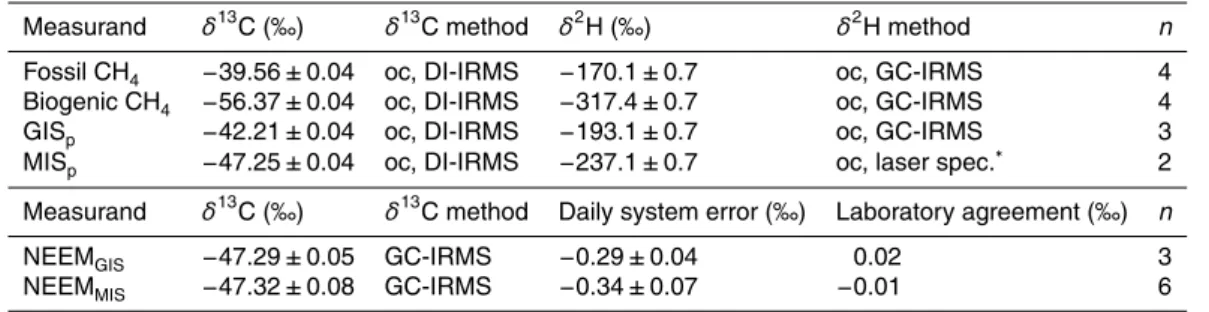
Table 2.Meanδ13C andδ2H isotope values of pure CH
4gases (top panel) and of NEEM,
mea-sured with the produced isotope reference gases (bottom panel). The calculations of the un-certainties are explained in Sect. 3 and are based on n repetitive measurements. “oc” denotes the offline combustion method, DI-IRMS refers to Dual Inlet IRMS and laser spec. indicates δ2H measurements by laser spectroscopy. The∗
indicates theδ2H measurements that needed correction for a 4.4 ‰ system offset (Sect. 3). The indices GIS and MIS indicate the applied isotope reference gas for the measurement of NEEM. The laboratory agreement shows the dif-ference between the referencing of NEEM with our GC-IRMS setup and our produced isotope reference gases compared to the mean value of the two external laboratories. Our GC-IRMS system can currently not measureδ2H-CH
4.
Measurand δ13C (‰) δ13C method δ2H (‰) δ2H method n
Fossil CH4 −39.56±0.04 oc, DI-IRMS −170.1±0.7 oc, GC-IRMS 4
Biogenic CH4 −56.37±0.04 oc, DI-IRMS −317.4±0.7 oc, GC-IRMS 4
GISp −42.21±0.04 oc, DI-IRMS −193.1±0.7 oc, GC-IRMS 3
MISp −47.25±0.04 oc, DI-IRMS −237.1±0.7 oc, laser spec.
∗
2
Measurand δ13C (‰) δ13C method Daily system error (‰) Laboratory agreement (‰) n
NEEMGIS −47.29±0.05 GC-IRMS −0.29±0.04 0.02 3
AMTD
5, 3499–3518, 2012Isotope reference gas for atmospheric
CH4
P. Sperlich et al.
Title Page
Abstract Introduction
Conclusions References
Tables Figures
◭ ◮
◭ ◮
Back Close
Full Screen / Esc
Printer-friendly Version Interactive Discussion
Discussion
P
a
per
|
Dis
cussion
P
a
per
|
Discussion
P
a
per
|
Discussio
n
P
a
per
|
Fig. 1. Dual isotope signatures of CH4 for δ13C and δ2H. Grey diamonds mark the field of δ13C andδ2H isotopes of CH
4according to its source (Quay et al., 1999). Blue circles indicate
δ13C andδ2H pairs of the parental CH
4gases (fossil and biogenic CH4). Based on our fossil
AMTD
5, 3499–3518, 2012Isotope reference gas for atmospheric
CH4
P. Sperlich et al.
Title Page
Abstract Introduction
Conclusions References
Tables Figures
◭ ◮
◭ ◮
Back Close
Full Screen / Esc
Printer-friendly Version Interactive Discussion
Discussion
P
a
per
|
Dis
cussion
P
a
per
|
Discussion
P
a
per
|
Discussio
n
P
a
per
|
Fig. 3.Assessment of the completeness of the combustion of pure CH4gases.(A): shown are three scans of mass abundances, resulting from fossil CH4(green line), CO2-40 339 (blue filled line) and CH4derived CO2(black line). Both CH4and CO2fractionate in the source, but a signal on mass to charge ratiom/z 15 can only result from CH4, while only CO2produces a signal on
m/z 44. The ratio ofm/z 15 over m/z 44 can therefore be used to quantify the abundance of CH4in a CO2gas.(B): normalizedδ13C-CH
4offsets with varying completeness of combustion.
CO2from completely combusted CH4gas shows ratios ofm/z15 overm/z44 of≤0.0002 (blue circles), indicating absence of CH4. Incomplete CH4combustion produces offsets in normalized
δ13C-CH
4(blue crosses). Complete combustion is reached after 25 cryo-transfers whenm/z15
overm/z44 in the CH4derived CO2is≤0.0002 and theδ13C-CH