www.adv-geosci.net/14/251/2008/ © Author(s) 2008. This work is licensed under a Creative Commons License.
Geosciences
Extreme precipitation events in the Czech Republic in the context of
climate change
V. Kvˇeto ˇn1and M. ˇZ´ak1,2
1Czech Hydrometeorological Institute, Prague, Czech Republic
2Department of Meteorology and Environment Protection, Fakulty of Mathematics and Physics, Charles University, Prague, Czech Republic
Received: 14 May 2007 – Revised: 27 December 2007 – Accepted: 28 December 2007 – Published: 10 April 2008
Abstract. As an introduction, short survey of two analyses
of long-term fluctuations of annual precipitation totals in the Czech Republic is presented. The main focus of this paper is to contribute to investigation of precipitation trends in the Czech Republic by another point of view. For every pixel of 1 km2 size, annual maxima of daily precipitation were obtained for time period of 112 years (1895–2006). Based on these time series, we were trying to answer question if there are some changes of area size/distribution of annual maximum of daily precipitation totals. Courses and trends are analyzed for some parameters of area distribution of an-nual maximum of daily precipitation totals in the area of the Czech Republic. No significant climate changes of tested precipitation characteristics were found.
1 Introduction
Long-term precipitation changes in the Czech Republic are illustrated by the example of annual series from the Prague, Klementinum (Fig. 1) and Brno (Fig. 2) secular stations, which were presented in Climate Atlas of Czechia (2007). While in the case of the Prague, Klementinum series, orig-inal measurements were used (including possible inhomo-geneities), for Brno, a homogenized series of measurements performed in various parts of the city, completed by the miss-ing data for the years 1838–1847 (Auer et al., 2005), was analyzed. The series of the annual precipitation totals from both stations do not show any strong long-term tendencies, confirming the fact that they do not include any statistically significant linear trends (Climate Atlas of Czechia, 2007). Decreasing or increasing tendencies in precipitation are thus only apparent within shorter periods of time. The long-term variation indicates that precipitation fluctuations have Correspondence to:M. ˇZ´ak
a cyclic character. Regarding Brno station, the reference pe-riod 1961–2000 appears drier in comparison with previous periods. This is particularly evident in the case of the annual totals, where a period of lower precipitation only occurred in the 1930s and during the years 1855–1875. The second dry period can be quite clearly seen in the Prague series; it is as-sociated with a decrease in summer precipitation as well as a decrease in spring and autumn totals. Summer precipitation has the strongest impact on the character of annual precipi-tation fluctuations, while autumn has the lowest correlation with the fluctuations in the annual precipitation totals (Cli-mate Atlas of Czechia, 2007).
The annual and seasonal trends of precipitation for north-east subregion of the so called Greater Alpine Region were analysed by Auer et al. (2007). This subregion contains his-torical data from two stations in the Czech Republic, too (Brno, T´abor). Trends for different periods of 1800–2000 are presented in Table 1. There are only small significant changes for some periods of the last 200 years. Focussing on the time period 1975–2000, relatively large increase (more than 11% of 1901–2000 average total) of autumn precipita-tion can be detected in this region.
The main focus of this paper is given to the question if there are statistically significant time changes of frequency distribution of area occurrence of annual maxima of daily precipitation, especially:
– Are there any changes of the range within it annual max-imum of daily precipitation total occurs on the given size of area of the Czech Republic?
– Are there any changes of annual maxima of daily pre-cipitation total which is not exceeded on the given size of area of the Czech Republic?
Fig. 1. Long-term fluctuations in the annual precipitation totals at the Praha, Klementinum station, expressed as deviations from the average value for the period 1961–2000. Smoothed by Gaussian filter for 10 years.
Fig. 2. Long-term fluctuations in the annual precipitation totals at
the Brno station, expressed as deviations from the average value for the period 1961–2000. Smoothed by Gaussian filter for 10 years.
2 Data and methods
Precipitation measurements of the most of stations have more or less breaks and inhomogeneities of different ori-gin. Time series homogeneity is essential when studying climatic changes over time. Different methods are used to this (WMO, 2004; Szentimrey, 1996, 1999, 2003; Kvˇetoˇn and ˇZ´ak, 2004). On the other hand, it should be noted that homogenization necessarily contains subjective features and contemporary homogenization methods deal with an-nual, seasonal and monthly data (WMO, 2004). Homoge-nization of time series of extreme events and filling of gaps by estimated values seems to be very questionable. This problem is extraordinary large when studying trends of ex-treme precipitations measured on single station. From this reason, only careful measurement data checking (both local and spatial revision) was made with respect to the aim of this paper. Method used for data pre-processing and analysis is supposed to decrease importance of inhomogeneities prob-lems.
For this paper, precipitation data from all stations in the area of the Czech Republic without gap in observation in ev-ery given year were used from period 1895–2006. The count of stations differs year-to-year (Fig. 3) and different stations have also different number of years with observation (Fig. 4). For every year, annual maxima of daily precipitation totals were interpolated from available precipitation stations in the whole area of the Czech Republic in Geographic information system (GIS). This way of method means, that space inter-polation was often made between stations or data
originat-0 200 400 600 800 1000 1200
18
95
19
00
19
05
19
10
19
15
19
20
19
25
19
30
19
35
19
40
19
45
19
50
19
55
19
60
19
65
19
70
19
75
19
80
19
85
19
90
19
95
20
00
20
05
Year
C
o
u
n
t o
f st
at
io
n
s
Fig. 3.Count of stations used for analysis for period 1895–2006.
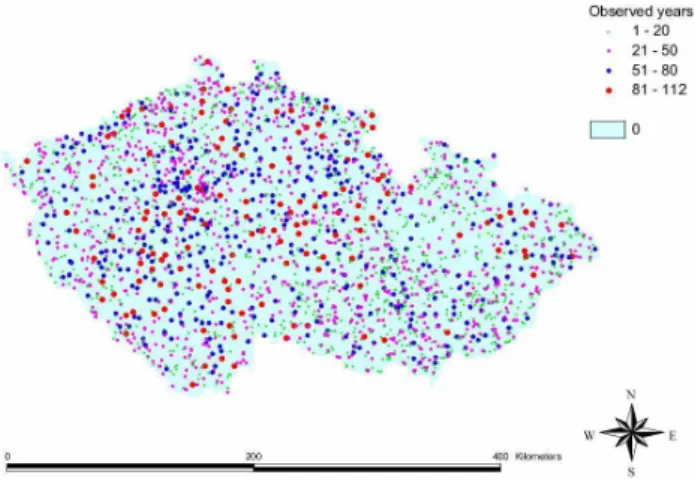
Fig. 4. Position of used stations with color-indicated number of
observed years.
ing from different precipitation episodes (different regional rains, local thunderstorm rains) ( ˇSercl et al., 2004, Faulkner, 1999). The orographic interpolation by Kvˇetoˇn et al. (2000) was used. Squares (pixels) of 1-km size were distinguished.
By this method, time series were created for every 1-km pixel (square) of the Czech Republic from grids. Resulted 78961 time series (period 1895–2006, i.e. 112 years) of the annual maxima of daily precipitation totals were used for fur-ther analyses. For precipitation data, it can be supposed that they have log-normal distribution. Histogram of logarithmic transformed data is presented on Fig. 5.
From annual maxima of precipitation totals that have been given in irregular spacing, regular grids have been gained by interpolation. From these grids percentile values over a re-gion have been computed for every year. Note, that interpre-tation of percentile is that precipiinterpre-tation less or equal toP−th
Table 1.Long-term annual and seasonal precipitation trends in the north-east subregion of the Greater Alpine Region in two 100-year, four 50-year and two (recent) 25-year subperiods (Auer I. et al., 2007). Trends are in % per decade and bold figures mark 90% significance according to Mann-Kendall trend test.
Period Annual precipitation Seasonal precipitation (% of 1901–2000) (% of 1901-2000)
Spring Summer Autumn Winter
1800–1900 −0.6 1.1 −0.6 −1.8 −1.9
1900–2000 −0.8 −0.9 −0.2 −1.2 −1.1
1800–1850 −1.7 −2.4 −0.4 −3.1 −4.2
1850–1900 2.7 4.8 2.0 2.0 3.2
1900–1950 −1.0 −3.4 −0.6 −0.5 1.3
1950–2000 −0.6 0.8 −2.1 1.8 −2.8
1950–1975 −2.0 1.1 3.4 −6.6 −9.0
1975–2000 3.3 4.4 1.5 11.1 −8.7
Fig. 5. Histogram of annual maxima of daily totals for the whole
area of the Czech Republic from 1895–2006 – after logarithmic transformation. Normal curve is given, too.
(area of 1 km2), annual maximum of daily precipitation total was 23 mm, in half size of area of the Czech Republic it was no more than 55 mm and on 1 pixel it was 317 mm. Note, the area with precipitation less or equal to given threshold may not be continuous.
Time series were constructed for selected percentiles as well as for differences between selected percentiles. Time changes of these series were analyzed by linear and cubic regression (in SPSS software, logarithmic transformation of time series was used).
3 Results
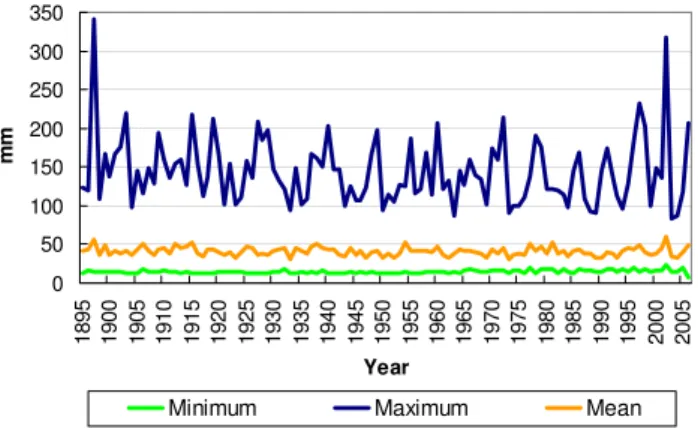
Values of area minimum, maximum and arithmetic mean of highest annual daily precipitation total in the Czech Republic in 1895–2006 are depicted in Fig. 7.
0 50 100 150 200 250 300 350
0 4 8 12 16 20 24 2832 36 40 44 48 52 56 60 64 68 72 76 80 8488 92 96 100
% of Czech Republic area
mm
x
Fig. 6. Values not exceeded by annual maximum of daily
precipi-tation totals depending on proportional size of affected part of CR area in year 2002.
0 50 100 150 200 250 300 350
1895 1900 1905 1910 1915 1920 1925 1930 1935 1940 1945 1950 1955 1960 1965 1970 1975 1980 1985 1990 1995 2000 2005
Year
mm
Minimum Maximum Mean
Fig. 7. Minimum, maximum and area arithmetic mean of highest
annual daily precipitation total in the Czech Republic (1895–2006).
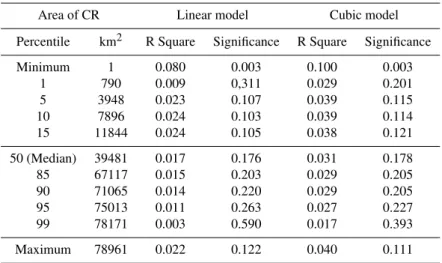
Table 2.Model summary of regression analysis of time variation of values not exceeded by annual maximum of daily precipitation totals (ln transformation) for selected sizes of CR.
Area of CR Linear model Cubic model
Percentile km2 R Square Significance R Square Significance
Minimum 1 0.080 0.003 0.100 0.003
1 790 0.009 0,311 0.029 0.201
5 3948 0.023 0.107 0.039 0.115
10 7896 0.024 0.103 0.039 0.114
15 11844 0.024 0.105 0.038 0.121
50 (Median) 39481 0.017 0.176 0.031 0.178
85 67117 0.015 0.203 0.029 0.205
90 71065 0.014 0.220 0.029 0.205
95 75013 0.011 0.263 0.027 0.227
99 78171 0.003 0.590 0.017 0.393
Maximum 78961 0.022 0.122 0.040 0.111
Table 3.Model summary of regression analysis of time variation of boundaries in which vary annual maximums of daily precipitation totals
(ln transformation) in given size of area of CR.
Area of CR Linear model Cubic model
Inter-percentile distance % km2 R Square Significance R Square Significance
P99 01 98 77381 0.000 0.936 0.002 0.914
P95 05 90 71065 0.000 0.903 0.002 0.910
P90 10 80 63169 0.000 0.939 0.002 0.920
P75 25 50 39481 0.001 0.719 0.003 0.865
P60 40 20 15792 0.005 0.445 0.008 0.634
0 20 40 60 80 100 120 140 160 180 18 95 19 00 19 05 19 10 19 15 19 20 19 25 19 30 19 35 19 40 19 45 19 50 19 55 19 60 19 65 19 70 19 75 19 80 19 85 19 90 19 95 20 00 20 05 Year mm
P99 P95 P05 P01
Fig. 8. Long-term fluctuations of values not exceeded by annual
maximum of daily precipitation totals for 1, 5, 95 and 99%-part of area of CR. Period 1895–2006.
Main results of trend analysis are presented in Tables 2 and 3. These tables contain model summaries of regression anal-yses of time variation of values not exceeded by annual maxi-mum of daily precipitation totals for selected sizes of CR (Ta-ble 2) and of time variation of boundaries (as inter-percentile
0 20 40 60 80 100 120 140 160 189 5 190 0 190 5 191 0 191 5 192 0 192 5 193 0 193 5 194 0 194 5 195 0 195 5 196 0 196 5 197 0 197 5 198 0 198 5 199 0 199 5 200 0 200 5 Year mm P99_P01 P95_P05 P90_P10 P75_P25
Fig. 9. Long-term fluctuations of values not exceeded by annual
maximum of daily precipitation totals for 98, 90, 80 and 50%-part of area of CR. (labeled as P99 P01, P95 P05 P90 P10 and P75 P25). Period 1895–006.
Significant changes (p<0.05) were found for 1-km2area only. In the other cases significant changes of values less or equal to given threshold in tested size of area of CR were not found.
4 Conclusions
There is no significant trend of change of area distribution of annual maximum of daily precipitation totals in the Czech Republic, excluding area minimum, that has significant ris-ing linear trend (p<0.05). The area minimum, i.e. the lowest annual maximum of daily precipitation total in the CR repre-sents size of 1 km2of the CR (it doesn’t need to be the same pixel in different years), only. Such small area representative time series are very sensitive with regard to homogeneity of data and results based on them have no real importance for climate change studies. Additionally, occurrence of local ex-treme event with very long return period strongly influences validity of results of climate changes analysis in point (small area size) data.
These results by our opinion correspond with results men-tioned in the introduction part of this paper and also with the last conclusions of the IPCC, which suppose less precipita-tion in low latitudes and higher precipitaions in high latitudes (e.g. Pretel, 2007). As for average annual and seasonal pre-cipitation totals in the last 200 years in the Czech Republic there are no clear significant changes. For the NE part of the Greater Alpine Region there are also only small significant changes in the last 200 years. Focussing on the time period 1975–2000, smaller increase of autumn precipitation can be detected in this region.
Acknowledgements. This work was supported by Research Plan
No. MSM0021620860.
Edited by: P. Lagos
Reviewed by: J. Kalvova and J. Pretel
References
Auer, I., B¨ohm, R., Jurkovi, A., et al.: A new instrumental precipi-tation dataset for the greater Alpine region for the period 1800– 2002, Int. J. Climatol., 25, 139–166, 2005.
Auer I., B¨ohm, R., Jurkovic, A., et al.: HISTALP – historical instru-mental climatological surface time series of the Greater Alpine Region, Int. J. Climatol., 27, 17–46, 2007.
Climate Atlas of Czechia, 1. issue, Czech Hydrometeorological In-stitute Prague and University of Palack´y Olomouc, 2007. Faulkner, D.: Flood estimation handbook, Volume 2, Rainfall
fre-quency estimation, Institute of hydrology, Wallingford, 1999. Kvˇetoˇn, V., Rett, T., and Ryb´ak, M.: Experiences with GIS
applica-tions to Climate Datasets in the Czech Hydrometeorological In-stitute, in: Proc. 2th ECAC – Extended abstracts, Pisa, CD-Rom, 2000.
Kvˇetoˇn, V. and ˇZ´ak, M.: Experience regarding homogenisation of temperature time series in the Czech Republic for period 1961– 2000, Fourth seminar for homogenization and quality control in climatological databases, Budapest 2003, WMO, WCDMP-No. 56, 135–142, 2004.
Pretel, J.: Climate change 2007: New IPCC Assessment Report the Physical Science Basis, Meteorological Bulletin, 60, 33–36, 2007 (in Czech).
Szentimrey, T.: Statistical procedure for joint homogenisation of climatic time series, in: Proceedings of the First seminar of ho-mogenisation of surface climatological data, Budapest, Hungary, 6–12 October 1996, 47–62, 1996.
Szentimrey, T.: Multiple Analysis of Series for Homogenisation (MASH), in: Proceedings of the Second seminar of homogeni-sation of Surface climatological data, Budapest, Hungary, WM., WCDMP-No. 41, 27–46, 1999.
Szentimrey, T.: Something like an Introduction, Fourth Semi-nar for Homogenisation and Quality Control in Climatological Databases, Budapest, Hungary, 2003.
ˇSercl, P., Kvˇetoˇn, V., and Stehl´ık, M.: Verification of methods of deriving of hydrological bases for safety officiating of wa-ter reservoirs during floods, Final report of project No. QD1368 for 2001–2003 – part V01, Czech Hydrometeorological Institute Prague, 2004 (in Czech).