www.humantechnology.jyu.fi Volume 6 (2), November 2010, 155–190
155
I
SI
TR
EALLYG
ENDER?
A
NE
MPIRICALI
NVESTIGATION INTOG
ENDERE
FFECTS INT
ECHNOLOGYA
DOPTIONT
HROUGH THEE
XAMINATION OFI
NDIVIDUALD
IFFERENCESAbstract:A recent development in the technology acceptance literature is the inclusion of gender as a moderator of the relationships between intention and its antecedents, such that some are stronger for men than women, and vice versa. While the effects have been well established, the mechanisms by which they operate, that is, which specific gender differences are in operation and how they affect intention to adopt, have not been thoroughly explored. In this research, psychological constructs with established gender differences, such as core self-evaluations, computer self-efficacy and anxiety, psychological gender-role, and risk-taking propensity, are examined. In addition, this research introduces a novel context for the study of technology adoption in that more than a single alternative is offered to participants, thus requiring a choice among technologies. Results indicate that gender effects are more complex than previously thought, with potentially multiple influences from different facets operating simultaneously.
Keywords:technology acceptance, UTAUT, gender, choice.
INTRODUCTION
Technology acceptance has been one of the most researched streams in the information systems literature. Since the introduction of the technology acceptance model (TAM; Davis, 1989), numerous studies have explored and expanded this theory (Agarwal & Karahanna, 2000; Gefen, Karahanna, & Straub, 2003; Koufaris, 2002). A recent study has proposed a theory of technology acceptance, the unified theory of acceptance and usage of technology (UTAUT), that explains a large proportion of variance in intention to use new technologies (Venkatesh, Morris, Davis, & Davis, 2003). It has been pointed out that, given the significantly high variance explained by UTAUT—unusual for the behavioral sciences— further work should aim at testing the boundary conditions of the model and expanding its real world applicability. That is the objective of the research described here.
© 2010 Miguel I. Aguierre-Urreta and George M. Marakas, and the Agora Center, University of Jyväskylä DOI: http://dx.doi.org/10.17011/ht/urn.201011173090
Miguel I. Aguirre-Urreta
School of Accountancy and MIS College of Commerce
DePaul University USA
George M. Marakas
School of Business University of Kansas
A topic of relatively recent emergence in technology acceptance research is the moderating influence of gender. Building on previous work (Venkatesh & Morris, 2000; Venkatesh, Morris, & Ackerman, 2000), UTAUT presents a moderating effect of gender in the relationships between performance expectancy and behavioral intention, such that it becomes stronger for men; and effort expectancy and behavioral intention, such that it is more significant for women (Venkatesh et al., 2003). Gender differences are useful in that they can propel research into an area by putting in evidence the existence of an underlying dynamic (Halpern, 1992).
One proposition drawn from the observed gender differences is that sensitivity to these differences could have significant impact on technology training and marketing, emphasizing the factors that are more salient to each group (Venkatesh et al., 2000). However, without more precise knowledge of the mechanisms by which these differences between men and women operate, the design and development of such programs is greatly hampered. A somewhat contradictory conclusion is the interpretation that such differences might be temporary and tend to disappear as a young cohort of employees are raised and educated in a technological environment (Venkatesh et al., 2003). Additionally, the usage of gender as a moderator can lead to equivocal results (Ndubisi, 2003). Overall, we need a better understanding of this issue before we can apply our knowledge to actual technology adoption settings. Simply knowing of a gender effect does not allow us to make use of this knowledge. The need to uncover the underlying mechanisms by which these gender differences arise has already been made explicit (Venkatesh et al., 2003). This study proposes and explores a set of variables to account for the observed gender effect that may further our understanding in this area. These constructs were selected as candidates for explaining observed gender effects because (a) these known differences have been exhibited by men and women, (b) these constructs are grounded in previous research, and (c) they could plausibly explain the relationships empirically observed. This study is thus concerned with answering the following research question: What are the underlying factors driving observed gender differences in the context of technology acceptance?
We tested these relationships in a novel context, one involving a choice between competing technologies. With but one known exception, TAM research has been conducted using different technologies in the same product category (Davis, 1989; Mathieson, 1991; Venkatesh & Davis, 1996), later evolving into non-comparable technologies (Venkatesh & Davis, 1996), and then just to single technology considerations (Venkatesh & Davis, 2000), where the decision was a binary choice between adopting the proposed technology or adopting no technology (a notable exception is Szajna, 1994). We believe that, while productive in the development of our understanding of the model and its elemental constructs, such scenarios are not representative of real-world technology adoption exercises. In such cases, it is rare that a decision to adopt a given technology is made without comparison to members of a refined choice set or without a mandate to actually choose one of the alternatives for adoption (absent any material weaknesses associated with the members of the final choice set). In other words, simply choosing to accept or reject a single technology in a vacuum is not representative of the conditions under which technologies are evaluated and adopted in an organizational setting.
157
practice, and introduces a refinement and measurable extension to the most accepted and researched model of technology acceptance in the information systems literature.
The next two sections review the current state of research in this area and the development of the hypotheses that define this study. Research design and variable operationalization are presented next. Finally, results and implications for future research are discussed.
THEORETICAL BACKGROUND
Technology Acceptance Research
The TAM, as originally proposed by Davis (1989), was a derivation of the theory of reasoned action (TRA; Fishbein & Ajzen, 1975) that was tailored to the domain of acceptance of information systems. TAM proposes that two beliefs—perceived usefulness and perceived ease of use—are the primary determinants of acceptance behavior, and that the two constructs mediate any other external variables. Following from TRA, TAM postulates that behavioral intention is the main determinant of usage, in turn driven jointly by attitude toward using and perceived usefulness (Davis, Bagozzi, & Warshaw, 1989). Departing from TRA, TAM did not include subjective norm as a determinant of behavioral intention; this construct, however, was added at a later time in an extension to the model (Venkatesh & Davis, 2000).
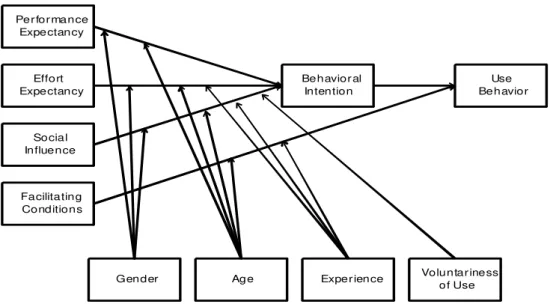
The appearance of other models attempting to explain technology acceptance, based on motivation, diffusion, and social cognitive theories, led to the formulation of UTAUT (Venkatesh et al., 2003; see Figure 1). The UTAUT postulates that three constructs, performance expectancy, effort expectancy, and social influence, will drive behavioral intention, which serves as an antecedent to use behavior, together with facilitating conditions. While proposed as an encompassing theory of eight competing models, a closer look at UTAUT reveals that TAM is still at the core of the model, with the four moderator variables having been identified in previous TAM research: experience and voluntariness (Venkatesh & Davis, 2000), age (Venkatesh & Morris, 2000) and gender (Venkatesh & Morris, 2000; Venkatesh et al., 2000). Additionally, the two TAM constructs, perceived usefulness and perceived ease of use, form the root components of performance and effort expectancy, respectively.
Past research in technology acceptance has used gender to mean the biological sex of the participants in the study (i.e., men or women). In other areas of research, gender takes on a psychological or socially-constructed meaning. In order to be consistent throughout our discussion, we use gender or sex to refer to the biological sex of individuals, thus keeping the usage from prior information systems studies, and qualify other uses of the term where required (e.g., psychological gender-role when discussing gender as an individual’s own construction of femininity or masculinity).
Per for mance Expectancy
Effort Expectancy
Social Influence
Facilitating Conditions
Behavior al Intention
Use Behavior
Gender Age Exper ience Voluntar iness
of Use
Figure 1. Unified theory of acceptance and usage of technology.
(Figure 3 from V. Venkatesh, M. G. Morris, G. B. Davis, and F. D. Davis, ―User Acceptance of Information Technology: Toward a Unified View,‖ MIS Quarterly (27:3), 2003, p. 447.
Copyright © 2003, Regents of the University of Minnesota. Reprinted by permission)
Gender Differences
Research on gender differences has received the most extensive focus in the personality and social psychology literatures, as well as in the disciplines specializing in these subjects. Comparisons have been conducted in a variety of domains, including verbal and spatial cognitive skills, personality traits and dispositions, and social behaviors (Deaux, 1984, 1985). Theories as to the origin of these differences are grouped into two categories. The biological theories propose that sex-related differences arise from innate temperamental differences, evolved by natural selection (Costa, Terracciano, & McCrae, 2001). Research in studying heritability in twins and correlations with hormonal-chemical substances or physiological measures has suggested there is a strong biological basis underlying differences in personality traits (Feingold, 1994).
An alternative group of theories propose that gender differences arise from social and cultural factors affecting the way each sex develops through socialization. There are three variants of this proposition. The social role model developed by Eagly (Eagly & Wood, 1991) posits that gender differences in behavior arise from gender roles, which dictate appropriate behaviors for men and women. The expectancy model contends that social and cultural factors evolve in gender stereotypes that are reinforced because holders of these beliefs treat others in ways that result in one’s conforming to the prejudices of the perceivers (Costa et al., 2001). Lastly, the artifact model proposes that sociocultural factors result in men and women holding different values about the importance of possessing various traits and that these differences bias self-reports of characteristics (Feingold, 1994).
159
in countries with more progressive sex role ideologies (e.g., Western, individualistic countries). This finding goes counter to arguments from the social role model, whereas one would expect that these cultures would reflect smaller gender differences. It also goes against evolutionary explanations, since these would posit gender differences to be rather uniform within the human species, and not be influenced by particular cultures. Schmitt, Realo, Voracek, and Allik (2008) report a similar finding (see also McCrae & Terracciano, 2005), which counters the sex roles and evolutionary explanations. The authors, however, propose a novel rationale for these findings: More developed societies placed few constraints on human development and basic needs, thus providing more room for basic tendencies within individuals to flourish and diverge, whereas societies in which the lack of good health care, economic hardship, and limited access to education are prevalent, development of an individual’s inherent personality is more constrained.
Given the above and varied characterizations of gender differences, it seems reasonable to assume that gender differences presenting themselves as a result of a dichotomous, biological representation of the construct fall short of explaining the underlying causal effects creating such differences. If we are to operationalize our understanding of technology acceptance, we need to understand the previously identified gender effects beyond simplistic biological assignment. We do this through the identification of a number of psychological constructs known to exhibit gender differences, and investigate whether those differences may be responsible for the observed gender effect in the technology acceptance literature.
RESEARCH MODEL AND HYPOTHESES DEVELOPMENT
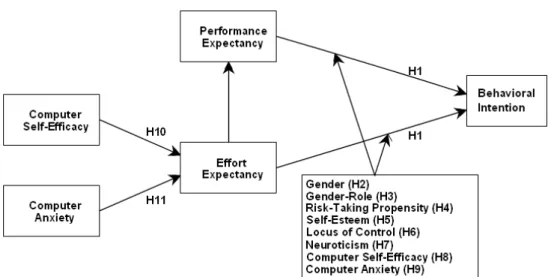
Figure 2 provides a graphical representation of the research model employed to answer the research question posed above. We conceptualize this model in three distinct parts. The basic acceptance model is depicted along with a number of moderating factors as alternative conceptualizations to the previously observed gender effects derived from the gender literature. In testing multiple moderating effects, this research follows the strategy employed by McKeen, Guimaraes, and Wetherbe (1994) of individually testing the effects of each proposed variable. Finally, past research on antecedents to effort expectancy is replicated for validation purposes.
UTAUT Model
Figure 2. Research model for this study.
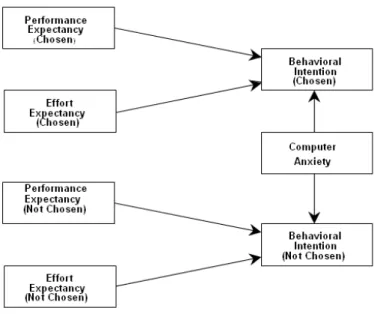
It should also be noted that these determinants of intention include three different constructs: Performance expectancy (defined as the degree to which the potential adopter believes using the focal technology will help her1 increase job performance), effort expectancy (defined as the degree of ease associated with using the system), and social influence (the degree to which the individual perceives that important others believe she should use the technology). In the research model shown in Figure 2, however, only performance and effort expectancy are depicted as determinants of intention. While social influence is certainly an important determinant of intentions, we believe that the hypothetical setting in which the research was conducted limited the ability of participants to form realistic expectations about what important others would believe they should do. As a result, social influence is not included in the research model examined here. This issue is further discussed in the section dealing with the limitations to this research.
In addition to its focal research question, this study will provide a replication of the relevant portion of the UTAUT as a manipulation check. Thus, the following hypotheses will be tested:
H1(a): Performance expectancy will be a significant predictor of behavioral intention, such that increases in the former will result in increases in the latter. H1(b): Effort expectancy will be a significant predictor of behavioral intention, such that increases in the former will result in increases in the latter.
H2(a): The relationship between performance expectancy and behavioral intention will be moderated by gender.
H2(b): The relationship between effort expectancy and behavioral intention will be moderated by gender.
Psychological Gender Role
161
examined the role of psychological gender in technology acceptance and usage, employing the theory of planned behavior (Ajzen, 1991) as the underlying framework and found masculine individuals were significantly influenced only by attitude, while the opposite was the case for feminine subjects (only subjective norm and perceived behavioral control were significant predictors of behavioral intention). These results, while difficult to map in a one-to-one correspondence with those of Venkatesh et al. (2003), certainly parallel them and provide support for the role of psychological gender as a moderator of the relationships of interest. Thus, to further increase the validity of this research, the following is hypothesized:
H3(a): The relationship between performance expectancy and behavioral intention will be moderated by psychological gender-role.
H3(b): The relationship between effort expectancy and behavioral intention will be moderated by psychological gender-role.
Risk-Taking Propensity
Another demonstrated difference between men and women found in the literature is in their attitude toward risk. A meta-analytic review of studies regarding gender and risk taking found that the majority of reviewed research supported the idea of greater risk taking on the part of males. In particular, risk propensity is defined as an individual’s tendency to take or avoid risks, and is conceptualized as a trait that can potentially change over time (Sitkin & Weingart, 1995). Potential explanations for this occurrence include overconfidence on the part of men and double standards of parental monitoring that place more restrictions on girls than on boys (Byrnes, Miller, & Schafer, 1999). Research concerning financial risk taking shows systematic risk-averse behavior by women, even when accounting for changes in total wealth (Jianakoplos & Bernasek, 1998). A study on decision making in a laboratory setting found women to be less risk seeking than men, with men choosing the risky option across other within-subjects differences (Lauriola & Levin, 2001). This study proposes that the decision to adopt an information system presents characteristics similar to those existing in the reviewed literature regarding uncertainty of outcome and consequences. The following hypotheses are thus put forward:
H4(a): The relationship between performance expectancy and behavioral intention will be moderated by risk-taking propensity.
H4(b): The relationship between effort expectancy and behavioral intention will be moderated by risk-taking propensity.
Personality Traits
agreeableness, warmth, and openness to feelings, whereas men were higher in assertiveness and openness to ideas. In another large data collection effort, Schmitt et al. (2008) obtained data from 55 nations (N = 17,637) and found women to report higher levels of neuroticism, extraversion, agreeableness, and conscientiousness than did men. More recently, analysis of a very large, cross-cultural dataset (N > 200,000) confirmed those results (Lippa, 2010).
While the number of personality traits researched in the past is significant, two distinct models have emerged, each presenting a core set of traits that can be used to subsume differences in personality. The first one is the Big Five—neuroticism, extraversion, openness, agreeableness, and conscientiousness (Langston & Sykes, 1997). An alternative categorization, the Core Self-Evaluations, proposes self-esteem, generalized self-efficacy, locus of control, and emotional stability as determinants of an individual’s perspective of oneself and her relationship with her environment (Judge, Locke, Durham, & Kluger, 1998). Judge and colleagues defined the individual evaluations as follows: Self-esteem is the basic appraisal people make of themselves, locus of control concerns the degree to which individuals believe that they control events in their lives (as compared to the environment or fate), and neuroticism as constituting the negative pole of esteem. Generalized self-efficacy, instantiated here within the computer domain, can be defined as ―an individual’s perception of efficacy in performing specific computer-related tasks within the domain of general computing‖ (Johnson, Marakas, & Palmer, 2006; Marakas, Yi, & Johnson, 1998).
All components of the core self-evaluation set have been shown to present significant differences when evaluated in men and women (Feingold, 1994; Johnson et al., 2006; Marakas et al., 1998). This perspective is the one adopted for the purpose of this research. Although considered a member of the core self-evaluations constructs, hypothesis development for computer self-efficacy will be presented in the next section, when discussing its relationship to user acceptance and computer anxiety. Consistent with prior research, it is here proposed that core self-evaluations will be related to the main relationships under study, and thus the following hypotheses are presented:
H5(a): The relationship between performance expectancy and behavioral intention will be moderated by self-esteem.
H5(b): The relationship between effort expectancy and behavioral intention will be moderated by self-esteem.
H6(a): The relationship between performance expectancy and behavioral intention will be moderated by locus of control.
H6(b): The relationship between effort expectancy and behavioral intention will be moderated by locus of control.
H7(a): The relationship between performance expectancy and behavioral intention will be moderated by neuroticism.
163 Computer Self-Efficacy and Computer Anxiety
Past research has argued for, and strongly supported, the lack of a direct effect of both computer self-efficacy and computer anxiety on intention to adopt a new technology (Venkatesh et al., 2003). In this research, these two constructs are argued to influence behavioral intention through moderating the effects of performance and effort expectancy on the former. There is strong support in the literature for the notion that, ceteris paribus, women generally exhibit a lower initial level of general computer self-efficacy (Busch, 1995, 1996; Hartzel, 2003; Marakas et al., 1998), and higher levels of computer anxiety (Busch, 1995; Harrison & Rainer, 1992; Heinsenn, Glass, & Knight, 1987). Following from the above exposition, the following hypotheses are advanced, expressed in terms consistent with the formulation of UTAUT:
H8(a): The relationship between performance expectancy and behavioral intention will be moderated by computer self-efficacy.
H8(b): The relationship between effort expectancy and behavioral intention will be moderated by computer self-efficacy.
H9(a): The relationship between performance expectancy and behavioral intention will be moderated by computer anxiety.
H9(b): The relationship between effort expectancy and behavioral intention will be moderated by computer anxiety.
Another explanation for the observed gender differences advanced by previous research refers to the characterization of perceived ease of use (effort expectancy in UTAUT) as a hurdle to user acceptance (Venkatesh & Morris, 2000). In this conception, users anchor their perceptions of ease of use to their computer self-efficacy and adjust those perceptions according to the objective usability of the system after hands-on experience. Thus, systems whose perceived usability falls beneath the threshold of the user’s computer self-efficacy are more likely to be rejected (Venkatesh & Davis, 1996). Research into antecedents of perceived ease of use has found significant results for both computer self-efficacy (Agarwal & Karahanna, 2000; Venkatesh, 2000; Venkatesh & Davis, 1996) and computer anxiety (Venkatesh, 2000). The proposition previously advanced is that lower levels of computer self-efficacy and higher levels of computer anxiety among women lead to lowering their perceptions of ease of use, and thus low perceptions of this construct increase its salience in forming the intention to adopt (Venkatesh & Morris, 2000). Consistent with past research (e.g., Venkatesh, 2000; Venkatesh & Davis, 1996), the following hypotheses are advanced, in an attempt to replicate past findings:
H10: Computer self-efficacy will have a positive effect on effort expectancy. H11: Computer anxiety will have a negative effect on effort expectancy.
VARIABLE OPERATIONALIZATION AND MEASUREMENT
Psychological Gender-role
A shortened version of the Bem Sex-Role Inventory (BSRI; Bem, 1974, 1981; Campbell, 1997; Powell & Butterfield, 2003) was used to measure the psychological gender-role of individual participants. While the original version of the BSRI instrument comprised 60 items, a shorter set was developed by Bem to facilitate its use in research settings without sacrificing its underlying characteristics. The scores of two sets of 10 items are totaled and subtracted one from the other to arrive at a difference score that measures gender traits. An important advantage of this form of measurement is that it generates a continuous variable, theoretically ranging between minus 60 and plus 60, although the actual observed range is generally narrower. Thus, it is not necessary to categorize individuals as masculine or feminine in order to analyze the effects of psychological gender-role on the outcomes of interest.
Core Self-Evaluations
These constructs were measured using the Core Self-Evaluation instrument developed by Johnson et al. (2006). In some studies (e.g., Judge, Thoresent, Pucik, & Welbourne, 1999), the various core self-evaluation traits are combined into one single factor, and then the predictive validity of the latter is examined. The current research, however, distinguishes between the traits and analyzes their potential effects independently.
Computer Anxiety
This construct has been measured in a variety of ways ever since computers were introduced in the workplace. Many implementations of the concept can be traced back to the fear facet of the original rating scale by Heinsenn et al. (1987), the Computer Anxiety Rating Scale (CARS), which used a 5-point strongly agree–strongly disagree format. An alternative scale is used by Venkatesh (2000), composed of nine items in a 7-point Likert scale of similar format. The items employed in this study are a subset of those originally developed by Heinsenn et al. (1987), after removing those items that are no longer representative of the current technological context. Higher scores are an indication of increased anxiety toward computers.
UTAUT constructs
The core constructs of UTAUT were measured following the guidelines set in the original study.
Risk-Taking Propensity
165
(2000, 2001). For the second measure (e.g., ―Lottery measure B‖), the decision was between two risky propositions, where the first involved less outcome variability (e.g., 60/40) and second more outcome variability (e.g., 25/75), while still holding expected value between options equal. In both cases, participants choosing the first alternative were deemed to be more risk-averse, while participants choosing the second alternative, more risk taking.
RESEARCH DESIGN AND DATA COLLECTION
Participants
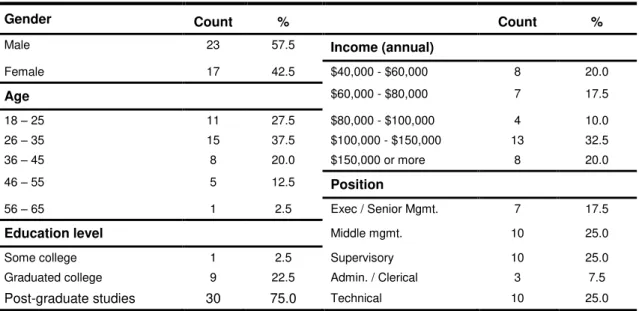
Sixty-four business professionals participated in this study, drawn mostly from large public accounting firms in the Midwest United States. All subjects were employed at firms that supported a curricular advisory body, and were recruited by contacting representatives of this body requesting they distribute a call for participation to other employees of their firm. Of the original sample, 56 provided evaluations of the two technologies as well as answered questions regarding their intention to hypothetically adopt them in a business organization. Of these, 40 participants explicitly chose one of the two technologies under consideration, and these form the final sample for analysis. The remaining subjects could not decide between the two alternatives presented to them and were thus removed from further analysis. Table 1 displays the demographic and employment characteristics of the final subject pool.
Design
Data for this research were collected via a secure Website that participants could access at their convenience. After agreeing to participate in the study and providing basic demographic information, participants answered a set of questions that captured the constructs of interest by selecting the desired option from drop-down boxes located next to the statement prompting
Table 1. Sample Characteristics (N = 40).
Gender Count % Count %
Male 23 57.5 Income (annual)
Female 17 42.5 $40,000 - $60,000 8 20.0
Age $60,000 - $80,000 7 17.5
18 – 25 11 27.5 $80,000 - $100,000 4 10.0
26 – 35 15 37.5 $100,000 - $150,000 13 32.5
36 – 45 8 20.0 $150,000 or more 8 20.0
46 – 55 5 12.5 Position
56 – 65 1 2.5 Exec / Senior Mgmt. 7 17.5
Education level Middle mgmt. 10 25.0
Some college 1 2.5 Supervisory 10 25.0
Graduated college 9 22.5 Admin. / Clerical 3 7.5
a response. Where appropriate, items were randomized across different measures. All scales were validated and refined during a series of pilot studies using techniques appropriate for the nature of the scales and in keeping with the tenets set forth by Straub (1989) and Boudreau, Gefen and Straub (2001).
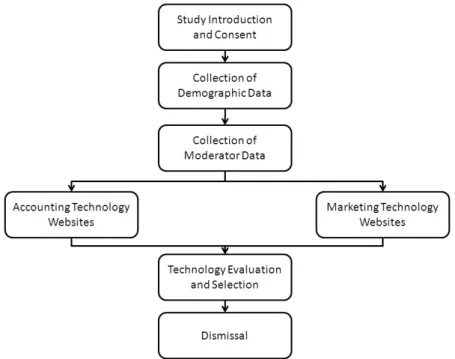
Figure 3 shows the entire sequence of data collection and assignment to the appropriate research condition as was experienced by the participating subjects. Data about the proposed moderating variables were collected before participants had access to the experimental materials, whereas data about their technology evaluations and intentions (e.g., data for performance expectancy, effort expectancy, and intention to adopt for each technology) were collected afterwards. Finally, participants were thanked for their time and dismissed. While participants were informed of the general nature of the study, focused on the decision-making process behind technology adoption decisions, they were not made aware of the focus on gender effects in this area. This was done in an effort to prevent participants from considering how their responses to the questionnaire may be construed in light of their gender, and thus allow us to obtain data that was less subject to self-presentation bias. A complete list of all items presented in the questionnaire, organized by measure and including, where necessary, response instructions, are included in Appendix A. Sources for these measures were discussed in the previous section.
Participants were randomly assigned based on their domain of training and employment as either accountants or marketing professionals. Subjects were asked to review and evaluate two technologies for potential adoption in a hypothetical organization. In half of the cells, the two technologies were accounts receivable packages, in the remaining, with appropriate modification of the framing, coupon management software. All participants were presented with a hypothetical framing: Their organization was undergoing the evaluation and selection process for a new technology, and they had been selected as members of the committee tasked with such endeavor. After prior screening by their Information Technology department, two candidate software packages had been identified as potential candidates.
167
Participants could access modified vendor Websites for each technology. While the Websites included in this research retained the look and feel of the actual vendors of these technologies (including color, layout, and logos), they were modified by the authors both to remove elements extraneous to this research, such as contact information, links to other products offered by the same vendor, and so on, and to shorten the number of features to reduce the load on the participants. Sample screenshots of the materials are included in Appendix B. Results of the pilot studies revealed no perceived loss of functionality relevant to the selection process as a result of the reduction of listed functions originally supplied by the vendors. The data collection system was designed to ensure that no subject could participate more than once and no subject could suspend their participation and return at a later time.
ANALYSIS METHODS
Data modeling and analysis for this research was conducted using Partial Least Squares (specifically, SmartPLS 2.0 M3; Ringle, Wende, & Will, 2005). The PLS methodology was selected for its ability to handle small samples, such as the one employed in this study, and the existence of prescriptive literature on the modeling of interaction effects with latent variables (e.g., Chin, Marcolin, & Newsted, 2003). Given the comparative nature of this study, perceptions for the different technologies were grouped into those that had been chosen by the participant, and those that were not, with an eye toward assessing the possibly differential effects of the moderating variables for these two groups of technologies. However, when limiting the items in each latent variable to those that loaded highly and significantly in their intended construct (e.g., Gefen & Straub, 2005), it was realized that the intended moderator variables would not necessarily be represented by the same set of indicators, raising questions about the comparability of the effects across chosen and not-chosen technologies. Thus, an alternative approach was devised in order to test the hypothesized relationships. An example using computer anxiety is depicted in Figure 4.
By modeling latent variables in this fashion, and retaining only those items that significantly loaded on the intended moderating variable, two objectives were fulfilled. First, comparability of the moderator effects between the two groups was made possible, since the same set of indicators represented the latent variable in both cases. To further constrain this to be the case, all moderating effects presented in this section were tested jointly with both technologies present, as shown in Figure 4. Second, this allowed for the direct effect of the proposed moderator variables to be included in the model before any interaction effects were assessed (Jaccard, Turrisi, & Wan, 1990). In particular, interaction effects were modeled and analyzed as follows.
Figure 4. Two-group modeling approach.
variance explained in the dependent variable by the full model, containing the interaction terms, was compared to that of the base model, which contained only the direct effects. The statistical significance of this increase in variance explained was then assessed. The approach is analogous to the hierarchical testing of moderating effects in multiple linear regression, but employing PLS as the underlying technique. Pavlou and El Sawy (2006) employed a similar approach.
Given the statistical limitations imposed by the number of participants in this research (e.g., the heuristic of 10 cases per effect on any endogenous variable), interactions were tested for performance and effort expectancy separately, as detailed below. Despite not being the main focus of this study, additional validation of the research framework employed was obtained by modeling the intentions to adopt for each of the two technologies evaluated by the participants as antecedents to a dummy-coded variable indicating the actual choice made. The results strongly support the comparative nature of this research, with both paths strongly significant (at the p < 0.0001 level) and the variance explained in the choice variable just short of 68%.
Convergent and discriminant validity were assessed following the extant procedures outlined by Gefen and Straub (2005). Only those indicators that loaded significantly in their latent variable were retained in the final model. An examination of the loading patterns revealed no cross-loadings of any important magnitude, and in all cases the square root of the average variance extracted was larger than any correlations among pairs of latent constructs. Composite reliabilities were also above recommended thresholds.
HYPOTHESIS TESTING AND RESULTS
169
Table 2a. Measurement Model – Base Models.
CR BI
(CH)
PE (CH)
EE (CH)
BI (NCH)
PE (NCH)
EE (NCH)
BI (CH) 0.8681 0.833
PE (CH) 0.8678 0.452** 0.790
EE (CH) 0.9593 0.456** 0.429** 0.925
BI (NCH) 0.9519 0.932
PE (NCH) 0.9629 0.467** 0.931
EE (NCH) 0.9738 0.459** 0.480** 0.950
Note: Models were estimated independently of each other. Elements in the diagonal are the square root of the average variance extracted (AVE); off-diagonal elements are correlations between the latent constructs. CH = Chosen, NCH = Not Chosen, CR = Composite Reliability, BI = Behavioral Intention, PE = Performance Expectancy, EE = Effort Expectancy.
*Correlation significant at the 0.05 level (two-tailed), **Correlation significant at the 0.01 level (two-tailed).
Table 2b. Base Models.
Block Term
Behavioral Intention (Chosen)
Behavioral Intention (Not Chosen)
B R2 B R2
Base Model PE
EE
0.314* 0.321*
0.288 0.321* 0.305*
0.290
Note: Models for the chosen and not-chosen technologies were estimated independently of each other. PE = Performance Expectancy, EE = Effort Expectancy.
*p < 0.05.
provide clear support for H1a and H1b and are in keeping with previous results obtained for UTAUT suggesting validity of the measurement models (Venkatesh et al., 2003).
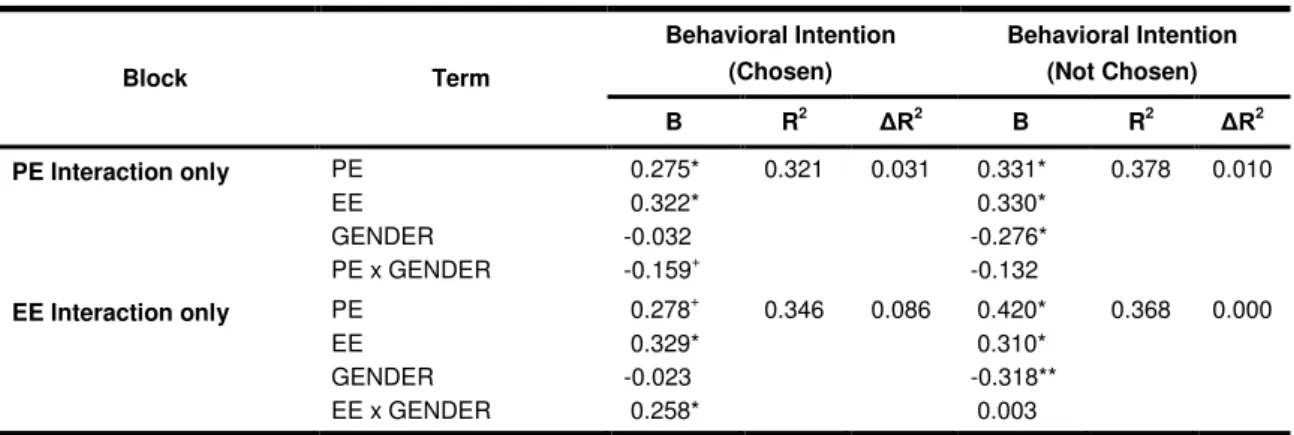
H2a and H2b focus on the moderating effects of gender as reported by prior studies. As can be seen from Table 3, the results parallel those of prior studies with the observed gender effect negatively related to performance expectancy (PE) and positively related to effort expectancy (EE). Based on the coding of gender employed in this research, these results suggest that the effects of PE on behavioral intention (BI) are stronger for men than are for women, while the converse is true for the effects of EE on BI (which are stronger for women than for men). This is evidenced by the negative path coefficient from PE to BI, indicating that women place less importance than men on the level of expected performance derived from use of the focal technology, and by the positive path emanating from EE to BI, suggesting in this case that women place more of an emphasis on levels of ease of use associated with the technology under consideration than men do. These results are significant only for the chosen technology, although the coefficients are of the expected sign for the not-chosen technology. This provides support for H2a and H2b and replicates prior work.
in the moderating relationships for the not-chosen technology. The signs of the coefficients parallel those obtained in the testing of H2, however. As such, we can find no support for H3a but we find some support for H3b. Other research that has examined these relationships, albeit using a different theoretical basis (Venkatesh et al., 2004) indicates that masculine individuals form their intentions based on utilitarian attitudes toward technology, whereas more feminine individuals emphasize their ability to use the technology more. These results are robust to the gender of the individual, thus showing that psychological gender-role provides additional variance beyond the dichotomous classification of participants into male and female, thus increasing the explanatory power of the model. When viewed in conjunction with the results obtained for H2, and in keeping with earlier findings related to this construct, we find support for gender (either biological or role; see Table 4) as a moderator within the model.
Table 3. Moderating Effects of Biological Gender.
Block Term
Behavioral Intention (Chosen)
Behavioral Intention (Not Chosen)
B R2 ΔR2 B R2 ΔR2
PE Interaction only PE EE GENDER PE x GENDER
0.275* 0.322* -0.032 -0.159+
0.321 0.031 0.331* 0.330* -0.276* -0.132
0.378 0.010
EE Interaction only PE EE GENDER EE x GENDER
0.278+
0.329* -0.023 0.258*
0.346 0.086 0.420* 0.310* -0.318** 0.003
0.368 0.000
Note: Models for the chosen and not-chosen technologies were estimated independently of each other. Changes in R2 for the interaction terms are calculated using the base model with the direct effect of the moderator
variable as the reference. PE = Performance Expectancy, EE = Effort Expectancy. *p < 0.05, + p <0.10, **p < 0.01.
Table 4. Moderating Effects of Psychological Gender-Role (BSRI).
Block Term
Behavioral Intention (Chosen)
Behavioral Intention (Not Chosen)
B R2 ΔR2
B R2 ΔR2
PE Interaction only PE EE BSRI PE x BSRI
0.263+ 0.336* 0.091 -0.126
0.304 0.015 0.213+ 0.364* -0.076 -0.236+
0.340 0.041
EE Interaction only PE EE BSRI EE x BSRI
0.320* 0.294+ 0.060 -0.080
0.297 0.008 0.420** 0.218+ -0.253* 0.319**
0.368 0.069
Note: Models for the chosen and not-chosen technologies were estimated independently of each other. Changes in R2 for the interaction terms are calculated using the base model with the direct effect of the moderator
171
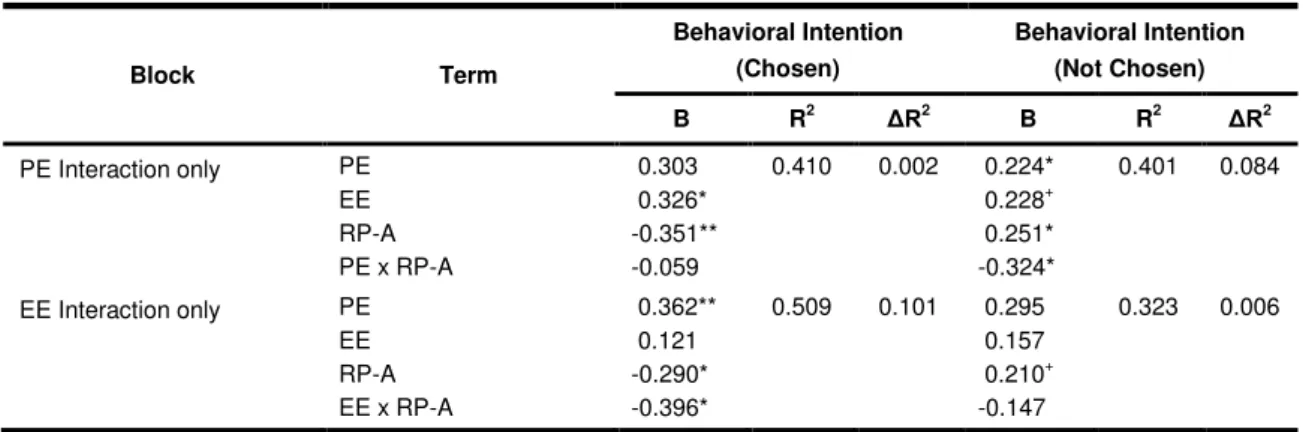
To provide a thorough investigation into the various forms of risk-taking behavior, recall that two different approaches were employed: (a) Lottery A, looking at sure gain versus a risky proposition, and (b) Lottery B, a choice between two risky propositions. The results for each of these measures are shown in Tables 5a and 5b.
Lottery A (sure gain vs. risky proposition) displays somewhat equivocal results with regard to its potential moderating effect. As shown in Table 5a, the construct displays a negative moderating effect for both PE and EE for both technologies but is significant only for EE in the chosen technology and PE for the not-chosen technology (p < 0.05). For Lottery B, we find a slightly different set of relationships. The results in Table 5b indicate the construct provides a negative moderation for PE and EE in the chosen technology and EE in the not-chosen technology, but a positive moderation for PE in the not-chosen technology. Further, significance
Table 5a. Moderating Effects of Risk Propensity (Measure Lottery A).
Block Term
Behavioral Intention (Chosen)
Behavioral Intention (Not Chosen)
B R2 ΔR2 B R2 ΔR2
PE Interaction only PE EE RP-A PE x RP-A
0.303 0.326* -0.351** -0.059
0.410 0.002 0.224* 0.228+
0.251* -0.324*
0.401 0.084
EE Interaction only PE EE RP-A EE x RP-A
0.362** 0.121 -0.290* -0.396*
0.509 0.101 0.295 0.157 0.210+ -0.147
0.323 0.006
Note: Models for the chosen and not-chosen technologies were estimated independently of each other. Changes in R2 for the interaction terms are calculated using the base model with the direct effect of the moderator variable as the
reference. PE = Performance Expectancy, EE = Effort Expectancy, RP-A = Risk Propensity, Lottery Measure A. *p < 0.05, + p <0.10, **p < 0.01.
Table 5b. Moderating Effects of Risk Propensity (Measure Lottery B).
Block Term
Behavioral Intention (Chosen)
Behavioral Intention (Not Chosen)
B R2 ΔR2 B R2 ΔR2
PE Interaction only PE EE RP-B PE x RP-B
0.341* 0.283+ -0.079 -0.158
0.335 0.037 0.306** 0.299* 0.209* 0.254*
0.395 0.06 0
EE Interaction only PE EE RP-B EE x RP-B
0.409** 0.195 -0.139 -0.280*
0.343 0.045 0.146 0.280+ 0.237* -0.337*
0.418 0.08 3
Note: Models for the chosen and not-chosen technologies were estimated independently of each other. Changes in R2 for the interaction terms are calculated using the base model with the direct effect of the moderator variable as the
is found only for PE in the chosen technology and EE in both technologies. While similarities exist between the two tests of risk propensity, the differences are notable. When considered together, the results provide support for H4a and H4b, suggesting that risk-taking propensity is a moderator for both PE and EE and their relationship to BI.
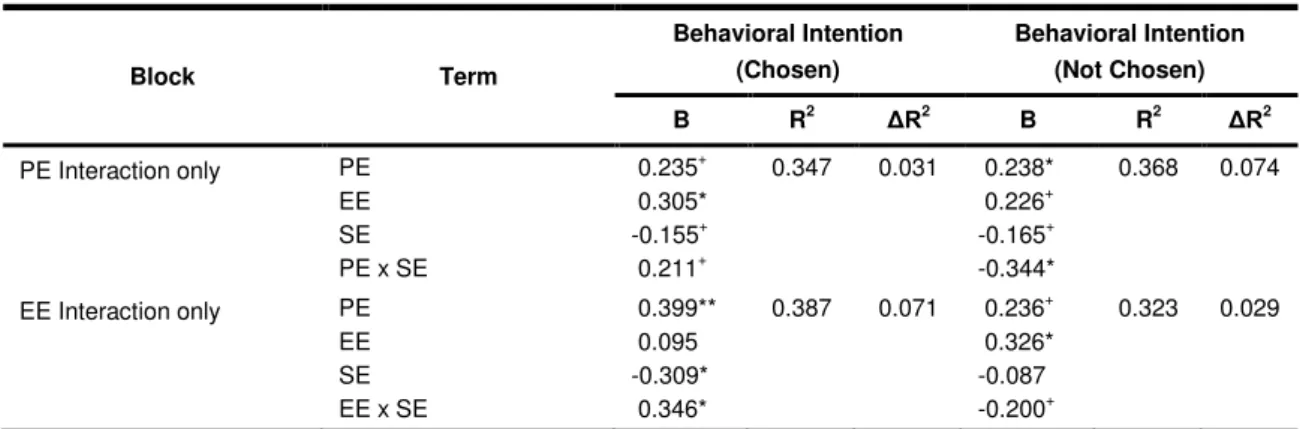
The results for the test of self-esteem (one of the core self-evaluation constructs) are found in Table 6. The results suggest that self-esteem (SE) plays an important moderating role with regard to the PE– and EE–BI relationships. Interestingly, SE serves as a positive moderator for the chosen technology and in a negative capacity for the not-chosen technology. It would seem that SE provided the subjects with a form of enhancement of the differences between the two technologies (this will be discussed further immediately below). Also, given the prior relationships between SE and gender reported in the literature, SE appears to be a strong candidate to better explain the previously reported gender moderation in UTAUT. Given these results, we find support for H5a, and H5b.
Continuing with our tests of the individual components within the core self-evaluation construct (see Table 7), we find locus of control (LC) to be a significant moderator within the model. While significant for both PE and EE for both technologies, LC appears to positively moderate PE while negatively moderating EE for the chosen technology and negatively moderating both variables for the not-chosen technology. While the reasoning behind these findings requires further thought and discussion (and, given the exploratory nature of this research, possibly further study), the results obtained provide clear support for H6a, and H6b.
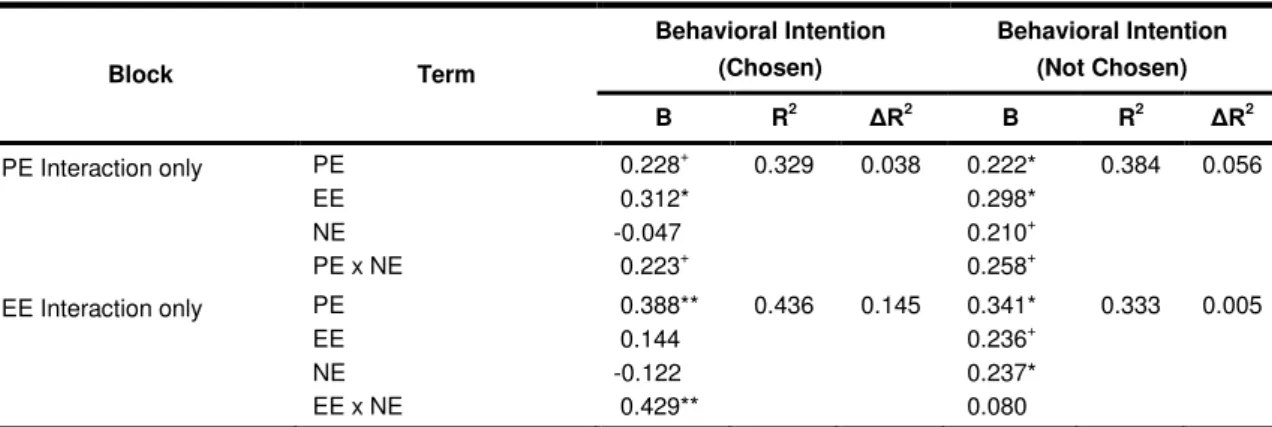
In much of the psychology literature, neuroticism is characterized as an opposing core evaluation to esteem. When viewed in combination with the results obtained for self-esteem, we see continued evidence of this characterization. A review of Table 8 indicates neuroticism to be a potential moderator within UTAUT but more clearly for PE than for EE. As such, we find clear support for H7a, with limited support for H7b.
The final component in the core self-evaluation construct is computer self-efficacy (CSE). Recall this variable was measured at the general domain level (GCSE) as conceptualized by Marakas et al. (1998) and operationalized by Johnson & Marakas (2000). As shown in Table 9, GCSE is a significant moderator for both PE and EE with regard to the
Table 6.Moderating Effects of Self-Esteem.
Block Term
Behavioral Intention (Chosen)
Behavioral Intention (Not Chosen)
B R2 ΔR2
B R2 ΔR2
PE Interaction only PE EE SE PE x SE
0.235+ 0.305* -0.155+
0.211+
0.347 0.031 0.238* 0.226+ -0.165+
-0.344*
0.368 0.074
EE Interaction only PE EE SE EE x SE
0.399** 0.095 -0.309* 0.346*
0.387 0.071 0.236+ 0.326* -0.087 -0.200+
0.323 0.029
Note: Models for the chosen and not-chosen technologies were estimated independently of each other. Changes in R2 for the interaction terms are calculated using the base model with the direct effect of the moderator
173
Table 7. Moderating Effects of Locus of Control.
Block Term
Behavioral Intention (Chosen)
Behavioral Intention (Not Chosen)
B R2 ΔR2
B R2 ΔR2
PE Interaction only PE EE LC PE x LC
0.279 0.189+ -0.232+
0.239*
0.368 0.043 0.221* 0.335+ 0.007 -0.204+
0.318 0.026
EE Interaction only PE EE LC EE x LC
0.281* 0.220+ -0.256* -0.266*
0.381 0.056 0.220+ 0.301* 0.020 -0.253*
0.336 0.044
Note: Models for the chosen and not-chosen technologies were estimated independently of each other. Changes in R2 for the interaction terms are calculated using the base model with the direct effect of the moderator
variable as the reference. PE = Performance Expectancy, EE = Effort Expectancy, LC = Locus of Control. *p < 0.05, + p <0.10, **p < 0.01.
Table 8. Moderating Effects of Neuroticism.
Block Term
Behavioral Intention (Chosen)
Behavioral Intention (Not Chosen)
B R2 ΔR2 B R2 ΔR2
PE Interaction only PE EE NE PE x NE
0.228+ 0.312* -0.047 0.223+
0.329 0.038 0.222* 0.298* 0.210+ 0.258+
0.384 0.056
EE Interaction only PE EE NE EE x NE
0.388** 0.144 -0.122 0.429**
0.436 0.145 0.341* 0.236+ 0.237* 0.080
0.333 0.005
Note: Models for the chosen and not-chosen technologies were estimated independently of each other. Changes in R2 for the interaction terms are calculated using the base model with the direct effect of the moderator
variable as the reference. PE = Performance Expectancy, EE = Effort Expectancy, NE = Neuroticism. *p < 0.05, + p <0.10, **p < 0.01.
chosen technology, suggesting that higher levels of GCSE contribute to the formation of PE and EE perceptions and to the choice process. In addition, the results suggest that higher levels of GCSE in a choice setting will have a greater effect on the formation of EE perceptions than on PE perceptions. Further, the results suggest that GCSE is not a salient moderator with regard to the not-chosen technology. Here again, we see evidence of a type of enhancement in differentiating between the two technologies brought forth by the subject’s GCSE perceptions. Given these results, we find clear support for H8a, and H8b.
Hypotheses 10 and 11 propose both GCSE and computer anxiety (CANX) will have an antecedent relationship to the formation of effort expectancy perceptions. Table 11 contains the results obtained with regard to the testing of these hypotheses. Tested separately, both GCSE and CANX display significant direct effects with EE for the chosen technology, suggesting that higher levels of GCSE and lower levels of CANX will directly affect perceptions of ease of use. When tested together, however, the effect of CANX on the formation of effort perceptions appears to supplant the effects of GCSE. Given that CANX often has been positioned as an antecedent to GCSE (Marakas et al., 1998), these results suggest that, in the presence of high levels of CANX, a person’s GCSE perception is less important than her feelings of concern with regard to forming a perception of effort expectancy. Given these results, we find support for H10 and H11.
Table 9. Moderating Effects of Generalized Computer Self-Efficacy.
Block Term
Behavioral Intention (Chosen)
Behavioral Intention (Not Chosen)
B R2 ΔR2
B R2 ΔR2
PE Interaction only PE EE GCSE PE x GCSE
0.343* 0.369* -0.367** 0.363**
0.451 0.113 0.280* 0.300* -0.240* 0.145
0.353 0.018
EE Interaction only PE EE GCSE EE x GCSE
0.236* 0.473** -0.162+
0.529***
0.589 0.251 0.336* 0.280* -0.216* -0.124
0.348 0.013
Note: Models for the chosen and not chosen technologies were estimated independently of each other. Changes in R2 for the interaction terms are calculated using the base model with the direct effect of the moderator
variable as the reference. PE = Performance Expectancy, EE = Effort Expectancy, GCSE = Generalized Computer Self-Efficacy.
** p < 0.01, * p < 0.05, + p <0.10.
Table 10. Moderating Effects of Computer Anxiety.
Block Term
Behavioral Intention (Chosen)
Behavioral Intention (Not Chosen)
B R2 ΔR2 B R2 ΔR2
PE Interaction only PE EE CANX PE x CANX
0.356* 0.222 -0.060 -0.292*
0.371 0.083 0.273* 0.268* 0.300* 0.403**
0.438 0.119
EE Interaction only PE EE CANX EE x CANX
0.371** 0.270* 0.008 -0.405**
0.433 0.145 0.314* 0.363* 0.211+
0.102
0.328 0.009
Note: Models for the chosen and not-chosen technologies were estimated independently of each other. Changes in R2 for the interaction terms are calculated using the base model with the direct effect of the moderator
175
Table 11. Antecedents to Effort Expectancy.
Block Term
Effort Expectancy (Chosen)
Effort Expectancy (Not Chosen)
B R2 B R2
GCSE only GCSE 0.290** 0.084 0.129 0.017
CANX only CANX -0.361** 0.130 -0.350** 0.123
Both GCSE and CANX (no relationship between GCSE and CANX)
GCSE CANX
0.131
-0.291+ 0.142
-0.091
-0.398* 0.128
Both GCSE and CANX (GCSE and CANX related)
GCSE CANX
0.101
-0.308* 0.139
-0.083
-0.389* 0.123
Note: Models for the chosen and not-chosen technologies were estimated independently of each other. The same indicators used in the estimation of the interaction effects were used in these models in order to maintain consistency. GCSE = Generalized Computer Self-Efficacy, CANX = Computer Anxiety.
*p < 0.05, **p < 0.01, ***p < 0.001.
LIMITATIONS TO THIS STUDY
As with all empirical investigations, certain limitations must be acknowledged when interpreting the results. First, the sample size of this study was admittedly, albeit necessarily, smaller than ideal. Early in the research design, we chose to focus only on subjects who were actively employed in the accounting domain to increase the external validity of the study. We believe this constraint contributed positively to the results obtained and the conclusions derived thereof, but resulted in challenges associated with finding professionals who were willing to give of their valuable time to participate in the manipulation. The subject recruitment process took over 6 months with several subjects from a wide variety of Midwestern accounting firms (both Big 43 and independent) ultimately taking part.
Another possible limitation to consider lies with the method by which the data were collected. While clearly falling into the experimental category of methods, the use of a voluntary Web-delivered vehicle for data collection raises questions of possible loss of experimental control. Given our desire to use accounting professionals as subjects, we determined that bringing them to a laboratory setting would prove inconvenient and further exacerbate the challenges in reaching a suitable sample size for analysis. Further, by allowing the subjects to participate while in their natural work setting, we believe any possible concerns or anxieties associated with a more formal experimental setting were reduced. Subjects were clearly instructed to complete the exercise in one sitting and to not begin the exercise unless they felt reasonably confident they had a minimum of 1 hour uninterrupted in which to complete the project. Start time and completion time for each subject was analyzed to ascertain the extent to which these criterion were met. In all cases, subjects participated in the exercise during normal business hours with no subject’s completion time being statistically different than the mean completion time for the exercise. Given this, we believe minimal loss of experimental control occurred.
The research model tested in this study, shown in Figure 2, did not include the important construct of social influence, which is a direct determinant of intention to adopt, and whose relationship with the latter is also affected by gender (Venkatesh et al., 2003). Due to the constrained nature of the research design employed here, where participants were asked to make hypothetical adoption decisions, their ability to form valid perceptions of social influence was surely limited. Past research examining these effects found that they appear to be more relevant in contexts where mandatory usage of the specific technology is required, but not directly significant when operating in contexts where technology usage is under the control of the individual (Venkatesh & Davis, 2000). Even in mandatory settings, the effect of social influence on intentions appears to be limited to the early stages of adoption and usage. All this should not be taken to mean that we believe the construct not to be worthy of careful examination; to the contrary, we believe social factors play an important role in technology adoption within organizations. However, we believe that, due to the inherently social nature of the construct, in order for these investigations to be meaningful, they should be conducted in field settings where these effects are important to the individual adopter.
177
which we obtained by accessing the logs of the Website used to set up the research, provides some evidence that thought was given to the research scenario presented to them.
Nonetheless, the selection and adoption of a technology such as an organization-wide accounting package would clearly entail the review of multiple candidate packages before a final pair of two could be compared. Further, it is probable that many hours of discussion among the selection committee would occur with regard to the functional requirements upon which the final selection will be based. Given this, it is possible that the framing of the subject to simply compare and select among a choice set of two candidates may limit the richness of the true choice process. We believe future research needs to investigate this issue to determine the extent to which multiple candidates affect the choice process.
DISCUSSION
A number of recent studies in the stream of literature examining user acceptance of information technology have shown the presence of a moderating effect of the gender of the user, such that certain relationships are stronger for men than for women, and vice versa. Gender effects such as this one are useful in that they put in evidence the presence of an underlying dynamic that affects relationships of interest; however, they provide neither an explanation for the occurrence of those effects, nor a lever that can be incorporated into design considerations such that it would be possible to develop technologies enjoying wider acceptance.
The present research set out to investigate a number of different potential explanations for the observed gender effects. In particular, we identified a number of individual traits that exhibit gender differences and could plausibly be responsible for the moderating influences that have hitherto been identified as related to the gender of the users. Through an analysis of data collected from business professionals employing commercially available technologies within their professional discipline, we uncovered a number of interesting effects that we believe can form the basis for future investigations in this area. Results from our analyses are summarized in Table 12.
In light of the limitations discussed in the previous section, it is clear that our results should be regarded as preliminary and in need of replication. We believe, however, that our results contribute to a better clarification of the underlying dynamics of the observed gender effect or, at the very least, provide interesting directions for future research. We see the current status of research in this area as limiting for one major reason. While there is no doubt as to the existence of a gender effect in all of the central relationships in our models explaining user acceptance of technology, there is little that can be done, from an applied standpoint, with knowledge of such an effect. Thus, designers and marketers are presented with several moral, societal, and possibly legal constraints. Understanding how such an effect operates, on the other hand, may potentially provide both researchers and practitioners with a better understanding of the adoption process, ultimately leading to increased success in the adoption of technology.
Table 12. Summary of Hypotheses Testing.
Hypothesis Results
1 Replication of UTAUT Supported
2 Moderating effect of biological gender Support only for chosen technology
3 Moderating effect of psychological gender Support only for not-chosen technology
4 Moderating effect of risk propensity Partially supported
5 Moderating effect of self-esteem Supported
6 Moderating effect of locus of control Supported
7 Moderating effect of neuroticism Support only for chosen technology
8 Moderating effect of computer self-efficacy Support only for chosen technology
9 Moderating effect of computer anxiety Supported
10 Computer self-efficacy as antecedent of effort expectancy Supported
11 Computer anxiety as antecedent of effort expectancy Supported
Results from these hypotheses confirm this, as well as the presence of some effect related to gender of the participants (biological or psychological) in the relationships. Finally, we replicated past findings about the role of computer self-efficacy and computer anxiety as determinants of perceptions of the amount of effort required to use the technology.
In the second group of hypotheses (from 4 to 7), we investigated potential candidates for the observed gender effect that can be deemed to be largely invariant over the life of the individual, such as risk propensity and personality traits. While almost by definition these cannot be manipulated or changed in any way, and may thus be deemed of more limited applicability by both researchers and practitioners, we believe knowing of their existence and importance is nonetheless valuable. At the very least, researchers can control for these constructs in future investigations and thus reduce any potential confounds, as well as better highlight the value and contribution of their research against the findings reported here. These personality traits, particularly neuroticism, seem to be involved in moderating the relationships between PE and EE, and BIs toward new technologies.
Finally, we investigated the roles that computer SE and CANX may play in moderating these relationships. Interaction effects involving these constructs showed large effect sizes when explaining variance in the dependent variable of interest, adoption intention. These large effects, in addition to the extensive literature dealing with interventions able to improve those perceptions, make these two variables particularly attractive as targets for further research. While we believe that further research, likely in the form of a research program, is required before these findings (or any others in the technology acceptance literature) can be practically applied in the design and development of technology artifacts, we do believe these results have direct implications for technology implementation and change management programs.
179
positive intentions toward the technology for any levels of EE. Through these two channels, computer SE significantly impacts technology adoption. Opposite effects can be seen for CANX: Users with higher levels of CANX perceive applications as being harder to use, which leads in turn to a more limited intention to adopt them in the future. As well, CANX negatively affects that relationship, such that potential adopters with higher levels of CANX are even less likely to adopt the technology.
These findings are even more relevant when considering the existence of extensive literature bearing on the modification of these two important constructs, largely based on the seminal work of Bandura (1986, 1997). There is also extensive work published on different intervention methods in the psychology, education, and management disciplines, and even within the information systems domain itself, directly concerned with computer self-efficacy (Davis & Yi, 2004; Johnson & Marakas, 2000; Yi & Davis, 2003). As a result, we believe the design and development of implementation and change management programs associated with the introduction of new technologies in the workplace could draw from these findings and others in this domain to incorporate those in the future.
One possible issue that may limit the contribution of this research is the degree of permanence of gender effects observed in technology acceptance research. Indeed, Venkatesh et al. (2003) interpreted some of their findings as indicating that gender differences in the use of information technology may be transitory and may possibly disappear as younger generations of users are raised in a environment where technology is pervasive. If that were the case, gender differences with respect to technology use may represent an area of research that, while certainly interesting, will slowly decrease in importance as those differences disappear over time. In this scenario, the value of our findings, which were obtained from a sample of business professionals, would be diminished. We believe, however, this not to be the case, for multiple reasons.
Finally, there is evidence that, contrary to expectations that these differences may disappear or be tempered as younger generations are raised in a technology-pervasive environment, young individuals today still exhibit both gender differences in this regard, as well as difficulties using technology. The research just cited (Goh et al., 2007), as well as work by Mcilroy, Sadler, and Boojawon (2007) in the U.K., provide some evidence of this. In the first case, and in addition to the findings discussed above, the sex of the students significantly predicted their levels of computer SE, whereas age did not. In the study by McIlroy et al. (2007), between 33% and 41% of students surveyed exhibited some degree of computer phobia, as measured by two separate scales. Significantly, approximately 20% of the students exhibited moderate to high levels of computer phobia, an important minority. Moreover, the authors indicated these findings are in line with prior research going back more than 10 years; thus, the issue does not seem to have abated. Results from both studies are even more striking when considering data were collected from young populations of college students in developed countries, which one would expect, based on arguments by Venkatesh et al. (2003), to exhibit little of these difficulties. Altogether, we take these as evidence that the issue of gender differences related to information technology remains a worthwhile area of research.
CONTRIBUTION AND FUTURE RESEARCH
We believe this research makes several contributions to the rich stream of investigation into technology adoption in general and UTAUT specifically. The use of multiple technologies from which the selection was made combined with the use of actual technologies available within the domain of the professional subjects is, to our best knowledge, a first in the UTAUT literature. We also believe this study represents one of the first to meet the mandate brought forth by Davis, Venkatesh, and others to begin focusing our attention on practical applicability of the model rather than on investigating possibilities of additional explanatory power. To that end, we believe we have demonstrated UTAUT in an actual technology adoption setting and have furthered our understanding of its value thereof.
This research also represents a novel approach to modeling the relationships between the constructs of interest in order to further the comparability and consistency of the obtained results—by simultaneously including both the chosen and not-chosen technologies in the same model and constraining indicators to those that significantly loaded on their intended construct when direct effects on both intentions were present. The fact that the pattern of loadings was different between chosen and not-chosen technologies (particularly for the CANX construct) may in itself be a fruitful area of future research. It may indeed be the case that facets of the same concept play different roles in a context where comparisons between technologies are made.