Vol-7, Special Issue3-April, 2016, pp49-56
http://www.bipublication.com
Research Article
QSAR study of 1- Aminobenzyl-1H-indazole-3-carboxamide Analogues For
the treatment of Hepatitis C
H.Hendiani* and G.Ghasemi
Department of Chemistry, Rasht Branch, Islamic Azad University, Rasht, Iran
Corresponding author’s E-mail:hpm772000@gmail.com
ABSTRACT:
In this work quantitative structure-activity relationship (QSAR) study has been done on 1- Aminobenzyl-1H-indazole-3-carboxamide Analogues as anti-Hepatitis C drugs. Genetic algorithm (GA),artificial neural network (ANN) were used to create QSAR models. The root-mean square errors of the training set and the test set for GA models using the jack-knife method, were 0.1403, 0.1305 and R2 = 0.86. The results obtained from this work indicate that ANN and GA models are more effective than other statistical methods and exhibit reasonable prediction capabilities.
Keywords: antiviral agents, carbetamide’s, hepatitis C, QSAR
INTRODUCTION:
Hepatitis C virus (HCV) is a small (+)-RNA virus classified in the genus Hepaciviru of the family Flaviviridae.1 Nearly 3% of theglobal population (approximately 170 million) have been infectedwith HCV, while 3–4 million are newly infected eachyear. Untreated HCV infections can progress to liver fibrosis,steatosis,
cirrhosis, and even hepatocellular
carcinoma.2Sincethe discovery of the virus in 19893 much effort has been made to find efficient antiviral therapies.4Currently, the standard of care for patients with chronic hepatitis C is a combination of pegylated interferon alpha (PEG-IFN-a) and ribavirin.5However, this treatment regime is only effective for 40–60% ofpeople infected with HCV genotype-1, which accounts for the majority of infections in the US, Europe, and Asia.6 Furthermore,the low success rate and high cost associated with this treatment restrict its
usage. Viral protease and polymerase
inhibitorsare promising agents currently under development. In2011, two NS3A/4A protease inhibitors (boceprevir and telaprevir) were
approved by the US Food and Drug
activity based on QSAR substantially increases the potential for success and decreases the time spent and resources consumed.
Computational Details
Actual half-maximal inhibitory concentration (IC50) values of all compounds were selected
from literature. This set contained the effective concentration activities of 27 molecules. A set of nine compounds was randomly removed from the dataset to be used as the prediction set (PSET). The log (1/IC50) of this set spanned the entire
dataset. The remaining 27 compounds were utilized as the training set (TSET).
The structure and biological data of 27 molecules were obtained from literature. The structures were then fully optimized based on the ab initio
method using the DFT level of theory (Fig.1a,1b,1c). Dragon (version 5.5) was employed to calculate the molecular descriptors. All calculations were performed using the Gaussian 09W programs series.
The independent variables were molecular descriptors and the dependent variables were the actual half-maximal inhibitory concentration (IC50) values. More than 3150 theoretical
descriptors were selected and calculated. For each compound in the training sets, a correlation equation was derived using the same descriptors. The equation was then used to predict log (1/IC50) values for the compounds from the
corresponding test sets.
RESULTS AND DISCUSSION
In this work, QSAR between oral bio availabilities of some drugs and their molecular structural descriptors were investigated by using
using GA - Jack-nife (Fig.2) (Table 2,3). A value of 0 indicated that the corresponding feature was not selected and a value of 1 indicated that the feature was selected. Considering experimental error, the overall prediction for log (1/IC50) was
satisfactory. As can be seen in this table, there is correlation between some descriptors.
The results summarized above led to a study that targeted further optimization of the inhibitory activity by varyingaroyl substituents at the 3’-amino group. As anticipated, the compounds of this series showed improved bioactivity. In particular, the analogues with an aroyl group substituted in the para position (e.g., 13, 16, 19, 20 and 21) exhibited significantly increased activity compared with Unsubstituted derivative 2 (IC50=0.125 mm).
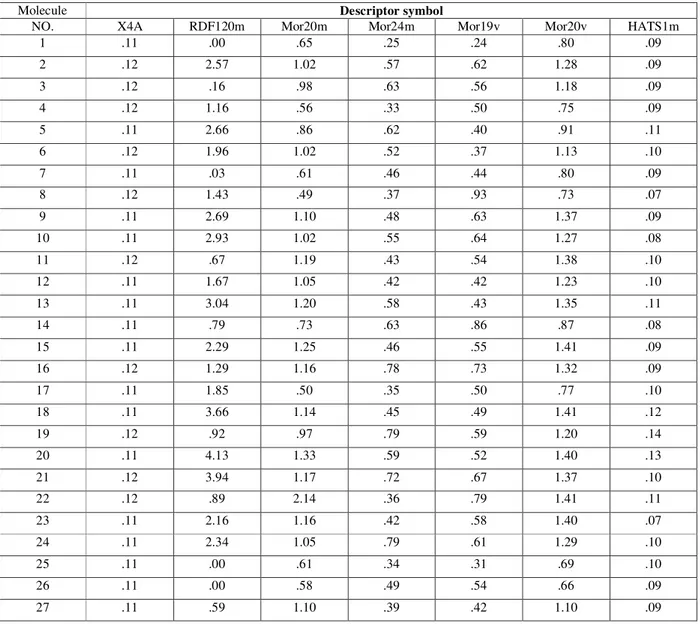
The most significant descriptors selected are X4A, RDF120m, Mor20m, Mor24m, Mor19v, Mor20v andHATS1m. Average connectivity index, topological charge index, weighted by atomic masses and atomic van der waals volumes were important descriptors in this study.
CONCLUSION
In the present study ,GA, ANN, were used as nonlinear models to their calculated molecular descriptors. The calculated statistical parameters of these models revealed that ANN was better than others which mean that there are some nonlinear relations between selected molecular descriptors and their structures.ANN was successfully used to develop a QSAR model for
1- Aminobenzyl-1H-indazole-3-carboxamide
ACKNOWLEDGMENTS
We thank the Research vice Presidency of Islamic Azad University, Rasht Branch for their encouragement, permission and financial support.
REFERENCES
1. P.G plagemann, Arch. Virol. 1991, 120, 165 2. J.H.Hoofnagle, Hepatology 2002, 36, S21. 3. Q.Choo, G. kuo, A. Weiner, L.Overby, D.
Bradley, M. Houghton, Science 1989, 244, 359.
4. J.M. Pawlotsky, S. Chevaliez, J. G.
Mchutchison, Gastroenterology 2007,
132,1979.
5. T.Schaller, N. Appel, G. Koutsoudakis, S. Kallis, V. Lohmamm, T. Pietschmann, R. Bartenschlager, J, Virol. 2007,81,4591. 6. R.liu, Z Huang, M. G. Murry, X. Guo, G. Liu,
J. Med. Chem. 2011, 54, 5747.
7. M. J. Sofia, W.Chang, P. A. Furman, R. T. Mosley, B. S. Ross, J.Med. Chem. 2012, 55, 2481.
8. A. U. Neumann, N. P. Lam,H. Dahari, D. R, Gretch, T. E. Wiley, T. J. Layden, A. S. Perelson, Science 1998, 282,103
Fig.1a. Structures of molecules used for QSAR model building
COMP R
1 3A
2 3C
25 2A
26 2B
27 2C
COMP R1 R2
3 H
4 H
Fig.1b . Structures of molecules used for QSAR model building
6 H
7 H
23 Ph
COMP R
8
9
10
11
12
13
14
Fig.1c. Structures of molecules used for QSAR model building
Table 1: The Statistical parameters of GA and ANN models.
16
17
18
19
20
21
Fig.2: Plot of output versus target data using GA method
0 5 10 15
0 5 10 15 Target O u tp u t ~ = 1 *T a rg e t + -0 .0 1 5 Training: R=0.99941 Data Fit
Y = T
Table 2: The result of GA
Descriptor symbol Descriptor group Meaning
X4A It is among the connectivity indices.
The symbol X4A corresponds to: Average connectivity index Chi-4.
RDF120m It is among the RDF
Descriptors.
The symbol RDF120m corresponds to: Radial
Distribution Function -12.0 /weighted by atomic masses.
Mor20m It is among the 3D-MoRSE
Descriptors.
The Symbol Mor20m corresponds to: 3D-MoRSE-signal 20 /weighted by atomic masses.
Mor24m It is among the 3D-MoRSE
Descriptors.
The Symbol Mor24m corresponds to: 3D-MoRSE-signal 24 /weighted by atomic masses.
Mor19v It is among the 3D-MoRSE
Descriptors.
The Symbol Mor19v corresponds to: 3D-MoRSE-signal 19 /weighted by atomic van der waals.
Mor20v It is among the 3D-MoRSE
Descriptors.
The Symbol Mor19v corresponds to: 3D-MoRSE-signal 19 /weighted by atomic van der waals volumes.
HATS1m It is among the GETAWAY
Descriptors
Table 3: Volumes descriptors for GA
Molecule Descriptor symbol
NO. X4A RDF120m Mor20m Mor24m Mor19v Mor20v HATS1m
1 .11 .00 .65 .25 .24 .80 .09
2 .12 2.57 1.02 .57 .62 1.28 .09
3 .12 .16 .98 .63 .56 1.18 .09
4 .12 1.16 .56 .33 .50 .75 .09
5 .11 2.66 .86 .62 .40 .91 .11
6 .12 1.96 1.02 .52 .37 1.13 .10
7 .11 .03 .61 .46 .44 .80 .09
8 .12 1.43 .49 .37 .93 .73 .07
9 .11 2.69 1.10 .48 .63 1.37 .09
10 .11 2.93 1.02 .55 .64 1.27 .08
11 .12 .67 1.19 .43 .54 1.38 .10
12 .11 1.67 1.05 .42 .42 1.23 .10
13 .11 3.04 1.20 .58 .43 1.35 .11
14 .11 .79 .73 .63 .86 .87 .08
15 .11 2.29 1.25 .46 .55 1.41 .09
16 .12 1.29 1.16 .78 .73 1.32 .09
17 .11 1.85 .50 .35 .50 .77 .10
18 .11 3.66 1.14 .45 .49 1.41 .12
19 .12 .92 .97 .79 .59 1.20 .14
20 .11 4.13 1.33 .59 .52 1.40 .13
21 .12 3.94 1.17 .72 .67 1.37 .10
22 .12 .89 2.14 .36 .79 1.41 .11
23 .11 2.16 1.16 .42 .58 1.40 .07
24 .11 2.34 1.05 .79 .61 1.29 .10
25 .11 .00 .61 .34 .31 .69 .10
26 .11 .00 .58 .49 .54 .66 .09