www.atmos-chem-phys.net/17/2163/2017/ doi:10.5194/acp-17-2163-2017
© Author(s) 2017. CC Attribution 3.0 License.
Measurements of sub-3 nm particles using a particle size
magnifier in different environments: from clean
mountain top to polluted megacities
Jenni Kontkanen1, Katrianne Lehtipalo1,2, Lauri Ahonen1, Juha Kangasluoma1, Hanna E. Manninen1, Jani Hakala1, Clémence Rose3, Karine Sellegri3, Shan Xiao4, Lin Wang4, Ximeng Qi5, Wei Nie5, Aijun Ding5, Huan Yu6,
Shanhu Lee7, Veli-Matti Kerminen1, Tuukka Petäjä1, and Markku Kulmala1 1Department of Physics, University of Helsinki, 00014 Helsinki, Finland
2Paul Scherrer Institute, 5232 Villigen PSI, Switzerland
3Laboratoire de Météorologie Physique, UMR6016, CNRS/UBP, 63178 Aubière, France
4Shanghai Key Laboratory of Atmospheric Particle Pollution and Prevention (LAP3), Department of Environmental Science & Engineering, Fudan University, 200433 Shanghai, China
5Joint International Research Laboratory of Atmospheric and Earth System Sciences, School of Atmospheric Sciences, Nanjing University, 210023 Nanjing, China
6School of Environmental Science and Engineering, Nanjing University of Information Science and Technology, Nanjing, China
7Department of Atmospheric Science, University of Alabama in Huntsville, Huntsville, Alabama
Correspondence to:Jenni Kontkanen ([email protected]) Received: 23 September 2016 – Discussion started: 4 October 2016
Revised: 11 January 2017 – Accepted: 22 January 2017 – Published: 13 February 2017
Abstract.The measurement of sub-3 nm aerosol particles is technically challenging. Therefore, there is a lack of knowl-edge about the concentrations of atmospheric sub-3 nm par-ticles and their variation in different environments. In this study, the concentrations of ∼1–3 nm particles measured with a particle size magnifier (PSM) were investigated at nine sites around the world. Sub-3 nm particle concentrations were highest at the sites with strong anthropogenic influ-ence. In boreal forest, measured particle concentrations were clearly higher in summer than in winter, suggesting the im-portance of biogenic precursor vapors in this environment. At all sites, sub-3 nm particle concentrations had daytime max-ima, which are likely linked to the photochemical produc-tion of precursor vapors and the emissions of precursor va-pors or particles from different sources. When comparing ion concentrations to the total sub-3 nm particle concentrations, electrically neutral particles were observed to dominate in polluted environments and in boreal forest during spring and summer. Generally, the concentrations of sub-3 nm particles seem to be determined by the availability of precursor vapors
rather than the level of the sink caused by preexisting aerosol particles. The results also indicate that the formation of the smallest particles and their subsequent growth to larger sizes are two separate processes, and therefore studying the con-centration of sub-3 nm particles separately in different size ranges is essential.
1 Introduction
2008; Zhang et al., 2012; Kulmala et al., 2013, 2014). How-ever, the chemical and physical processes leading to cluster formation and growth are not well understood, except in con-trolled systems in the laboratory (e.g., Kirkby et al., 2011; Almeida et al., 2013; Schobesberger et al., 2013; Kirkby et al., 2016; Lehtipalo et al., 2016; Tröstl et al., 2016). The con-tinuous existence of ion clusters in the atmosphere has been known for decades (see Hirsikko et al., 2011, and references therein), while knowledge about the concentrations and dy-namics of atmospheric neutral clusters is more limited. There is evidence supporting the existence of neutral sub-3 nm par-ticles and their importance in NPF, for example, in boreal forest (Kulmala et al., 2007, 2013), whereas some modeling studies claim that ion-mediated mechanisms dominate NPF there (Yu and Turco, 2000, 2008). Part of this controversy has been due to the inability to directly detect neutral clusters and sub-3 nm particles.
In recent years, the number of studies about the concen-trations of atmospheric sub-3 nm particles has been increas-ing (Lehtipalo et al., 2010; Jiang et a., 2011a; Kulmala et al., 2013; Yu et al., 2014, 2016; Rose et al., 2015; Xiao et al., 2015; Kontkanen et al., 2016). However, the existing lit-erature mainly comprises concentration data from campaign measurements in specific environments. Also, the chemical composition and sources of sub-3 nm particles (natural or an-thropogenic) and their precursors in different environments are still largely unknown. In addition, it is unclear if neu-tral sub-3 nm particles exist in all environments or if ions dominate the sub-3 nm particle population in some condi-tions. Reflecting this, the terminology for sub-3 nm particles has also been variable: they have been called, e.g., nano-CN (nanometer-sized condensation nuclei), nano-particles, clus-ters, or seeds, depending on the reference (McMurry et al., 2011). For convenience, in this article we refer to all mea-sured sub-3 nm particles as particles, even though some of them can be ions, clusters, or even big molecules that are ac-tivated by the supersaturated vapor in condensation particle counters (CPCs), similarly as they could be activated in the atmosphere.
Until recently, measurements of atmospheric aerosol parti-cles have been limited to the sizes above∼3 nm, which is the lowest detection limit of conventional ultrafine CPCs (Mc-Murry, 2000). Sporadic measurements at smaller sizes have been reported, often with custom-made or modified instru-ments (e.g., Mordas et al., 2008; Sipilä et al., 2008, 2009; Lehtipalo et al., 2009, 2010, 2011), but the data sets are not directly comparable due to differences in techniques and measured size ranges. The development of the Neutral clus-ter and Air Ion Spectromeclus-ter (NAIS) opened up the pos-sibility to conduct systematic studies of ion concentrations down to 0.8 nm in mobility diameter and of the total concen-trations, including both charged and neutral particles, down to about 2 nm (Kulmala et al., 2007; Manninen et al., 2009; Mirme and Mirme, 2013). The lowest size limit of the total concentration measurement with the NAIS is limited by the
size distribution of the corona ions used to charge the sample (Manninen et al., 2011). The development of CPCs using di-ethylene glycol (DEG) as a condensing vapor, which started after the study by Iida et al. (2009), has pushed the cutoff size of CPCs down to about 1 nm (Vanhanen et al., 2011; Jiang et al., 2011b; Kuang et al., 2012; Wimmer et al., 2013). Technically, all these CPCs consist of two stages: in the first stage DEG is used to pre-grow particles, and in the second stage particles are grown further and counted by a conven-tional CPC. This new technology has played a key role in filling the gap between aerosol and mass spectrometric mea-surements and increasing the understanding of NPF starting from the molecular level (e.g., Kirkby et al., 2011; Kulmala et al., 2012, 2013, 2014; Almeida et al., 2013; Schobesberger et al., 2013; Kirkby et al., 2016). Here, we focus on the mea-surements performed with the particle size magnifier (PSM), which is the first commercially available DEG-based CPC (Vanhanen et al., 2011).
In this article, we review atmospheric measurements of sub-3 nm particle concentrations conducted with the PSM by different research groups. The measurement sites cover a wide range of different environments from a clean mountain top in France to very polluted Chinese megacities. Most of the data sets were obtained from 1–2 month intensive mea-surement campaigns, but we also present two longer-period and previously unpublished data sets from a boreal forest site and an urban environment in southern Finland. These mea-surements allow us to investigate the seasonal variation in sub-3 nm particles. The objective of this study is to provide the first comparison on the concentrations and dynamics of sub-3 nm particles in different environments. More specifi-cally, we aim to get insights into (i) the concentration levels of sub-3 nm particles in different environments and their vari-ation on a daily and seasonal basis, (ii) the fraction of ions of all sub-3 nm particles, and (iii) the possible sources and sinks of sub-3 nm particles.
2 Methods 2.1 The PSM
The operation principle of the PSM is based on a mixing-type CPC. The heated saturated flow is mixed turbulently with the colder sample flow to create supersaturation in the mixing region. DEG vapor starts to condense on particles in the mixed flow, and the particles grow in the growth tube of the instrument until they reach diameters of about 90 nm. Af-ter that the particles are sampled into a regular CPC for the further growth by the condensation of another vapor (usually butanol), and they are finally counted by an optical detec-tor. The advantage of a mixing-type design is that the mixing ratio of the saturated and sample flow can be quickly and ac-curately adjusted by changing the saturator flow rate. This af-fects the supersaturation level which the particles encounter in the instrument and thus the cutoff size of the instrument. Comparing concentrations measured with CPCs at different cutoff sizes has often been used as a method to estimate the concentration of particles in the size range between the cutoff sizes (Alam et al., 2003; Kulmala et al., 2007). The PSM can be operated in a so-called scanning mode, in which the satu-rator flow and therefore also the cutoff size is changed contin-uously, which enables the measurement of particle size distri-butions (Gamero-Gastãno and Fernández de la Mora, 2000; Vanhanen et al., 2011; Lehtipalo et al., 2014). However, ac-curate calibrations are required for getting size information from measurements in the scanning mode.
Calibration methods in the sub-3 nm size range have evolved in recent years (Ude and Fernàndez de la Mora, 2005; Sipilä et al., 2009; Kangasluoma et al., 2014, 2015; Wimmer et al., 2015). Even so, the accuracy of calibrations is still limited by two factors. First, most of the calibrations are performed using electrically charged particles, as the size selection of particles is done based on their electrical mobil-ity and an electrometer is used as the reference instrument for concentration. However, neutral particles need higher su-persaturation to be activated in a CPC than charged particles (Winkler et al., 2008; Kangasluoma et al., 2016a). Second, the chemical composition of particles significantly affects their activation in DEG-based CPCs (Jiang et al., 2011b; Kangasluoma et al., 2014, 2016a). For more discussion on the uncertainties caused by the charging state and chemical composition of particles, see Sect. 2.2.
The PSMs used in this study have been calibrated either with tetra-alkyl ammonium halides used as mobility stan-dards (Ude and Fernàndez de la Mora, 2005), tungsten ox-ide particles (Vanhanen et al., 2011), or ammonium sulfate clusters (Wimmer et al., 2013; Kangasluoma et al., 2014). The operation temperatures of each instrument were adjusted during the initial calibration so that only a few counts from homogenous nucleation were allowed at the highest satura-tor flow rates. The PSMs used in Helsinki and in Hyytiälä in 2015–2016 had an automatic background measurement sys-tem (Kangasluoma et al., 2016b), and they were thus allowed to have a higher background to maximize the activation ef-ficiency for organic clusters. The background counts were subtracted from the data during the data analysis. The
con-centration range measurable with the PSM is mainly depen-dent on the counter CPC.
The data measured in the scanning mode of the PSM need to be inverted to get a size distribution. Two methods have been presented by Lehtipalo et al. (2014). The first one as-sumes a step-function-like cutoff curve for each saturator flow rate of the PSM. The difference in concentration be-tween two flow rates (which determine the size bin limits) is corrected only by the detection efficiency at the mean size of the bin to obtain the concentration in that size bin. This method resembles estimating the concentration of small par-ticles by comparing the readings of two CPCs at different cutoff sizes. The second method takes into account the mea-sured activation curves for each saturator flow rate and uses a nonnegative matrix inversion routine to calculate the size distribution. This method tends to lead to slightly higher con-centrations than the first method, which is partly due to re-jecting negative values resulting from fluctuations in the total concentration before data inversion and partly due to more accurate corrections for the detection efficiency, which can have a large effect at the smallest sizes. In addition, all the data sets have been corrected for particle losses in the sam-pling lines (Kulkarni et al., 2001).
The different PSMs used in this study had slightly differ-ent lowest and highest cutoff sizes, and differdiffer-ent size bins were used during the data inversion. Due to this and the un-certainties in determining the exact size limits (see Sect. 2.2), we chose to use the maximum size range available from the PSMs, which was from∼1 to∼2–3 nm for the PSMs op-erated in the scanning mode. If the largest size was smaller than 3 nm or if the PSM had not been operated in the scan-ning mode, we obtained the∼1–3 nm concentration from the difference in the concentration measured with the PSM and another aerosol instrument with the cutoff size of 3 nm, i.e., a differential mobility particle sizer (DMPS) or a scanning mobility particle sizer (SMPS). This way we aimed to obtain sub-3 nm particle concentrations for different sites in as simi-lar size ranges as possible. Finally, when comparing different data sets, we calculated 30 min medians of all data. The time resolution of the PSM is 4 min in the scanning mode when averaging over an upward and a downward scan. The time resolution of the DMPS is typically 10 min, while the SMPS has a time resolution of about 3 min.
2.2 Measurement uncertainties
particles than it is for neutral ones. If the majority of atmo-spheric sub-3 nm particles are assumed to be electrically neu-tral, the effect of charge can be taken into account by shift-ing the calibration to larger sizes, in which case the uncer-tainty in the cutoff size due to the charging state is reduced to±0.15 nm. On the other hand, the chemical composition of particles can affect the cutoff size of the PSM even more than the charging state. Inorganic particles are activated more ef-ficiently by DEG vapor than organic particles, and thus their cutoff size can even be 1 nm lower than that of organic ticles (Kangasluoma et al., 2014, 2016a). For inorganic par-ticles the changes in the composition lead to about±0.2 nm uncertainty in the cutoff size (Kulmala et al., 2013). Recent chamber experiments, mimicking atmospheric particle for-mation, indicate that if inorganic and organic precursor va-pors are simultaneously present, they both participate in par-ticle formation (Schobesberger et al., 2013). Therefore, when performing ambient measurements with the PSM, the cutoff diameters are likely somewhere between low cutoff diame-ters detected for pure inorganic clusdiame-ters in laboratory exper-iments and high cutoff diameters detected for pure organic clusters.
In addition to the properties of the particles, ambient con-ditions can also affect the cutoff size of the PSM. The de-tection efficiency of the PSM has been observed to increase when the humidity of the sample flow is increased (Kan-gasluoma et al., 2013). Thus, the changes in the water con-tent of ambient air can induce changes in the cutoff size of the PSM. However, the diurnal cycle of air humidity can be estimated to have only a negligible effect on the PSM cutoff size (less than±0.1 nm) when considering the results of lab-oratory experiments by Kangasluoma et al. (2013) and the typical diurnal variation in air humidity. On the other hand, the seasonal cycle of air water content can be expected to have a larger effect on the cutoff size. Thus, to keep the cut-off sizes of the PSM constant in long-term measurements, regular background measurements need to be performed.
In addition to PSM measurements, DMPS and SMPS mea-surements were utilized to obtain sub-3 nm particle concen-trations, which introduces additional uncertainty into our re-sults. According to Wiedensohler et al. (2012), uncertain-ties in the size distribution measurements performed with a DMPS or SMPS system can be higher than 10 % for particles smaller than 3 nm. The measurements with the NAIS were also utilized at some of the sites. By comparing ion concen-trations measured with the NAIS to the concenconcen-trations mea-sured with the PSM, the fraction of ions of all sub-3 nm par-ticles was determined. This fraction is subject to uncertain-ties in ion measurements of the NAIS as well as the above-mentioned uncertainties in PSM measurements. Wagner et al. (2016) investigated the accuracy of the ion measurements conducted with the NAIS and concluded that the size infor-mation given by the NAIS is very accurate down to about 1.5 nm size, while the concentrations of the smallest (< 5 nm) ions are often underestimated.
In addition to instrumental uncertainties, one also needs to consider the limitations in the comparability of the data from different sites, caused by differences in the measurement tails. Due to the different settings of each PSM, which de-termine the level of supersaturation inside the instrument, and different calibrations, different PSMs had different cut-off sizes. In addition, when inverting the data to obtain parti-cle size distributions, different size bins were chosen for dif-ferent data sets. For these reasons, the size ranges measured with the PSM were not exactly same at different measure-ment sites (see Table 1). The differences in the lowest limit of the size range can particularly affect the comparability of the data. Furthermore, at different measurement sites, inlet systems were different (see Sect. 2.3), which may also affect the obtained sub-3 nm particle concentrations if the sampling line losses are not well characterized.
2.3 Measurement sites and instrumentation
In this study, PSM measurements from nine sites around the world were analyzed (Fig. 1). Measurements at each site are described below. In addition, the instruments used at different sites, the measurement time periods, and the size ranges for particle measurements are summarized in Table 1.
2.3.1 Hyytiälä (HTL)
In Hyytiälä measurements were conducted at the SMEAR II station (Station for Measuring Forest Ecosystem-Atmosphere Relations) in southern Finland (61◦5′N,
24◦17′E; 181 m above sea level) (Hari and Kulmala, 2005).
Figure 1.A map showing the locations of the measurements sites.
Table 1.Overview of the measurements analyzed in this study.
Measurement site Instruments Time period Size range (nm)
Hyytiälä (HTL 10 aut) PSMproto∗, DMPS, NAIS 4–27 Aug 2010 1.3–3.0
Hyytiälä (HTL 11 spr) PSMA09, DMPS, NAIS 17 Mar–1 Apr 2011 1.1–3.0 Hyytiälä (HTL 11 aut) PSMA09, DMPS, NAIS 23 Aug–11 Sep 2011 1.1–3.0
Hyytiälä (HTL 12) PSMA09, DMPS, NAIS 19 Apr–9 May 2012 1.3–3.0
Hyytiälä (HTL 13) PSMA10, DMPS, NAIS 1 May–23 Jul 2013 1.3–3.0
Hyytiälä (HTL 14) PSMA11, DMPS, NAIS 3 Apr–30 May 2014 1.0–3.0
Hyytiälä (HTL 15) PSMA11, DMPS, NAIS 8 May 2015–30 Apr 2016 1.1–3.0 San Pietro Capofiume (SPC) PSMA09, DMPS, NAIS 9 Jun–9 Jul 2012 1.5–3.0
Puy de Dôme (PDD) PSMA09, SMPS, NAIS 16 Jan–29 Feb 2012 1.3–2.5
Brookhaven (BRH) PSMA09∗, SMPS 22 Jul–14 Aug 2011 1.3–3.0
Kent (KNT) PSMA09∗, SMPS 15 Dec 2011–6 Jan 2012 1.3–3.0
Centreville (CTR) PSMA09, SMPS 1 Jun–15 Jul 2013 1.1–2.1
Shanghai (SH) PSMA11 25 Nov 2013–23 Jan 2014 1.3–3.0
Nanjing (NJ) PSMA11, NAIS 1 Dec 2014–31 Jan 2015 1.1–3.0
Helsinki (HEL) PSMA11, DMPS 8 Jan 2015–31 Dec 2015 1.1–3.0
∗The PSM was not operated in the scanning mode.
air through a 40 cm long tube, and the actual sample (2.5 lpm) was taken from the middle of the flow with a probe (core sampling). An automatic background measurement was per-formed every third hour using filtered ambient air.
In addition to the PSM, measurements with a twin-DMPS system (Aalto et al., 2001) were utilized. The DMPS sys-tem measured the particle size distribution between 3 and 1000 nm. Thus, by subtracting the total particle concentra-tion measured with the DMPS from the concentraconcentra-tion mea-sured with the highest cutoff size of the PSM, the particle concentration in the size range of ∼2–3 nm was obtained. Furthermore, the ion size distribution between 0.8 and 42 nm was measured with the NAIS (Manninen et al., 2016). From these measurements, the concentration of sub-3 nm ions was obtained. The results of PSM measurements conducted dur-ing sprdur-ing 2011 in Hyytiälä have been published by Kulmala et al. (2013).
2.3.2 Helsinki (HEL)
In Helsinki, measurements were performed at the SMEAR III station (60◦12′N, 24◦58′E; 26 m above sea level) (Järvi
the PSM was done by using an inlet system identical to the inlet used in Hyytiälä after 2014, including a core sampling probe and automatic background measurements (Kangaslu-oma et al., 2016b). Similarly to the procedure in Hyytiälä, a twin-DMPS system (Aalto et al., 2001) was used to mea-sure the particle size distribution in the size range from 3 to 800 nm. Therefore, the concentration between 2 and 3 nm was obtained by subtracting the total particle concentration measured with the DMPS from PSM measurements.
2.3.3 San Pietro Capofiume (SPC)
The San Pietro Capofiume meteorological station is situated in northern Italy (44◦39′N, 11◦37′E; 11 m above sea level).
The station is located in the Po Valley with high emissions of anthropogenic pollutants, about 30 km northeast of the city of Bologna. The surroundings of the site are flat and homoge-nous, mainly consisting of harvested fields (Decesari et al., 2001). The measurements with the PSM A09 were conducted at the station in June–July 2012 during the PEGASOS (Pan-European Gas–Aerosol–Climate Interaction Study) zeppelin campaign (see Table 1). The cutoff sizes of the PSM were 1.5 and 1.8 nm. In addition to the PSM, a twin-DMPS system covering the size range of 3–600 nm (Laaksonen et al., 2005) was operated. Thus, by combining PSM and DMPS measure-ments the particle concentration in the size range of 1.5–3 nm was obtained. In addition, the ion concentration for the same size range was obtained from NAIS measurements. The re-sults of these measurements, focusing on the analysis of NPF events, have been presented by Kontkanen et al. (2016).
2.3.4 Puy de Dôme (PDD)
The Puy de Dôme measurements site is located at the top of the Puy de Dôme mountain in central France (45◦46′N,
2◦46′E; 1465 m above sea level). The station is surrounded
by fields and forests. The closest town, Clermont-Ferrand, is located about 16 km east of the mountain at 396 m above sea level and has a population of about 150 000. See Venzac et al. (2009) for a more detailed description of the measurement site. The PSM A09 was operated at the station in January– February 2012 (see Table 1). From the PSM measurements, the particle concentration between 1.0 and 2.5 nm was ob-tained. Furthermore, the ion concentration in the same size range was obtained from NAIS measurements. A custom-made SMPS measuring the particle size distribution between 10 and 420 nm was also operated at the site. The SMPS was based on a TSI differential mobility analyzer (DMA) and a CPC (TSI 3010), and the sheath flow rate was con-trolled using a blower in a closed-loop arrangement. The data measured when relative humidity (RH) exceeded 98 % were omitted from the analysis, as high values of RH indicate that the station was inside a cloud (Rose et al., 2015). Rose et al. (2015) have published the results of this measurement campaign, concentrating on NPF events in the free
tropo-sphere (FT) and at the interface between the boundary layer and the FT.
2.3.5 Kent (KNT)
The measurements in Kent, Ohio, were conducted at the Kent State University’s campus (41◦9′N, 81◦22′W; 320 m
above sea level). Kent is a small Midwestern town with about 30 000 inhabitants. The closest larger cities are Akron (30 km west of Kent), Cleveland (60 km northwest), and Pittsburgh (100 km east). Measurements with the PSM A09 were per-formed between December 2011 and January 2012 (see Ta-ble 1). The PSM was operated with the fixed saturator flow corresponding to the cutoff size of∼1 nm. During the mea-surements, the ambient air was drawn at a flow rate of 3000 lpm into an air duct (1.5 m long and 10 cm in diame-ter) to which the PSM was directly connected via a 4 cm tube (0.64 cm in diameter). In parallel to the PSM measurements, the concentrations of particles in the size range of 3–478 nm were measured with a combination of a nano SMPS (con-sisting of a TSI DMA 3085 and a TSI CPC 3776) and a long SMPS (consisting of a TSI DMA 3081 and a TSI CPC 3772) (see Yu et al., 2014, for more details). Thus, the concentra-tion of particles between 1 and 3 nm was obtained by sub-tracting the total particle concentrations measured with the SMPSs from concentrations measured with the PSM. The re-sults of these measurements, together with the measurements from Brookhaven (see below), have been presented in Yu et al. (2014).
2.3.6 Brookhaven (BRH)
In Brookhaven, New York, measurements were performed at Brookhaven National Laboratory on Long Island (40◦52′N,
72◦53′W; 24 m above sea level). The site is located 80 km
east of New York City. The Long Island Sound is 16 km north of the site and the coast of Atlantic Ocean 25 km south. The measurement site is located within an urban neigh-borhood and surrounded by a mixed deciduous forest. The measurements with the PSM A09 were conducted in July– August 2011 (see Table 1). Similarly to the procedure in Kent, the PSM had a fixed cutoff of about 1 nm, and the parti-cle concentration between 1 and 3 nm was obtained by com-bining PSM measurements with the SMPS measurements. The SMPS system in Brookhaven was similar to that used in Kent. During the measurements, ambient air was drawn into the instrument container at a flow rate of 150 lpm using a 2.1 m tube (5.08 cm in diameter), and the PSM sampled from a split flow of 30 lpm with a 30 cm tube (2.54 cm in diame-ter). See Yu et al. (2014) for a more detailed description of these measurements.
2.3.7 Centreville (CTR)
landscape surrounding the research site is a mix of agri-cultural lands and mixed deciduous forests. Isoprene is the dominant BVOC emitted from forests, while agricultural lands have low emission rates of isoprene and monoter-penes. The strongest pollutant emission sources of NOx (17 000 tons yr−1) and SO
2 (92 000 tons yr−1) in the state of Alabama are located within 100 km of the site (You et al., 2014). The measurements with the PSM A09 were conducted at the site during the SOAS (Southern Oxidant and Aerosol Study) campaign in June–July 2013 (see Table 1). From the PSM measurements the particle size distribution between 1.1 and 2.1 nm was obtained. In addition, two SMPSs (TSI 3936) were used to measure the particle size distribution in the combined size range from 3 to 740 nm. One SMPS had a Nano DMA (TSI 3085) and a TSI 3786 water CPC. The sec-ond SMPS had a long DMA (TSI 3081) coupled with a TSI 3772 butanol CPC.
2.3.8 Shanghai (SH)
The measurements in Shanghai were conducted on the cam-pus of Fudan University (31◦18′N, 121◦30′E) at about 20 m
height from the ground. The site is located northeast of the center of Shanghai, which is the largest city in China with about 24 million inhabitants. One of the city’s main high-ways is located 100 m south of the measurement site. The measurements with the PSM A11 were performed between November 2013 and January 2014 (see Table 1). The PSM was operated in the scanning mode, and the particle concen-tration between 1 and 3 nm was obtained from the measure-ments. In addition, a combination of a nano SMPS (consist-ing of a TSI DMA 3085 and a TSI CPC 3776) and a long SMPS (consisting of a TSI DMA 3081 and a TSI CPC 3775) was used to measure the particle size distribution between 3 and 615 nm. During the measurements, ambient air was drawn into a 5.0 m manifold (10.16 cm in diameter) at a flow rate of 4332 lpm. From this manifold, air was drawn at a flow rate of 1.75 lpm through an 18 cm tube (0.64 cm in diameter) and diluted with zero air flow at a ratio of 1:1 before enter-ing the PSM. Xiao et al. (2015) have published the results of these measurements, discussing especially the formation and growth rates of particles.
2.3.9 Nanjing (NJ)
In Nanjing measurements were performed at the Station for Observing Regional Processes of the Earth System (SOR-PES), which is situated about 20 km east of suburban Nan-jing (Ding et al., 2013). The site is located on top of a hill on the Xianlin campus of Nanjing University (118◦57′E,
32◦07′4 N; 40 m above sea level). The measurements with
the PSM A11 were conducted between December 2014 and January 2015 (see Table 1). The PSM was operated in the scanning mode and five size bins between 1 and 3 nm were used for the inversion. In addition, AIS (air ion spectrometer;
Mirme et al., 2007) measurements were conducted, provid-ing ion concentrations in the same size range (Hermann et al., 2013). The particle size distribution between 6 and 800 nm was also measured with a DMPS (Qi et al., 2015).
2.3.10 Supporting data
In addition to the measurements of sub-3 nm particle and ion concentrations, other data recorded at the measurement sites were utilized in the analysis. These data included different meteorological variables (e.g., temperature, RH, and radia-tion) and trace gas concentrations (e.g., SO2and NOx). Con-densation sink (CS), which describes the loss rate of vapor due to condensation on preexisting aerosol particles (Kul-mala et al., 2001), was calculated from particle size distri-bution data measured with the DMPS or the SMPS. In ad-dition, the concentration of sulfuric acid was measured with a CIMS (chemical ionization mass spectrometer; Eisele and Tanner, 1993) in Kent and Brookhaven (Yu et al., 2014), and in Hyytiälä during spring 2011 (Kulmala et al., 2013). For other measurement campaigns, sulfuric acid concentration was estimated using a proxy. For Hyytiälä the proxy in Petäjä et al. (2009) was used, as it has been derived and validated with measurements from this specific site. For other mea-surement sites, the proxy presented in Mikkonen et al. (2011) was utilized as it has been developed based on data from sev-eral different measurements sites.
3 Results and discussion
3.1 Sub-3 nm particle concentrations and their variation at different sites
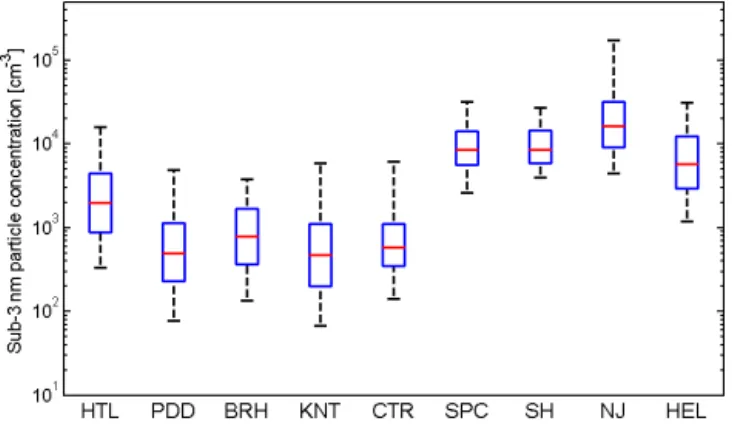
concentra-Figure 2.The variation in sub-3 nm particle concentration at differ-ent measuremdiffer-ents sites. The red lines show the medians, the blue boxes indicate the 25th and 75th percentiles, and the vertical bars show the 5th and 95th percentiles.
tions were 4.7×10², 8.0×10², and 5.9×102cm−3, respec-tively.
The observed differences in sub-3 nm particle concentra-tions indicate that their formation is generally favored in pol-luted environments (see Sect. 3.4.1, where sulfuric acid con-centration and condensation sink at different sites are com-pared). This can be explained by the high concentrations of low-volatile precursor vapors, which originate from, e.g., fuel combustion and traffic and can form small particles in the atmosphere (e.g., Arnold et al., 2012; Karjalainen et al., 2015; Sarnela et al., 2015). Some of the traffic-related par-ticles may also be primary and formed inside vehicle en-gines (Jayaratne et al., 2010; Karjalainen et al., 2014; Alanen et al., 2015). At sites with lower anthropogenic influence, like Puy de Dôme, lower sub-3 nm particle concentrations were observed, which is likely due to the lower concentra-tions of precursor vapors and the absence of primary parti-cle sources. On the other hand, in pristine environments the emissions of organic vapors from vegetation may promote the formation of sub-3 nm particles (Ehn et al., 2014). Inter-estingly, sub-3 nm particle concentration was clearly higher in a Finnish boreal forest, where BVOC emissions are domi-nated by monoterpenes, than in Centreville, southeastern US, where isoprene emissions dominate (Xu et al., 2015). Earlier, Kanawade et al. (2011) observed that NPF events are less frequent in mixed deciduous forests than in boreal forests, which they attributed to high emissions of isoprene.
When comparing concentrations between different sites, the median particle concentrations observed in Brookhaven and Kent can be considered to be relatively low compared to other urban sites. The low concentrations may be due to, for example, the properties of particles or ambient conditions, which can affect the detection efficiency of the PSM, or tech-nical reasons, such as the settings of the PSM or losses in the sampling lines (see also Sect. 2.2). Furthermore, one should note that measurements at different sites were conducted at different times of the year. Therefore, a possible seasonal
variation in sub-3 nm particle concentration due to the varia-tion in their sources and sinks may bias the comparison. For example, in Kent and Puy de Dôme, where the median con-centrations were lowest of all sites, the measurements were conducted in winter when the photochemical production of precursor vapors and the emissions of biogenic vapors can be expected to be lower than in summer. The boundary layer dy-namics may also affect concentrations especially at the high-altitude Puy de Dôme site: in winter the station is often above the boundary layer, which prevents the transport of precursor vapors from near-ground sources to the site (Venzac et al., 2009).
3.1.2 Interannual variability in sub-3 nm particle concentration in Hyytiälä
Figure 3 presents sub-3 nm particle concentrations in Hyytiälä during different measurement campaigns starting from the first field measurements performed with the PSM in 2010 (see also Table 3). The data from 2015–2016, cov-ering 1 year, were divided into spring (March–May), sum-mer (June–August), autumn (September–November), and winter (December–February) to enable the comparison to other years’ shorter measurement periods. Sub-3 nm parti-cle concentration seems to have a parti-clear seasonal variation in Hyytiälä (see also Sect. 3.1.3 and 3.2.2). The median con-centrations were higher during measurements performed in spring and summer (9.4×10²–5.4×103cm−3) than in au-tumn and winter (5.8×10²–1×103cm−3). The measure-ments from different years agree rather well, despite the dif-ferences in the instrument model and the exact settings of the PSM and the sampling lines, which can affect the cutoff size of the instrument and particle losses. It needs to be noted, though, that in spring 2016 sub-3 nm particle concentration was on average lower than in other springs. This may be re-lated to untypical environmental conditions, as the frequency of NPF events was clearly lower in that spring compared to other years (Table 3). The connection between sub-3 nm particle concentrations and environmental conditions is fur-ther discussed in Sect. 3.4. Generally, the median value and the variation in sub-3 nm particle concentration observed in the spring campaigns compare well to the concentrations re-ported by Lehtipalo et al. (2009, 2010), who measured 1.5– 3 nm particles with a pulse-height CPC in Hyytiälä during spring 2007 and 2008.
3.1.3 Particle concentrations in different size bins in Hyytiälä and Helsinki
Figure 3.Sub-3 nm particle concentrations in Hyytiälä during different measurement campaigns. The red lines show the medians, the blue boxes indicate the 25th and 75th percentiles, and the vertical bars show the 5th and 95th percentiles. Note that the data from 2015–2016 are divided into different seasons: summer (sum), autumn (aut), winter (wint), and spring (spr).
Table 2.Medians of sub-3 nm particle concentration, the ratio of ion concentration to the total sub-3 nm particle concentration, sulfuric acid concentration, condensation sink, and the frequency of new particle formation (NPF) events at different measurement sites. Sulfuric acid concentration is estimated from a proxy for all other campaigns except those that are marked with an asterisk (∗). The explanations for
abbreviations, the measurement periods and the exact size ranges for particle measurements are shown in Table 1. Data from Hyytiälä (HTL) and Helsinki (HEL) are divided into different seasons: spring (spr), summer (sum), autumn (aut), and winter (wint).
Measurement Sub-3 nm particle Ions to all Sulfuric acid Condensation NPF event site concentration particles ratio concentration sink frequency
(cm−3) (cm−3) (s−1) ( %)
HTL spr 2.9E+03 0.16 1.0E+06 2.6E−03 40
HTL sum 2.0E+03 0.33 2.4E+05 3.6E−03 19
HTL aut 7.9E+02 0.83 2.6E+05 2.0E−03 15
HTL wint 5.8E+02 0.71 6.9E+05 2.1E−03 0
SPC 8.5E+03 0.004 1.0E+07 1.2E−02 86
PDD 5.0E+02 0.60 3.8E+06 3.6E−03 23
BRH 8.0E+02 – 3.3E+05∗ 6.7E−03 17
KNT 4.7E+02 – 9.4E+05* 6.7E−03 22
CTR 5.9E+02 0.47 4.0E+04* 1.5E−02 9
SH 8.5E+03 – 3.1E+07 7.6E−02 21
NJ 1.7E+04 0.02 2.0E+07 2.7E−02 20
HEL spr 7.8E+03 – 2.0E+06 4.1E−03 13
HEL sum 5.1E+03 – 2.5E+06 5.3E−03 4
HEL aut 4.1E+03 – 9.2E+05 4.3E−03 12
HEL wint 6.9E+03 – 2.2E+05 3.6E−03 8
∗Sulfuric acid concentration was measured.
investigate the seasonal variation in particle concentrations, the data sets were divided into spring (March–May), summer (June–August), autumn (September–November), and winter (December–February). The particle concentrations in differ-ent size bins in these seasons are presdiffer-ented in Table 4. Note that, for clarity, only the size bin limits used in 2015–2016 are marked in the table.
A seasonal variation in particle concentrations was ob-served at both sites. In Hyytiälä, sub-3 nm particle concen-tration was higher in summer and spring than in winter and autumn. In the sub-2 nm size bins the concentrations were highest in summer; this was clear especially in the smallest
Table 3.Medians of sub-3 nm particle concentration, the ratio of ion concentration to the total sub-3 nm particle concentration, sulfuric acid concentration, condensation sink, and the frequency of new particle formation (NPF) events in Hyytiälä during different measurement campaigns. Sulfuric acid concentration is estimated from a proxy for all other campaigns except in spring 2011.
Measurement Sub-3 nm particle Ions to all Sulfuric acid Condensation NPF event campaign concentration particles ratio concentration sink frequency
(cm−3) (cm−3) (s−1) ( %)
HTL 10 aut 6.7E+02 0.56 4.1E+05 3.1E−03 8
HTL 11 spr 2.7E+03 0.17 1.1E+06∗ 1.8E−03 75
HTL 11 aut 7.2E+02 0.76 6.9E+05 2.8E−03 10
HTL 12 spr 3.2E+03 0.10 4.1E+05 2.2E−03 62
HTL 13 sum 4.5E+03 0.10 2.0E+05 3.8E−03 37
HTL 14 spr 5.4E+03 0.09 3.8E+05 2.9E−03 48
HTL 15 sum 2.1E+03 0.37 2.1E+05 3.6E−03 12
HTL 15 aut 1.0E+03 0.83 2.2E+05 2.0E−03 17
HTL 15 wint 5.8E+02 0.71 6.9E+05 2.1E−03 0
HTL 16 spr 9.4E+02 0.57 4.0E+05 2.6E−03 13
∗Sulfuric acid concentration was measured.
Table 4.Medians of the total particle concentration and the ratio of ion concentration to the total particle concentration in four size bins (1.1–1.3, 1.3–1.5, 1.5–2, and 2–3 nm) in Hyytiälä (HTL) in 2011 and 2015–2016 and in Helsinki (HEL) in 2015. Data are divided into different seasons: spring (spr), summer (sum), autumn (aut), and winter (wint).
Measurement site Particle concentration (cm−3) Ions to all particles ratio Size range (nm) 1.1–1.3 1.3–1.5 1.5–2.0 2.0–3.0 1.1–1.3 1.3–1.5 1.5–2.0 2.0–3.0
HTL spr 4.6E+02 1.6E+02 7.8E+01 3.0E+02 0.75 1.02 0.78 0.03 HTL sum 1.1E+03 2.2E+02 1.3E+02 1.9E+02 0.34 1.25 0.89 0.06 HTL aut 3.8E+02 1.5E+02 9.0E+01 1.1E+02 1.05 1.45 1.02 0.07 HTL wint 2.4E+02 6.8E+01 4.2E+01 1.7E+02 1.05 1.36 0.79 0.03
HEL spr 2.3E+03 6.7E+02 7.5E+02 2.2E+03 – – – –
HEL sum 1.2E+03 3.9E+02 4.1E+02 1.9E+03 – – – –
HEL aut 1.1E+03 3.7E+02 3.2E+02 1.9E+03 – – – –
HEL wint 2.1E+03 8.6E+02 7.2E+02 2.1E+03 – – – –
the concentration in the 2–3 nm size range, while in spring and winter the difference was only a factor of 2–2.5. This may indicate that in summer and autumn sub-2 nm particles are not able to grow to sizes larger than 2 nm efficiently. In spring, environmental conditions in Hyytiälä are favorable for particle growth, as indicated by frequent NPF events (Ta-ble 2; Dal Maso et al., 2005), which probably explains why the difference between the size bins was then smaller. In win-ter, on the other hand, particle concentrations were low in all size bins.
In Helsinki differences in particle concentrations between different seasons were less distinct than in Hyytiälä. The highest concentrations were detected in spring and winter. In the smallest size bin (1.1–1.3 nm) the median concen-tration varied between 1.1×10³and 2.3×103cm−3in dif-ferent seasons and in the largest size bin (2–3 nm) between 1.9×10³and 2.2×103cm−3. The high wintertime concen-trations suggest that in Helsinki the formation of sub-3 nm particles is unlikely to be driven by the emissions of organic
compounds from biogenic sources. In Helsinki the ratio of 1.1–2 to 2–3 nm particle concentrations varied between 1 and 2 in different seasons, and it was highest in winter and spring and lowest in summer and autumn. The lower value of this ratio in Helsinki compared to Hyytiälä indicates that parti-cle growth may be favored in an urban environment with stronger anthropogenic influence compared to clean boreal forest (Kulmala et al., 2005). It should be kept in mind, though, that the composition of particles can be different in different environments, which can affect their activation probability in the PSM (see Sect. 2.2).
3.2 Diurnal variation in sub-3 nm particle concentration
3.2.1 Diurnal variation at different sites
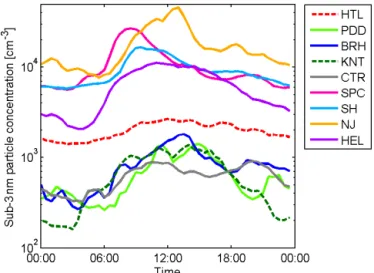
Figure 4.The median diurnal variation in sub-3 nm particle con-centration at different measurement sites.
are obvious also here: sub-3 nm particle concentration was high at sites with strong anthropogenic influence and lower in cleaner environments. Generally, sub-3 nm particle con-centrations were highest during the daytime and lowest at night. Still, at many sites moderate concentrations were ob-served also at night. The highest daytime and nighttime con-centrations were detected in Nanjing, Shanghai, and San Pietro Capofiume. The next highest concentrations were ob-served in Helsinki, where particle concentration was high from around 08:00 to 16:00 LT (local time). In Hyytiälä sub-3 nm particle concentration was lower than in these urban sites, and the median diurnal cycle of concentration was also clearly weaker. It needs to be noted, though, that in Hyytiälä the diurnal cycle had a strong seasonal variation, which is discussed in the next section (Sect. 3.2.2). In Kent, Brookhaven, and Puy de Dôme, sub-3 nm particle concen-trations were low but had a similar diurnal cycle to other sites: the concentrations were lowest early in the morning and highest around noon. In Brookhaven particle concentra-tion addiconcentra-tionally had a secondary maximum in the evening after 19:00 LT. In Centreville sub-3 nm particle concentration had a minimum early in the morning and two separate max-ima; the first maximum occurred before noon and the second in the evening around 20:00 LT.
The observed daytime maxima in sub-3 nm particle con-centrations likely result from the photochemical production of low-volatile precursor vapors during the daytime and the emissions of precursor vapors, and possibly also primary par-ticles, from different anthropogenic and biogenic sources. Daytime maxima in sub-3 nm particle concentrations have also been reported in previous studies (Kulmala et al., 2013; Yu et al., 2014, 2016; Xiao et al., 2015; Rose et al., 2015; Kontkanen et al., 2016), where they have often been linked to NPF events. On the other hand, the daytime increase in sub-3 nm particle concentration is not necessarily followed
by an NPF event where particles grow to large sizes (Yu et al., 2014, 2016; Xiao et al., 2015; see Sect. 3.5). At urban sites, the diurnal cycle of sub-3 nm particle concentrations can be affected by variation in traffic conditions and other anthro-pogenic activities, which could explain the wide maximum in particle concentration observed in Helsinki. Furthermore, in Puy de Dôme the diurnal variation in sub-3 nm particle concentration can be influenced by the diurnal cycle of the boundary layer height, affecting the transport of precursor vapors to the site (Venzac et al., 2009; Rose et al., 2015).
The relatively high particle concentrations observed at many sites at night suggest that the formation of sub-3 nm particles may also occur in the absence of solar radiation. This may imply the importance of low-volatile precursor va-pors originating from the oxidation of, for example, organic compounds by ozone or nitrate radical (Ehn et al., 2014). Kirkby et al. (2016) observed in their chamber experiments thatα-pinene ozonolysis products can form new particles ef-ficiently even in the absence of sulfuric acid. In Hyytiälä high concentrations of sub-3 nm particles in the evening have been reported earlier (Lehtipalo et al., 2009), and they have been proposed to be related to the ozonolysis products of monoterpenes (Lehtipalo et al., 2011). Evening maxima are frequently observed also in sub-3 nm ion concentrations in Hyytiälä (Junninen et al., 2008; Buenrostro Mazon et al., 2016). In Brookhaven Yu et al. (2014) found that the elevated concentrations of sub-3 nm particles at night were linked to marine air masses, and they were probably not connected to the oxidation of monoterpenes. In Centreville, where the evening maximum in sub-3 nm particle concentration was most distinct, BVOC emissions are dominated by isoprene (Xu et al., 2015). In earlier measurements in an isoprene-rich deciduous forest, the concentrations of 3–10 nm parti-cles were observed to increase in the evening when SO2 con-centration was high (Kanawade et al., 2011).
3.2.2 Diurnal variation in Hyytiälä and Helsinki in different seasons
To study the diurnal variation in sub-3 nm particle concen-tration in different seasons, the data sets from Hyytiälä and Helsinki (from where longer times series were available) were divided into spring, summer, autumn, and winter. Fig-ure 5 illustrates the median diurnal cycle of sub-3 nm particle concentration in Hyytiälä and Helsinki in these seasons.
Figure 5.The median diurnal variation in sub-3 nm particle con-centration in Hyytiälä (HTL; dashed lines) and in Helsinki (HEL; solid lines) in different seasons: spring (spr), summer (sum), au-tumn (aut), and winter (wint).
than in other seasons is likely related to the stronger produc-tion of low-volatile precursor vapors in these months.
In Helsinki the daytime maximum in sub-3 nm particle concentration was distinct in all seasons. Sub-3 nm particle concentration started to rise in the morning after 05:00 LT, was highest around midday, and started to decrease again after 16:00 LT. The highest concentrations were obtained in spring and lowest in autumn. The similarities in the diurnal cycle of sub-3 nm particle concentration in different seasons suggest that in Helsinki sub-3 nm particle concentrations are more affected by anthropogenic sources of precursor vapors, which typically are fairly constant throughout the year, than the emissions from biogenic sources. The fact that particle concentration started to rise in the morning at the same time in all seasons implies that the increase is not triggered by photochemistry. Instead, it may be related to the morning traffic on the nearby roads. This hypothesis is supported by the results of Järvi et al. (2008), who found that the traffic rate on the road close to the SMEAR III station increased in the morning after 05:00 LT, which coincided with the rise in black carbon concentration at the station.
3.2.3 Diurnal variation in particle concentration in different size bins
The median diurnal cycle of particle concentration in Helsinki and Hyytiälä was also studied in different sub-3 nm size bins (Fig. 6). For this, only data from the years 2011 and 2015–2016 were utilized as the size bins were most compa-rable with each other in these years (see Sect. 3.1.3).
In Hyytiälä clear differences in the diurnal cycle of par-ticle concentrations in different size bins were observed. In the size bin of 1.1–1.3 nm, the particle concentration had its strongest diurnal cycle in summer: the concentration had a
minimum in the early morning, after which it increased and stayed high between 10:00 and 21:00 LT. In other seasons, the 1.1–1.3 nm particle concentration stayed more stable. In the size bin of 1.3–1.5 nm, the particle concentration did not have a strong diurnal cycle in any season. However, in the size bins of 1.5–2 nm and 2–3 nm, the particle concentra-tion increased during the daytime in spring. This increase is probably linked to NPF events, which are most frequent in Hyytiälä in spring (Table 2). On the other hand, the high daytime concentrations of 1.1–1.3 nm particles in summer likely result from the strong production of precursor vapors, originating from biogenic sources, at this time of the year. When comparing the diurnal cycles in different size bins to the diurnal cycle of the total sub-3 nm particle concentration in Hyytiälä (Fig. 5), one can see that in summer the daytime maximum in the total sub-3 nm particle concentration was caused by the maximum in the concentration of the smallest, 1.1–1.3 nm particles, while in spring the daytime peak was mostly due to the increase in the concentration of the largest, 2–3 nm particles.
In Helsinki the diurnal cycles were quite similar in differ-ent size bins and during differdiffer-ent seasons. In all size bins, particle concentrations were lowest in the early morning (around 04:00 LT), after which they started to increase reach-ing the maximum around midday, and started to decrease again after 16:00 LT. In spring the daytime peak values were higher than in other seasons; this was clear especially in the size bins of 1.1–1.3 and 1.5–2 nm. On the other hand, night-time particle concentrations in sub-2 nm size bins were high-est in winter. In the 2–3 nm size bin, the diurnal cycles in different seasons were almost identical.
3.3 Ratio of ions to total sub-3 nm particle concentrations
3.3.1 Ion ratio at different sites
Figure 6.The median diurnal variation in particle concentration in four size bins (1.1–1.3, 1.3–1.5, 1.5–2, and 2–3 nm) in Hyytiälä (HTL; dashed lines) in 2011 and 2015–2016 and in Helsinki (HEL; solid lines) in 2015. The data are divided into different seasons: spring (spr), summer (sum), autumn (aut), and winter (wint).
can be explained by the fact that ion concentrations at the ground level are generally limited by ion production rates (Hirsikko et al., 2011). In San Pietro Capofiume, the me-dian ion to the total particle concentration ratio was as low as 0.004, and in Nanjing it was 0.02. At other sites the ion ratios were higher. In Centreville the median ion ratio was 0.5, and in Puy de Dôme it was 0.6. On the other hand, Rose et al. (2015) showed that neutral particles dominate in Puy de Dôme during NPF events. In Hyytiälä, the ion ratio ex-hibited a strong seasonal variation. The median ion ratio was rather low in spring and summer (0.2 in spring and 0.3 in summer), which is consistent with the high total sub-3 nm particle concentrations observed in these seasons. In autumn the median ion ratio was 0.8, and in winter it was 0.7, and the ratio often exceeded unity in these seasons (see the discus-sion below). Lehtipalo et al. (2009, 2010) observed the ion ratio to be only about 0.01 in springtime in Hyytiälä by com-paring ion concentrations measured with a BSMA (balanced scanning mobility analyzer) to the total concentrations from
a pulse-height CPC, but their measurements only started at about 1.3–1.5 nm.
The ion ratios exceeding unity, observed in Hyytiälä, Puy de Dôme, and Centreville, are not physical and thus indi-cate that the PSM is not able to detect all 1–3 nm ions and particles. This may be caused by uncertainties in the detec-tion efficiency of the PSM due to the properties of particles and changing environmental conditions (Kangasluoma et al., 2013, 2016a; see Sect. 2.2). Especially, it should be noted that charged particles have been observed to be activated in the PSM more efficiently than neutral particles. Therefore, it is possible that the PSM detects charged particles of a certain size but not the neutral species of the same physical size. Fur-ther work is still needed to consider these issues when con-ducting field measurements with the PSM. In addition, inac-curacies in ion concentrations measured with the NAIS may also cause uncertainties in ion ratios (Wagner et al., 2016; see Sect. 2.2).
Figure 7.The ratio of sub-3 nm ion concentration to the total particle concentration at different measurement sites. The red lines show the medians, the blue boxes indicate the 25th and 75th percentiles, and the vertical bars show the 5th and 95th percentiles. The data from Hyytiälä (HTL) are divided into different seasons: spring (spr), summer (sum), autumn (aut), and winter (wint).
is due to the pool of small ions which is constantly present in the atmosphere because of ionization of air molecules (e.g., Hirsikko et al., 2011). For example, in Hyytiälä the median size of this ion pool is about 1.1–1.3 nm (Manninen et al., 2009). Thus, the observed differences in the ion ratio between different measurement sites and different measure-ment campaigns in Hyytiälä (see Tables 2 and 3) can partly be due to differences in the studied size ranges. In the next section the ion ratio in Hyytiälä is studied separately in dif-ferent sub-3 nm size bins.
3.3.2 Ion ratio in Hyytiälä in different size bins
Table 4 shows the ratios of ion concentrations to the total par-ticle concentrations separately in four sub-3 nm size bins in Hyytiälä (data only from the years 2011 and 2015–2016). The ratio was highest in the size bins below 2 nm, as an-ticipated due to the constant pool of small ions (Manninen et al., 2009; Hirsikko et al., 2011). In the smallest size bin, 1.1–1.3 nm, the ratio was lowest in summer (median value 0.3) when the total particle concentration in that size bin was high. In spring the median ratio in this size bin was 0.8, and in autumn and winter it was 1. In the next two size bins (1.3– 1.5 and 1.5–2 nm) the ion ratio was high in all seasons, with the median ratios ranging between 0.8 and 1.5. This further demonstrates that the PSM does not detect all sub-2 nm par-ticles, as discussed in the previous section (3.3.1). On the other hand, it should be noted that during spring 2016, sub-3 nm particle concentrations observed in Hyytiälä were lower than in other years (see Table 3). This can partly explain the rather high value obtained for the springtime ion ratio. In the largest size bin, 2–3 nm, the ion ratio was low in all seasons, with the median ratios varying between 0.03 and 0.07. This is expected, as at this size range most ions originate from diffu-sion charging of neutral aerosol particles by collidiffu-sions with
the small ions or from ion-induced nucleation. In Hyytiälä 2–3 nm ions have been observed to exist almost only during NPF events (Leino et al., 2016).
3.3.3 Diurnal variation in the ion ratio
The median diurnal cycles of the ratio of ion concentration to the total sub-3 nm particle concentration at different sites are illustrated in Fig. 8. At all sites the ion ratio was lowest dur-ing the daytime and highest early in the morndur-ing, havdur-ing the opposite diurnal cycle to that of the total sub-3 nm particle concentration (see Fig. 4). In San Pietro Capofiume the ratio was very low throughout the day, reaching the highest value in the morning around 06:00 LT. Kontkanen et al. (2016) also observed the morning maximum in the ion ratio in San Pietro Capofiume and proposed that it was caused by the earlier in-crease in ion concentration than in the concentration of neu-tral particles during NPF events. In Nanjing, Puy de Dôme, and Centreville, the ion ratio was lowest around midday and highest at night or in the early morning. As discussed in the previous sections, in Hyytiälä the ion ratio was lowest in spring and summer and highest in autumn and winter. In spring and summer the ion ratio was lowest around noon and highest in the early morning. In autumn and winter the diur-nal variation in the ratio was weaker and the ratio was high throughout the day.
Figure 8. The median diurnal variation in the ratio of sub-3 nm ion concentration to the total particle concentration during differ-ent measuremdiffer-ent campaigns. The data from Hyytiälä (HTL) are di-vided into different seasons: spring (spr), summer (sum), autumn (aut), and winter (wint).
ion ratio decreased during the daytime in spring and winter. In spring this decrease may be related to the formation of particles in NPF events, which are frequent at that time of the year. In the size bin of 2–3 nm, the ion ratio also had an evening maximum in autumn, which may be linked to the formation of ion clusters observed frequently in the evening time in Hyytiälä (Junninen et al., 2008; Buenrostro Mazon et al., 2016).
3.4 Effects of environmental conditions on sub-3 nm particle concentrations
3.4.1 Sulfuric acid concentration and condensation sink at different sites
To understand the connection between environmental condi-tions and sub-3 nm particles, we investigated the relation be-tween the daytime median values of sub-3 nm particle con-centration and the medians of sulfuric acid concon-centration and condensation sink. Figure 10 shows the medians of sub-3 nm particle concentration as a function of sulfuric acid concentration (for most sites estimated from a proxy, see Sect. 2.3.10) for different measurement campaigns. At the sites where the median sub-3 nm particle concentrations were highest, i.e., in Nanjing, Shanghai, and San Pietro Capofi-ume, the median sulfuric acid concentrations were also high-est (daytime median values 1.5–3.6×107cm−3). Apart from this, no clear relation between the medians of sub-3 nm par-ticle concentration and sulfuric acid concentration can be ob-served. Thus, although the formation of sub-3 nm particles is likely favored in the conditions with high sulfuric acid con-centrations, other factors seem to also affect sub-3 nm
parti-cle concentrations. The significance of sulfuric acid for the formation of clusters and small particles has been observed earlier in several studies, including both field measurements and laboratory studies (e.g., Weber et al., 1997; Kulmala et al., 2004; Erupe et al., 2010; Sipilä et al., 2010). On the other hand, recent chamber experiments have shown that par-ticle formation and growth processes are very sensitive to the trace level of base compounds, such as ammonia or amines (Kirkby et al., 2011; Almeida et al., 2013; Lehtipalo et al., 2016), which may explain some of the variability in our data. In addition, the uncertainties in the proxies used for estimat-ing sulfuric acid concentrations may affect the results.
Figure 11 illustrates the relation between the daytime medians of sub-3 nm particle concentration and condensa-tion sink in different measurement campaigns. In Nanjing, Shanghai, and San Pietro Capofiume, where the median sub-3 nm particle concentrations (and sulfuric acid concentra-tions) were highest, high values of condensation sink were also detected (daytime medians 0.01–0.07 s−1). On the other hand, in Centreville condensation sink was also high (day-time median 0.01 s−1), but sub-3 nm particle concentration was low, possibly due to low sulfuric acid concentration (daytime median 9.6×104cm−3, see Fig. 10). Therefore, it seems that the concentration of sub-3 nm particles is deter-mined more by the availability of precursor vapors than by the level of condensation sink. This observation is in agree-ment with the results of previous studies on sub-3 nm par-ticles (Yu et al., 2014; Rose et al., 2015; Kontkanen et al., 2016).
3.4.2 Correlation between sub-3 nm particle concentrations and environmental variables The correlation between sub-3 nm particle concentration and different variables was also studied separately for each mea-surement site. The correlation coefficients obtained at differ-ent sites are shown in Table 5 together with their confidence intervals at the 95 % confidence level. The confidence inter-vals were calculated using Fisher’s transformation. The au-tocorrelation, which reduces the effective data size, was also taken into account (Mudelsee, 2010). In addition, in Table 6 correlation coefficients are presented separately for the 1.1–2 and 2–3 nm size ranges for Helsinki and Hyytiälä. Note that for Hyytiälä only data from 2015–2016 were used for calcu-lating the correlation coefficients.
ob-Figure 9.The median diurnal variation in the ratio of ion concentration to the total particle concentration in four size bins (1.1–1.3, 1.3–1.5, 1.5–2, and 2–3 nm) in Hyytiälä in 2011 and 2015–2016. The data are divided into different seasons: spring (spr), summer (sum), autumn (aut), and winter (wint).
served. A moderate positive correlation between sub-3 nm particle concentration and sulfuric acid concentration at dif-ferent measurement sites has been observed also in previous studies (Kulmala et al., 2013; Yu et al., 2014; Kontkanen et al., 2016). The correlation indicates that sulfuric acid may be one precursor of sub-3 nm particles, but they likely also have other precursors. Furthermore, the fact that in Hyytiälä particle concentrations in the sub-2 nm size range do not cor-relate with sulfuric acid concentration suggest that at least in Hyytiälä the smallest particles (or clusters) may be predom-inantly formed from vapors other than sulfuric acid. This is in line with the strong seasonal variation in sub-2 nm parti-cles observed at this site, pointing towards the importance of biogenic sources. On the other hand, the uncertainties in the proxies used for estimating sulfuric acid concentrations may also deteriorate the correlations.
A correlation coefficient between sub-3 nm particle con-centration and condensation sink was negative at some sites and positive at other sites (Table 5). The strongest negative correlation was observed in Hyytiälä, Brookhaven, and Cen-treville (R= −0.20 to−0.34), and the strongest positive
cor-relation was observed in Puy de Dôme (R=0.26). Thus, the relation between condensation sink and sub-3 nm parti-cle concentration seems to vary between different environ-ments. The positive correlation observed in Puy de Dôme is likely due to the simultaneous transport of large parti-cles and precursor vapors to the site. In previous studies at high-altitude sites, condensation sink has been observed to be usually higher on NPF event days than on non-event days for the same reason (Boulon et al., 2010; Manninen et al., 2010; Rose et al., 2015). When investigating the correlation with condensation sink separately for the 1.1–2 and 2–3 nm size ranges (Table 6), it can be observed that in Hyytiälä the negative correlation with condensation sink was stronger in the size range of 2–3 nm (R= −0.29) than in the smaller size range (R= −0.12). This suggests that condensation sink may limit the growth of sub-2 nm particles to larger sizes.
im-Table 5.Pearson’s correlation coefficients between sub-3 nm particle concentration and other variables at different measurement sites. The confidence intervals for the coefficients (the 95 % confidence level) are shown in parentheses.
Measurement Sulfuric Condensation Temperature RH Radiation
site acid conc. sink
HTL 0.16 −0.22 0.54 −0.48 0.43
(0.10–0.21) (−0.29 to−0.16) (0.49–0.59) (−0.53 to−0.42) (0.38–0.48)
SPC 0.43 0.05 0.56 −0.51 0.54
(0.28–0.56) (−0.08–0.18) (0.46–0.65) (−0.60 to−0.40) (0.42–0.63)
BRH 0.44 −0.34 0.29 −0.41 –
(0.33–0.53) (−0.46 to−0.20) (0.33–0.53) (−0.53 to−0.29)
KNT 0.37 0 −0.01 −0.32 0.46
(0.27–0.50) (−0.15–0.15) (−0.17–0.15) (−0.46 to−0.18) (0.33–0.58)
CTR 0.31 −0.20 0.24 −0.22 –
(0.24–0.39) (−0.28 to−0.12) (0.15–0.32) (−0.30 to−0.13)
PDD 0.37 0.26 0.12 0 0.41
(0.18–0.54) (0.13–0.38) (−0.02–0.25) (−0.13–0.14) (0.29–0.51)
SH 0.27 0.03 0.44 0 0.34
(0.05–0.47) (−0.12–0.17) (0.30–0.56) (−0.16–0.15) (0.21–0.46)
NJ 0.48 −0.16 0.22 −0.48 0.55
(0.34–0.61) (−0.31–0) (0.06–0.38) (−0.60 to−0.33) (0.42–0.65)
HEL 0.26 0.15 −0.05 −0.23 0.31
(0.20–0.31) (0.10–0.20) (−0.11–0.01) (−0.28 to−0.17) (0.26–0.36)
Table 6.Pearson’s correlation coefficients between particle concentration in the size ranges of 1.1–2 and of 2–3 nm and other variables in Hyytiälä (HTL) and Helsinki (HEL) in 2015–2016. The confidence intervals for the coefficients (the 95 % confidence level) are shown in parentheses.
Site and Sulfuric Condensation Temperature RH Radiation NO conc. NOxconc. size range acid conc. sink
HTL 1.1–2 nm 0.02 −0.12 0.61 −0.40 0.37 −0.14 −0.45 (−0.03–0.08) (−0.18 to−0.06) (0.56–0.65) (−0.45 to−0.34) (0.32–0.41) (−0.17 to−0.11) (−0.49 to−0.41)
HTL 2–3 nm 0.38 −0.29 0.05 −0.44 0.33 0.13 −0.05
(0.33–0.42) (−0.33 to−0.25) (0.01–0.10) (−0.48 to−0.41) (0.29–0.37) (0.10–0.16) (−0.09 to−0.01)
HEL 1.1–2 nm 0.24 0.10 −0.09 −0.22 0.29 0.51 0.39
(0.18–0.30) (0.05–0.15) (−0.15 to−0.04) (−0.27 to−0.16) (0.25–0.34) (0.47–0.54) (0.35–0.43)
HEL 2–3 nm 0.25 −0.03 −0.02 −0.24 0.26 0.34 0.31
(0.21–0.29) (−0.06–0.01) (−0.06–0.01) (−0.27 to−0.21) (0.23–0.29) (0.31–0.37) (0.27–0.34)
plies that at these sites the formation of sub-3 nm particles may be related to biogenic organic compounds, as their emis-sions from vegetation usually depend strongly on tempera-ture (Günther et al., 2012). On the other hand, the positive correlation may also reflect the correlation between sub-3 nm particles and solar radiation (discussed below), as tempera-ture and solar radiation generally correlate with each other. A closer look at the correlations in different size ranges shows that in Hyytiälä the positive correlation existed only in the 1.1–2 nm size range (R=0.61), whereas the particle con-centration in the 2–3 nm range did not correlate with
Figure 10.The daytime medians of sub-3 nm particle concentration as a function of sulfuric acid concentration in different measure-ment campaigns. Sulfuric acid concentration was calculated from a proxy for all other measurement campaigns except those in Kent, Brookhaven, and Centreville and in Hyytiälä during spring 2011.
sizes, as numerous field measurements have proven the im-portance of sulfuric acid in particle formation in the boreal environment (e.g., Sihto et al., 2006; Nieminen et al., 2009; Petäjä et al., 2009; Kulmala et al., 2013). In Helsinki, sub-3 nm particle concentration did not correlate with air temper-ature in either of the two size ranges (R= −0.02 to−0.09), which further strengthens the conclusion that biogenic pre-cursors are likely less important for sub-3 nm particles in this urban environment.
At most sites there was a negative correlation between sub-3 nm particle concentration and RH (Table 5). This was clear in Hyytiälä (R= −0.48) and San Pietro Capofiume (R= −0.51), which is in agreement with the strong positive correlation between particle concentration and temperature at these sites. A negative correlation existed also in Helsinki, Nanjing, and the US sites (R= −0.22 to−0.48). There were no clear differences in correlation coefficients in the 1.1–2 and 2–3 nm size ranges in Hyytiälä and Helsinki (Table 6).
Sub-3 nm particle concentration had a positive correlation with global radiation at all sites. The correlation coefficient ranged from 0.31 obtained in Helsinki to 0.55 in Nanjing (Ta-ble 5). In Hyytiälä and Helsinki, these correlation coefficients did not greatly differ between the 1.1–2 nm and 2–3 nm size ranges (Table 6). The positive correlation with radiation sug-gests the importance of the photochemical production of pre-cursor vapors, and it is consistent with the observed daytime maxima in sub-3 nm particle concentrations (Fig. 4).
Finally, we also investigated the correlation between sub-3 nm particle concentrations and nitrogen oxides (NO and NOx) in Hyytiälä and Helsinki. In Hyytiälä there was no clear relation between particle concentrations and NO, but a
Figure 11.The daytime medians of sub-3 nm particle concentration as a function of condensation sink during different measurement campaigns.
negative correlation with NOx was observed (R= −0.45 in the 1.1–2.1 nm size range andR= −0.05 in the 2–3 nm size range). The negative correlation is likely related to the fact that NOxconcentration is high when there is little radiation, and thus oxidation by OH and photodissociation processes are slow (Lyuobuotseva et al., 2006). In addition, high NOx concentrations in Hyytiälä are often linked to anthropogenic pollution episodes. In contrast, in Helsinki sub-3 nm particle concentration had a positive correlation with NO and NOx. The correlation was stronger in the size range of 1.1–2.0 nm (R=0.51 for NO andR=0.39 for NOx)than in the size range of 2–3 nm (R=0.34 for NO andR=0.31 for NOx). As nitrogen oxides are tracers for traffic emissions, this sug-gests that the formation of sub-3 nm particles in Helsinki may be linked to the emissions from engines of cars and buses driving near the measurement site. This conclusion is consis-tent with the observations made of the diurnal cycle of par-ticle concentration in Helsinki (see Sect. 3.2.2). Likewise, it is probable that sub-3 nm particles are formed, at least partly, due to traffic emissions also at other urban sites.
3.5 Connection to NPF events