PHYSIOLOGICAL RESEARCH
ISSN 0862-8408
© 2006 Institute of Physiology, Academy of Sciences of the Czech Republic, Prague, Czech Republic Fax +420 241 062 164E-mail: [email protected] http://www.biomed.cas.cz/physiolres
Physiol. Res. 55: 513-526, 2006
Differential Right and Left Ventricular Diastolic Tolerance to
Acute Afterload and NCX Gene Expression in Wistar Rats
J. CORREIA-PINTO, T. HENRIQUES-COELHO,
R. RONCON-ALBUQUERQUE Jr, A. F. LEITE-MOREIRA
Department of Physiology, Faculty of Medicine, University of Porto, Porto, Portugal.
Received date August 12, 2005Accepted date December 11, 2005 On-line available December 12, 2005
Summary
This study evaluated right ventricular (RV) and left ventricular (LV) diastolic tolerance to afterload and SERCA2a, phospholamban and sodium-calcium exchanger (NCX) gene expression in Wistar rats. Time constant τ and end-diastolic pressure-dimension relation (EDPDR) were analyzed in response to progressive RV or LV afterload elevations, induced by beat-to-beat pulmonary trunk or aortic root constrictions, respectively. Afterload elevations decreased LV-τ, but increased RV-τ. Whereas LV-τ analyzed the major course of pressure fall, RV-τ only assessed the last fourth. Furthermore, RV afterload elevations progressively upward shifted RV-EDPDR, whilst LV afterload elevations did not change LV-EDPDR. SERCA2a and phospholamban mRNA were similar in both ventricles. NCX-mRNA was almost 50 % lower in RV than in LV. Left ventricular afterload elevations, therefore, accelerated the pressure fall and did not induce diastolic dysfunction, indicating high LV diastolic tolerance to afterload. On the contrary, RV afterload elevations decelerated the late RV pressure fall and induced diastolic dysfunction, indicating small RV diastolic tolerance to afterload. These results support previous findings relating NCX with late Ca2+ reuptake, late relaxation and diastolic dysfunction.
Key words
Gene expression • Hemodynamics • Na/Ca-exchanger • Ventricular function • Diastole
Introduction
Myocardial relaxation, an important determinant of ventricular filling and diastolic function, is modulated by inactivation, load and non-uniformity (Brutsaert and Sys 1989, Gillebert et al. 1997). Inactivation refers to those processes whereby cytosolic calcium returns to its diastolic levels. Among those processes, phospholamban (PLB)-modulated uptake of Ca2+ by the sarcoplasmic
reticulum Ca2+-ATPase (SERCA2a) and Ca2+ extrusion
via the Na+/Ca2+ exchanger (NCX) are thought to be the
major contributors to the rapid decline of free intracellular Ca2+ concentration ((Ca2+)
ic) (Bridge et al.
1988, Bers et al. 1993). On the other hand, load influences myocardial relaxation through changes in these calcium regulatory mechanisms and myofilament properties. This certainly helps to explain why cardiac overload might lead to relaxation disturbances and diastolic dysfunction.
It was shown that afterload-induced diastolic dysfunction in the left ventricle (LV) might occur even in the healthy heart in response to an acute afterload
elevation (Leite-Moreira et al. 1999a). In fact, increasing afterload up to a given level accelerates LV relaxation and does not affect the end-diastolic pressure-volume relation (EDPVR), reflecting a compensatory response and the presence of diastolic tolerance to afterload, while above that level, any additional increase of afterload slows LV relaxation, elevates LV end-diastolic pressures and shifts upward the EDPVR, indicating that the ventricle has exhausted its diastolic tolerance to afterload (Leite-Moreira et al. 1999a, Leite-Moreira and Correia-Pinto 2001, Correia-Correia-Pinto et al. 2003). This afterload-induced LV diastolic dysfunction, which is explained by acute changes of intrinsic myocardial properties, was recently proposed as a contributory mechanism for the symptoms of congestion in acute severe systemic hypertension (Ghandi et al. 2001, Leite-Moreira et al. 2001).
In the right ventricle (RV), increased afterloads occur in a wide range of pathophysiological states and might also lead to RV failure when afterload is excessive or held for a prolonged period of time. In such conditions, elevated RV end-diastolic pressures (RV-EDP), which are considered the hallmark of RV failure (Rose et al. 1983), has been attributed either to a rightward displacement along the same end-diastolic pressure-volume relation or to extrinsic chamber factors such as pericardial constraint and ventricular interaction (Dell’Italia and Walsh 1988, Belenkie et al. 1989, Burger
et al. 1995, Greyson et al. 1997, De Vroomen et al. 2000,
Greyson et al. 2000, Morris-Thurgood and Frenneaux 2000). The possibility that increased RV afterloads would acutely influence intrinsic myocardial factors such as relaxation, as previously shown for the LV, and not only an extrinsic chamber constraint, has, however, not yet been tested.
Using the in situ rat heart with an opened
pericardium, this study investigated the effects of beat-to-beat left and right ventricular afterload elevations on diastolic function and diastolic tolerance to afterload of the corresponding ventricle and constitutive gene expression of SERCA2a, PLB and NCX in both ventricles.
Methods
The investigation conforms to the Guide for the
Care and Use of Laboratory Animals published by the
US National Institutes of Health (NIH Publication No. 85-23, revized 1996).
The study was carried out on 22 normal adult Wistar rats (8 weeks old, Charles-River, Barcelona). Twelve rats (182±15 g) were used for hemodynamic studies whereas the remaining 10 animals (196±10 g) were used for sarcoplasmic reticulum calcium-ATPase 2a (SERCA2a), phospholambam (PLB), sodium/calcium exchanger (NCX) and calsequestrin (CSQ) mRNA gene expression.
Hemodynamic studies Experimental preparation
The animals were anesthetized with pentobarbital (6 mg/100 g, i.p.), placed over a heating pad, the trachea cannulated and mechanical ventilation initiated (Harvard Small Animal Ventilator, Model 683), delivering oxygen-enriched air at 60 cpm with a tidal volume of 1 ml/100 g. Respiratory rate and tidal volume were adjusted to keep arterial blood gases and pH within physiological limits. Anesthesia was maintained with additional bolus of pentobarbital (2 mg/100 g) as needed. The right jugular vein was cannulated under surgical microscopy (Leica, Wild M651.MS-D, Herbrugg, Switzerland) and a pre-warmed solution (0.9 % NaCl) infused to compensate for perioperative fluid losses. The heart was exposed through a median sternotomy and the pericardium widely opened. Ascending aorta and pulmonary trunk were dissected and a silk number 4 was passed around each one to allow their external occlusion during the experimental protocol. Right ventricular pressure (RVP) and left ventricular pressure (LVP) were measured respectively with 2F and 3F high-fidelity micromanometers (Millar Instruments, Houston, Texas) inserted through the apex into the corresponding ventricular cavity. Manometers were calibrated against a mercury column and zeroed after stabilization for 30 min in a water bath at 37 ºC. Dimensions of both ventricles were recorded with ultrasonic crystals using a sonomicrometer amplifier (Triton Technology, San Diego, CA).
Under surgical microscopy and preserving the course of the coronary vessels, three hemispheric crystals were placed along the major cardiac transverse diameter and secured in place with 7-0 polypropylene sutures: two crystals (2 mm), facing each other, were positioned on the epicardial surfaces of the RV and LV free walls and a third one (1 mm), facing the crystal on the epicardial surface of the LV free wall, was positioned on the right subendocardium of the interventricular septum. These crystals allowed the direct measurement of the
biventricular and LV septal-free wall external diameters (Fig. 1). A limb ECG (DII) was recorded throughout. At the end of the experiment, the animal was sacrificed with an overdose of anesthetics and the position of crystals and manometers was verified at necropsy. Four rats were rejected and not used for further analysis due to malposition of the septal crystal (Correia-Pinto et al. 2002).
Experimental protocol
After complete instrumentation the animal
preparation was allowed to stabilize before the beginning of the experimental protocol. This consisted in randomly performing multiple graded right or left ventricular pressure elevations, by abruptly narrowing or occluding the pulmonary trunk or aortic root, respectively, during the diastole separating two heartbeats. The preceding beat is a control heartbeat and the following beat is a test heartbeat. Systolic right and left ventricular pressures of the first heartbeat following the intervention varied as a function of the extent of pulmonary or aortic constrictions. After each ventricular pressure elevation
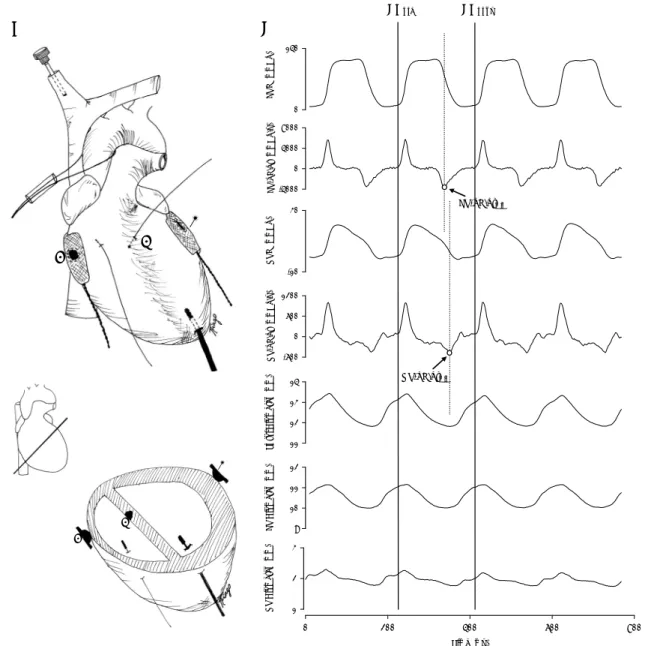
LV P ( mmH g) 0 140 LV -dP /dt (mm H g /s ) -4000 0 4000 8000 R V P ( mmHg) -10 30 R V -dP /d t (m m H g/ s ) -600 0 600 1200 T o tal Diam et er ( m m ) 11 12 13 14 L V Diam et er ( m m ) 9 10 11 12 Time (ms) 0 200 400 600 800 RV Diam et er ( m m ) 1 2 3 LV-dP/dtmin RV-dP/dtmin EDpre EDpost A B
1
3
2
1
3
2
1 2 3 1 2 3Fig. 1. A. Schematic representation of experimental heart instrumentation of both ventricles. Crystals were placed along the major cardiac transverse diameter in the epicardial surfaces of the left ventricular (LV) (1) and right ventricular (RV) (3) free walls and in the right subendocardium of the interventricular septum (2). B. Representative example of recorded hemodynamic parameters. Left ventricular pressure (LVP), left ventricular dP/dt (LV-dP/dt), right ventricular pressure (RVP), right ventricular dP/dt (RV-dP/dt), bi-ventricular diameter (Total Diameter), left bi-ventricular septal-free wall dimension (LV Diameter), right bi-ventricular septal-free wall dimension (RV Diameter). Vertical solid lines indicate end-diastole at the beginning (EDpre) and at the end (EDpost) of a cardiac cycle.
Vertical dashed lines mark left and right ventricular dP/dtmin. Note that while LV dP/dtmin occurs in the initial part of LV pressure fall,
the animal was stabilized for several beats before another intervention was performed. The technique for performing acute afterload elevations was previously applied by our group in several other studies (Leite-Moreira et al. 1999a, Leite-(Leite-Moreira and Correia-Pinto 2001, Correia-Pinto et al. 2002, 2003, 2004). In summary, a plastic tube was pushed against the aorta or the pulmonary trunk with one hand, while pushing a silk suture, passed around the vessel and through the tube, with the other hand (Fig. 1A). This could be done very quickly. Multiple interventions, with variable degrees of aortic/pulmonary trunk narrowing, were performed in a random manner. The beats to be analyzed were selected a
posteriori in order to analyze those with an afterload
elevation as close as possible to the desired level. If the occlusion was performed during ejection, this resulted in a characteristic shape of the ventricular pressure tracing. These beats were not selected. Finally, the aortic clamp was quickly released in order to avoid neurohumoral reflex changes in cardiac function. As a rule the aorta remained clamped during 3-5 heartbeats, which is not enough for neurohumoral reflex changes to occur as previously shown (Kass et al. 1986).
At the end of the protocol, a slow and progressive increase in RV afterload was performed by gradually pushing the plastic tube against the pulmonary trunk, until a total occlusion was obtained. These were the last interventions to be performed and took 20-25 heartbeats to be complete. The animals were not paced, but the heart rate did not vary significantly during the experimental protocol (284±21 bpm).
Data acquisition and analysis
Recordings were made with respiration suspended at the end of expiration. Parameters were converted on line to digital data with a sampling frequency of 1000 Hz. End-diastole at the beginning of the analyzed cardiac cycle was referred to as EDpre, while
the end-diastole at the end was referred to as EDpost. Peak
rates of right (RV-dP/dtmax) and left (LV-dP/dtmax)
ventricular pressure rise as well as peak rates of right (RV-dP/dtmin) and left (LV-dP/dtmin) ventricular pressure
fall were measured. RVP was measured at the beginning of the cardiac cycle (RV-EDPpre), at peak-systole
(RVPmax), at the moment of RV-dP/dtmin, at its
protodiastolic nadir (RVPmin), and at the end of the
cardiac cycle (RV-EDPpost). LVP was measured at the
beginning of the cardiac cycle (LV-EDPpre), at
peak-systole (LVPmax), at the moment of LV-dP/dtmin, at
its protodiastolic nadir (LVPmin), and at the end of the
cardiac cycle (LV-EDPpost). Afterload levels for both
ventricles are presented as relative load, which consists in peak systolic ventricular pressure of a given heartbeat expressed as percentage of peak systolic pressure of the corresponding isovolumetric beat (Gillebert et al. 2000). Rate of pressure fall of each ventricle was evaluated with time constants τ (RV-τ and LV-τ). For calculating τ, the portion of the RV or LV pressure time courses between the dP/dtmin and a pressure below the value of EDPpost
was selected. The curve was fitted to a monoexponential model (τexp) (Weisfeldt et al. 1978, Langer 2002) with
non-zero asymptote, given by the following equation: P(t) = P0 e-t/τexp + P∞, where P∞ is a nonzero asymptote
(mm Hg), P0 is an amplitude constant (mm Hg), t is time
(ms), and τexp is the time constant of the exponent (ms).
The r2 yielded values >0.96. According to this formula
relaxation will be 97 % complete after a time interval of 3.5*τexp (ms) starting at the onset of LVP fall (Weisfeldt
et al. 1978). The curve was also fitted to the logistic
model (τlog). The logistic time constant was shown to
better describe pressure fall when its course deviates from monoexponential (Matsubara et al. 1995). This time constant was calculated from the equation: P(t) = PA /
(1 + et/τlog) + P
B, where PB is a non-zero asymptote, PA is
an amplitude constant, t is time, and τlog is the time
constant of the exponent. The r2 yielded values >0.99. RV
septal-free wall dimension (RVD) was calculated as biventricular diameter minus LV septal-free wall dimension (LVD). RVD was measured at the beginning of the cardiac cycle (RV-EDDpre), at RV-dP/dtmin
(RVDend-syst) and at the end of the cardiac cycle
(RV-EDDpost). LVD was measured at the beginning of the
cardiac cycle (LV-EDDpre), at its minimal value (LVDmin)
and at the end of the cardiac cycle (LV-EDDpost). For
each ventricle, fractional shortening was calculated from the difference between end-diastolic and end-systolic dimensions in percentage of the end-diastolic dimension. It should be pointed out, however, that due to methodological limitations related with the small size of the rat heart, fractional shortening calculated in this manner reflects changes in external but not internal dimensions.
SERCA2a, PLB, NCX and Calsequestrin mRNA gene expression
Total mRNA extraction
Total mRNA was extracted from right (n=10) and left (n=10) ventricular transmural free-wall samples
according to the manufacturer’s instructions (Qiagen RNeasy® Mini Kit). Purity (A260/A280) and total mRNA concentrations were assessed by spectrophotometry (Eppendorf BioPhotometer).
Standard cRNA synthesis
Total cDNA synthesis was obtained through reverse transcription (RT): 200 U reverse transcriptase (Invitrogen™ Superscript™ II RNase H- Reverse Transcriptase), 20 U ribonuclease inhibitor (Promega Recombinant RNasin® Ribonuclease Inhibitor), 0.6 mg random primers (Invitrogen™ Random Primers), 0.5 mM nucleotide mix, 1.9 mM MgCl2, 10 mM DTT. The cDNA
of interest was then amplified by polymerase chain reaction (PCR, 35 cycles, melting temperature 60 ºC), using specific forward-standard and reverse primers for SERCA2a, PLB, NCX and CSQ (see below): 1.25 U Taq polymerase (Promega Taq DNA Polymerase Cat. No.M1865), 0.4 mM nucleotide mix, 2.0 mM MgCl2,
0.4 mM each primer. The standard cDNA was then separated by electrophoresis in a 2 % agarose gel (0.3 μg/ml ethidium bromide) and extracted from the gel, following manufacturer’s instructions (Qiagen QIAquick® Gel Extraction Kit). In vitro transcription of standard cDNA was then performed under the control of the T3 phage RNA polymerase promoter (Epicentre Technologies AmpliScribe T3 Transcription Kit). Ten percent of the in vitro transcription product was separated by electro-phoresis in a 1 % agarose gel to confirm standard cRNA integrity. Purity and cRNA concentration was assessed by spectrophotometry (see above). Standard cRNA was finally diluted into 6 distinct concentrations.
Messenger RNA quantification
For each sample total cDNA synthesis was performed through reverse transcription in six reactions with decreasing concentrations of standard cRNA (see above) and a constant amount of sample total mRNA (50 ng). Sample and standard cDNA were then co-amplified by PCR (see above) using specific forward and reverse primers. The primers were: SERCA2a fw 5’-CGA GTT GAA CCT TCC CAC AA-3’ and rev 5’-GGA GGA GAT GAG GTA GCG GAT GGA-3’, PLB fw 5’-GGC ATC ATG GAA AAA GTC CA-3’ and rev: 5’-GGT GGA GGG CCA GGT TGT AA-3’, NCX fw 5’-CTG GAG CGC GAG GAA ATG TTA-3’ and rev 5’-GAC GGG GTT CTC CAA TCT CAA-3’, CSQ fw 5’-AGC AGC GTC TCC AAG AA-3’ and rev 5’-CGT GGT AGT AGA GAC AGA GCA AA-3’. Sample and
standard cDNA fragments were separated by electrophoresis in a 2 % agarose gel (0.3 μg/ml ethidium bromide) and band quantification was performed by UV densitometry (302 nm, Alpha Innotech Alpha Imager™ 2200).
Statistical analysis
Group data are presented as mean values ± S.E.M. To compare the control and the three levels of afterload elevation in right and left ventricles, we performed two-way repeated-measures ANOVA. When treatments were significantly different, the Student-Newman-Keuls test was selected to perform pairwise multiple comparisons. Comparison of right and left SERCA2a, PLB and NCX mRNA gene expression was performed using a paired t-test. Statistical significance was set at p<0.05.
Results
For both ventricles and from multiple available interventions we selected for further analysis, in addition to control heartbeats, cardiac cycles whose relative loads were closer to 60 % (Low), 80 % (Moderate) and 100 % (High, isovolumetric heartbeats). RVPmax of the control
beats was 24±2 mmHg, whereas LVPmax of the control
beats was 95±7 mmHg (Table 1). In both ventricles, as systolic pressure was elevated fractional shortening declined, while dP/dtmax increased progressively. This
increase was, however, more pronounced for the RV, where it reached a maximum of 44.5±8.2 % in the isovolumetric beat, while in the LV it failed to reach statistical significance (p=0.065) and did not exceed 10.7±5.2 % of control in the isovolumetric beat.
During the protocol, no significant changes of the hemodynamic parameters on the contralateral ventricle were observed when beat-to-beat constrictions of the aorta and pulmonary trunk were performed. The following description, therefore, always refers to the effects of ventricular pressure elevations on the ipsilateral ventricle.
Effects of RV afterload elevations on RV pressure fall and diastolic function
Effects of RV afterload elevations on corresponding RV ventricular pressure fall and diastolic function were illustrated in Figures 2 and 3 and summarized in Table 1.
increased RVPmin and RV end-diastolic pressures
(RV-EDPpost), while no significant changes of
end-diastolic RV dimensions were observed (Fig. 2, upper panels). The analysis of pressure-dimension relations therefore shows that afterload-induced elevation of RV-EDPpost elevations reflects an upward shift of the
diastolic pressure-dimension relation. At end-diastole, this relation was shifted upwards, with regard to the control beat, 1.0±0.4, 2.3±0.4 and 3.3±0.7 mmHg at low, moderate and high afterload levels, respectively (Fig. 3, bottom).
RV-τ (either τexp and τlog) increased systematic
and significantly with RV afterload elevations (Table 1),
indicating that the rate of RV pressure fall decreased. It should be noted, that RV-τ only evaluates late phase of RV pressure fall, because RV-dP/dtmin, which is the point
where the calculation of RV-τ starts, only occurs when 79.2±3.2 % of RV pressure fall has already occurred. As a consequence, RV-τ evaluates in control heartbeats only the last quarter of RV pressure fall.
Effects of LV afterload elevations on LV pressure fall and diastolic function
Effects of LV afterload elevations on corresponding LV ventricular pressure fall and diastolic function were illustrated in Figures 2 and 3 and Table 1. Systolic and diastolic parameters of the right and left ventricles.
Afterload elevations
Control Low Moderate High
Right Ventricle
RVPmax 24.1±1.6 29.2±1.7a 36.5±1.8a,b 47.0±4.2a,b,c
RV-dP/dtmax (mm Hg/s) 989±116 1070±108a 1214±111a 1483±192a,b
Fractional shortening ( %) 13.4±2.8 10.5±2.9a 10.3±3.3a -0.2±3.8a,b,c
RV-dP/dtmin (mm Hg/s) -576±88 -580±72 -623±73 a -862±123 a,b,c
RV-τexp (ms) 28.2±4.2 29.2±3.8 31.9±3.9 a,b 36.6±3.2 a,b
RV-τlog (ms) 17.1±2.4 18.0±2.4 20.0±2.4 a,b 24.9±2.0 a,b,c
RVPmin (mm Hg) 2.2±0.8 3.1±0.8a 4.3±0.7a 5.1±1.0a,b
RV-EDPpre (mm Hg) 5.7±1.1 5.7±1.1 5.6±1.2 5.7±0.8
RV-EDDpre (mm) 3.16±0.47 3.16±0.47 3.16±0.47 3.17±0.47
RV-EDPpost (mm Hg) 5.7±1.2 6.7±1.4a 7.9±1.5a,b 9.0±1.2a,b,c
RV-EDDpost (mm) 3.16±0.47 3.18±0.51 3.17±0.53 3.19±0.54
Left Ventricle
LVPmax 96.2±8.2* 117.0±7.0 a* 164.4±6.7 a,b* 202.3±8.3 a,b,c*
LV-dP/dtmax (mm Hg/s) 5122±659* 5190±637* 5316±581* 5457±497*
Fractional shortening ( %) 7.96±0.89 7.66±0.91 6.93±0.92 a,b 3.95±0.97 a,b,c
LV-dP/dtmin (mm Hg/s) -2878±449* -3075±467* -3583±440 a* -3244±396*
LV-τexp (ms) 30.6±3.5 26.1±2.4 a 22.6±2.4 a,b 30.7±3.4 c
LV-τlog (ms) 15.7±1.3 13.6±1.0 a 12.1±1.2 a,b* 17.1±2.0 a,c*
LVPmin (mm Hg) 7.0±1.6* 7.2±1.6* 8.0±1.7 a,b* 11.3±2.2 a,b,c*
LV-EDPpre (mm Hg) 11.2±1.6* 11.1±1.6* 11.3±1.6* 11.5±1.5*
LV-EDDpre (mm) 9.4±0.7* 9.4±0.7* 9.5±0.7* 9.5±0.7*
LV-EDPpost (mm Hg) 10.9±1.6* 11.0±1.6* 11.3±1.6 11.9±1.6
LV-EDDpost (mm) 9.5±0.8* 9.4±0.7* 9.5±0.7* 9.5±0.7*
Data are presented as mean ± S.E.M.; n=8. RVPmax and LVPmax, right and left ventricular peak systolic pressure, respectively; RV, right
ventricle; LV, left ventricle; dP/dtmax, peak rate of ventricular pressure rise; dP/dtmin, peak rate of ventricular pressure fall; τexp, time
constant tau (exponential method); τlog, time constant tau (logistic method); RVPmin and LVPmin, right and left minimal ventricular
pressure, respectively; EDP end-diastolic pressure at beginning (pre) and at the end (post) of the heartbeat; EDD end-diastolic dimension at beginning (pre) and at the end (post) of the heartbeat. P<0.05 indicated significance: a vs. control; b vs. low; c vs.
summarized in Table 1.
In contrast to the RV, LV afterload elevations did not significantly increase LVP-EDpost, nor shifted
upwards the diastolic pressure-dimension relation (Fig. 2, lower panels; Fig. 3, bottom panel). This indicates that no LV diastolic dysfunction was induced by acute LV afterload elevation.
Effects of afterload elevations on LV-τexp are
expressed as fractional changes of the control values in the upper panel of Figure 3. LV-τ (either LV-τexp or
LV-τlog) showed a response distinct from RV-τ to
afterload elevations, presenting a biphasic pattern. LV-τ decreased (pressure fall accelerated) progressively as afterload increased. This acceleration was maximal for relative loads between 70 and 90 %. For instance, when compared to control, at a relative load of 80 % τexp
decreased 24.2±4.0 % and τlog 22.2±3.7 %. Above these
afterload levels the acceleration of LV pressure became smaller and was no more observed in isovolumetric beats (relative load, 100 %). Note that in contrast to RV-τ, LV-τ evaluates almost the last three quarters of LV pressure fall. In fact, in control heartbeats LV-dP/dtmin
occurs 19±3 ms earlier than RV-dP/dtmin, at a moment
when LV pressure fell solely by 30±3 % of its peak value.
Right and left ventricular mRNA expression of SERCA2a, PLB and NCX genes
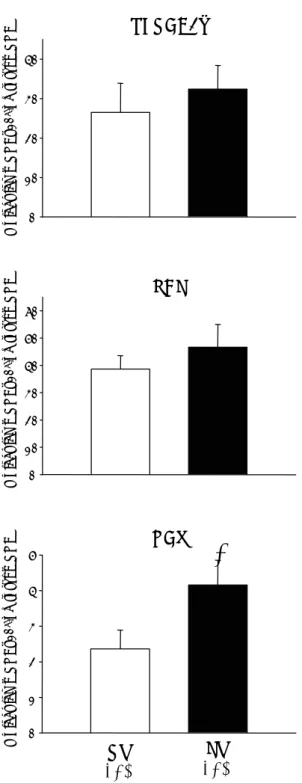
As shown in Figure 4, mRNA expression of NCX gene in the RV was almost half of that observed in the LV (RV: 2.5*106±4.9*105, LV: 4.2*106±6.7*105
NCX mRNA molecules/ng total mRNA, p<0.05), RV Diameter (mm) 1,8 2,5 3,2 R V P ressur e (m m H g) 0 20 40 60 80
1
2
3
4
R V P re ssur e (mmH g) 0 20 40 60 803
1
2
4
Time (ms) 0 50 100 150 200 250 LV P ressur e (mmH g) 0 50 100 150 200 2501
2
3
4
LV Diameter (mm) 9,5 10,5 11,5 LV P ressur e (mmH g) 0 50 100 150 200 2501
2
3
4
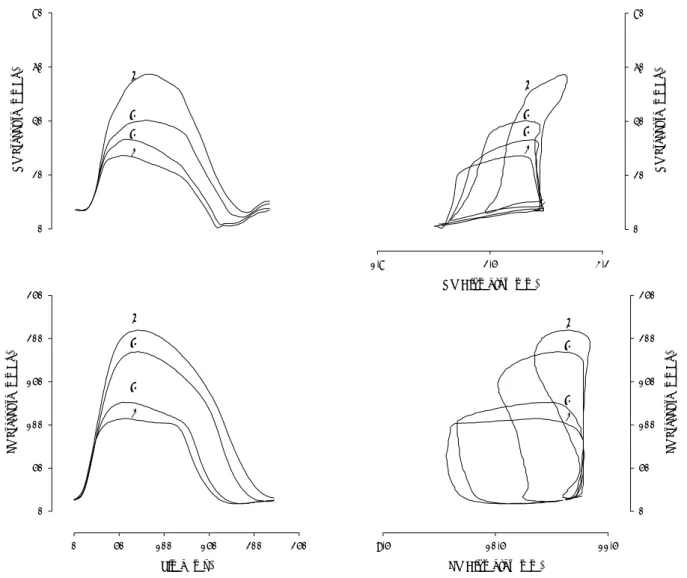
Fig. 2. Effect of selective afterload elevations on right (top) and left (bottom) ventricular pressure time courses (left) and pressure-dimension loops (right). In each panel four superposed heartbeats are represented: control (beat 1) and low (beat 2), moderate (beat 3) and high (beat 4) afterload elevations. While left ventricular pressure elevations do not significantly influence end-diastolic pressures and the position of end-diastolic portion of the pressure-dimension loops, right ventricular pressure elevations induce a progressive increase of diastolic pressures and an upward shift of the diastolic portion of the pressure-dimension loops. Note that in both ventricles end-diastolic dimension remain closely matched at all afterload levels.
whereas SERCA2a and PLB mRNA levels were not significantly different between the two ventricles (SERCA2a – RV 2.7*107±7.4*106, LV 3.2*107±6.5*106;
PLB – RV 3.9*107±5.0*106, LV 3.8*107±3.5*106 mRNA
molecules/ng total mRNA). These results were not significantly modified after normalization for CSQ (house keeping gene).
Discussion
The present study investigated the effects of acute right and left ventricular afterload elevations on the corresponding ventricular pressure fall and diastolic function as well as SERCA2a, PLB and NCX mRNA expression in the normal rat. Acute LV afterload elevations accelerated LV pressure fall with no afterload-induced diastolic dysfunction, whereas RV afterload elevations elicited a significant deceleration of late RV pressure fall, evaluated by RV-τ, and induced RV diastolic dysfunction. While SERCA2a and PLB mRNA expression was similar in both ventricles, NCX mRNA expression was significantly lower in the RV than in the LV.
Diastolic tolerance to afterload was previously defined on the basis of the response of rate of pressure fall and position of the diastolic pressure-volume relation to acute beat-to-beat afterload elevations. In the LV of dogs and rabbits this response was biphasic. Smaller afterload elevations, up to a relative load of 81-84 % in the dog (Leite-Moreira and Gillebert 1994, Leite-Moreira
et al. 1999a,b) and 73-76 % in the rabbit (Leite-Moreira et al. 1999a, Leite-Moreira and Correia-Pinto 2001,
Correia-Pinto et al. 2003), accelerated the LV relaxation rate and did not affect the LV end-diastolic pressure-volume relation, indicating a compensatory response and the presence of diastolic tolerance to afterload. On the contrary, afterload elevations above those relative loads markedly slowed LV relaxation rate and shifted upwards the end-diastolic pressure-volume relation, indicating that a decompensatory response has occurred and diastolic tolerance to afterload was exhausted. The acute upward shift of the LV end-diastolic pressure-volume relation in response to afterload elevations (afterload-induced diastolic dysfunction) was attributed to decreased relaxation rate, insufficient time to relax and increased diastolic tone (Leite-Moreira et al. 1999a, Leite-Moreira and Correia-Pinto 2001). The relative load at which the transition between compensatory and decompensatory responses occurred was modified by interventions that alter SERCA2a activity and myofilament affinity for Ca2+, such as
caffeine (Leite-Moreira et al. 1999b) and β-adrenergic stimulation (Langer and Schmidt 1998).
In the present study, the compensatory response to LV beat-to-beat afterload elevations was observed almost during the entire range of afterloads between control and isovolumetric beats. Decompensatory
† ‡ † ‡ II
*
*
60 Δ T au (% of co nt ro l) -40 -20 0 20 40 LV RV † † ‡ § II¶ † †*
*
† Relative Load (%) Ctrl 60 70 80 90 100 Dia sto li c D ys fun cti on (m mH g) -1 0 1 2 3 4 5 LV RV † ‡ † ‡ II*
*
60 Δ T au (% of co nt ro l) -40 -20 0 20 40 LV RV † † ‡ § II¶ † †*
*
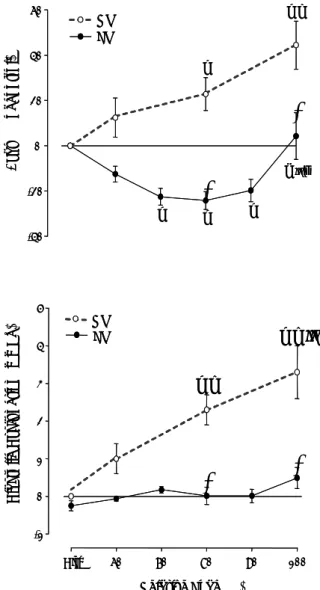
† Relative Load (%) Ctrl 60 70 80 90 100 Dia sto li c D ys fun cti on (m mH g) -1 0 1 2 3 4 5 LV RVFig. 3. Effects of increasing afterload on time constant τexp(Tau,
top) and on the difference between end-diastolic pressures at the end and at the beginning of the cardiac cycle (diastolic dysfunction, bottom) of right (RV; open symbols, dashed lines) and left (LV; filled symbols, solid lines) ventricles. Afterload levels are expressed as a percentage of peak isovolumetric pressure (Relative Load). Afterload elevations elicited disparate responses of these two parameters in RV and LV. In fact, while in the LV afterload elevations induced either a decrease, or no change of τexp and did not produce any significant degree of diastolic
dysfunction, in the RV similar relative loads promoted a significant and progressively bigger increase of τexp and diastolic
dysfunction. Note that in the LV, results of two additional relative loads (70 % and 90 %) were presented. Significant differences (P<0.05):† vs. control (Ctrl); ‡ vs. 60 %; § vs. 70 %; ¶ vs. 90 %; * vs. RV.
response was either not observed, or present only in isovolumetric beats and beats very close to isovolumetric. Therefore, the transition from compensation to decompensation could be timed at a relative load of 97-100 %. As a consequence, the normal rat LV has a bigger diastolic tolerance to afterload than the previously studied animal species (dog and rabbit) and hardly showed any
degree of afterload-induced diastolic dysfunction. Potential mechanisms for these species differences include the distinct degree of SERCA2a activity between them and the differential expression of myosin heavy chain (MHC) isoforms (Perez et al. 1999). In fact, rat hearts have significantly higher SERCA2a activity than rabbit hearts (Negretti et al. 1993, Bassani et al. 1994, Lewartowski et al. 1992). In addition, rat hearts express predominantly the faster MHC-α isoform (Meehan et al. 1999), while rabbit hearts express predominantly the slower MHC-β isoform, which confers on the myofilaments higher Ca2+ sensitivity (Reiser and Kline
1998).
In the current study, effects of beat-to-beat RV afterload elevations were also analyzed. Interestingly, in contrast to the LV, RV afterload elevations systematically shifted upward the diastolic pressure-dimension relation, even when those elevations were of small amplitude, indicating that RV has a much smaller diastolic tolerance to afterload than the LV. In other studies, RV afterload-induced diastolic disturbances were explained by the fact that pericardial constraint and ventricular interaction are the most important acute determinants of RV diastolic pressure-volume relation (Morris-Thurgood and Frenneaux 2000). For several authors, pericardial constraint is by far the most important of the two mechanisms and the main cause of acute afterload-induced diastolic disturbances (Burger et al. 1995, Dell’Italia and Walsh, 1988, Assanelli et al. 1997). It cannot, however, explain our findings because the pericardium was widely opened in the present study. On the other hand, direct ventricular interaction is to a large extent mediated through the pericardium and is therefore greatly reduced when it is opened. However, we have to mention, that RV diastolic physiology is sensitive to ventricular interaction even with the pericardium opened (Baker et al. 1998, Brown et al. 1993). Nonetheless, we believe that ventricular interaction did not play a significant role in the results we observed in the RV. In fact, RV afterload elevations were performed by beat-to-beat constrictions of the pulmonary trunk, which did not change diastolic dimensions of any ventricles, precluding the effects of ventricular interaction. Furthermore, even if present, ventricular interaction could not explain the effects of RV afterload elevations on RV diastolic function documented in our study, because it would rather shift downward the diastolic pressure-dimension relation, which is the opposite of what we observed. However, such interaction needs a few heartbeats to
RV
(n=9)
LV
(n=9)
NCX
SERCA2a
PBL
0 1 2 3 4 5 M o lec u le s m RNA x10 6/n g to tal mR N A 0 10 20 30 40 0 10 20 30 40 50 60 M o lecu le s m RN A x 1 0 6/n g to ta l mRNA M o lec u le s m RNA x10 6/n g to ta l m R NA*
Fig. 4. Bar graphs showing SERCA2a, phospholamban (PLB) and Na+/Ca2+ exchanger (NCX) mRNA gene expression in right (RV)
and left (LV) ventricles. Significant differences (P<0.05): * vs. RV.
become manifest, as we illustrate in Figure 5. In fact, if we constrict the pulmonary trunk it will take some heartbeats (never only one) for LV dimensions to decrease, as a consequence of a diminished pulmonary venous return to the LV. Under these circumstances, RV diastolic pressure-dimension relation is downward shifted, masking RV afterload-induced diastolic disturbances. This study, therefore, provides evidence that acute afterload-induced RV diastolic dysfunction seems to depend not only on extrinsic chamber factors but also on myocardial relaxation disturbances, as previously suggested under the conditions of chronic RV pressure overload (Leewenburgh et al. 2002).
The effects on the time constant τ were distinct in the two ventricles, what might be related to the fact that, as pointed out in the Results section, RV-τ evaluates the rate of terminal (~last quarter) of RV pressure fall
(Correia-Pinto et al. 2004). We could conclude, therefore, that the rate of late RV pressure fall is slowed by RV afterload elevation. A potential explanation for this distinct regulation of right and left ventricular pressure fall might be derived from the existing knowledge about the physiological role of SERCA2a and NCX and the differential RV and LV NCX gene expression observed in the present study. In fact, although SERCA2a removes most of the activator Ca2+, NCX is the other major contributor in removal of remaining cytosolic Ca2+
(Sipido et al. 2002). Additionally, it was already demonstrated that changes of NCX expression/activity can modify the (Ca2+)
ic transient particularly during the
terminal phase of Ca2+ decline (Yao et al. 1998, Takimoto
et al. 2002).
Yao et al. (1997, 1998) demonstrated that
SERCA2a activity is predominantly responsible for the 1 2 3 RV Di am eter (mm ) 1 5 RV P ressu e (mm Hg ) 0 50 L V P ressu re (m m H g ) 0 100 Time (ms) 0 3250 6500 L V D iam eter (mm ) 7.5 9.5 1 2 3 RV Diameter (mm) 1,5 2,5 3,5 4,5 R V P res su re (m mH g ) 0 10 20 30 40 50 1 2 3 RV Di am eter (mm ) 1 5 RV P ressu e (mm Hg ) 0 50 L V P ressu re (m m H g ) 0 100 Time (ms) 0 3250 6500 L V D iam eter (mm ) 7.5 9.5 1 2 3 RV Di am eter (mm ) 1 5 RV P ressu e (mm Hg ) 0 50 L V P ressu re (m m H g ) 0 100 Time (ms) 0 3250 6500 L V D iam eter (mm ) 7.5 9.5 1 2 3 RV Diameter (mm) 1,5 2,5 3,5 4,5 R V P res su re (m mH g ) 0 10 20 30 40 50 1 2 3 RV Diameter (mm) 1,5 2,5 3,5 4,5 R V P res su re (m mH g ) 0 10 20 30 40 50
Fig. 5. Representative example of a sustained and progressive right ventricular afterload elevation. Right (RV) and left (LV) ventricular pressure and dimension time courses (left panels) and right ventricular pressure-dimension loops (right panel) are displayed. From control (beat 1) to a moderately afterloaded heartbeats (beat 2), we observed an upward shift of the diastolic RV pressure-dimension relation, whereas no significant changes were observed on left ventricular pressures and dimensions. Further increase of RV afterload, in a progressive and sustained way, to a higher level (beat 3) resulted in a significant decrease of left ventricular pressures and dimensions, due to decreased pulmonary venous return. Under these circumstances, ventricular interaction became manifest and were therefore no additional upward shift, but instead a downward shifted till control position, of the diastolic RV pressure-dimension relation was observed. It should be noted that, unlike beat-to-beat interventions, in a progressive and sustained afterload elevation a rightward displacement of the pressure-dimension loops due to continuous ventricular filling is observed. Arrow indicates the beginning of pulmonary trunk constriction.
initial relaxation and decline in the (Ca2+)
ic transient, and
that this initial phase is not significantly prolonged by elimination of the NCX activity. On the contrary, the rate and extent of the terminal phase of the decline in the (Ca2+)
ic transient are significantly dependent of NCX
activity. The present study showed that while no significant differences were detected for SERCA2a and PLB, NCX gene expression in the RV was about one half of that in the LV. Smaller RV than LV expression of NCX was also reported by others in the rat, in the ferret (Kent et al. 1993) but not in failing human hearts (Hasenfuss et al. 1999, Weber et al. 2003). It should, however, be taken into account that the relative importance of SERCA2a and NCX varies with the experimental conditions and the animal species (Sipido et
al. 2002).
High SERCA2a activity, characteristic for the rat myocardium, could therefore explain the acceleration of early relaxation of pressure fall observed in the present study. On the other hand, smaller NCX gene expression in the RV could explain the observed afterload-induced slowing of RV late relaxation rate, manifested by the significant decrease in RV-τ. Afterload elevations increase myofilament affinity for Ca2+, allowing
recruitment of additional cross-bridges or prolonging the half-life of cycling cross-bridges, through a mechanism known as cooperative activity (Babu et al. 1988). This phenomenon, that might result in a later detachment of cross-bridges and afterload-induced disturbances of late (Ca2+)
ic decline (Housmans et al. 1983, Lu et al. 2001),
was particularly evident on the RV, which showed a pronounced and significant increase in contractility, in response to beat-to-beat afterload elevations, as assessed by the increase in RV-dP/dtmax. This enhanced RV
cooperative activity, together with the observed smaller expression of NCX in the RV, might help to explain the enhanced effects of afterload on RV terminal pressure fall.
These results are in accordance with observations of other studies that reported increased contractility, faster decline of early pressure fall and impairment of diastolic filling in NCX knock-out mice subjected to chronic elevation of LV afterload (Takimoto
et al. 2002). It was also shown in failing human hearts
that diastolic dysfunction was observed in those patients in whom NCX protein levels did not increase during progression for heart failure, but not in those that showed an increase of NCX, indicating that such mechanism might be important in the pathophysiology of heart
failure (Hasenfuss et al. 1999, Weber et al. 2003). In conclusion, the present study provided novel evidence for differential right and left regulation of diastolic function by afterload and its potential relation with distinct NCX gene expression.
Study limitations
Control values of RV peak systolic pressure in open-chest rats were within the normal in vivo range, whereas LV pressure and contractility were reduced, which could be argued to contribute to the distinctly different diastolic response of the two ventricles to afterload elevations. This is, however, not likely because afterload-induced diastolic dysfunction is exacerbated in the presence of systolic dysfunction (Leite-Moreira and Gillebert 1994, 1996, Gillebert et al. 1997) and in the present study afterload-induced diastolic dysfunction was not observed in the left ventricle.
In view of the different shape and contractile pattern of the two ventricles, it is possible that the method used for the measurement of dimensions of each ventricle does not reflect changes in these two loci in a comparable manner. However, it should be underlined that they were mainly used to document that ventricular dimensions were not significantly altered at end-diastole after a single beat afterload elevation. For this specific purpose we think that such a limitation is negligible. In fact, absence of ventricular end-diastolic dimension changes after an acute afterload elevation was previously documented in various animal species and with different methods for assessement of cardiac dimension (Takimoto et al. 2004, Leite-Moreira et al. 1999a, 2001, Correia-Pinto et al. 2003).
Finally, it is plausible to speculate that the lower expression of NCX in the RV compared to LV myocardium might be responsible for the different diastolic response of the two ventricles. However, the fact that the transcript level was lower does not necessarily mean that the functional protein level must also be lower.
Acknowledgements
Current affiliation of J. Correia-Pinto is Life and Health Sciences Research Institute (ICVS), School of Health Sciences, University of Minho, Braga, Portugal.
This study was supported by grants from Fundacao para a Ciencia e Tecnologia (POCTI/CBO/47519/2002 and POCI/SAU-MMO/61547/2004; partially funded by FEDER), through Cardiovascular R&D Unit (nr. 51-FCT, Portugal).
References
ASSANELLI D, LEW WY, SHABETAI R, LEWINTER MM: Influence of the pericardium on right and left ventricular filling in the dog. J Appl Physiol 63: 1025-1032, 1987.
BABU A, SONNENBLICK E, GULATI J: Molecular basis for the influence of muscle length on myocardial performance. Science 240: 74-76, 1988.
BAKER AE, DANI R, SMITH ER, TYBERG JV, BELENKIE I: Quantitative assessment of independent contributions of pericardium and septum to direct ventricular interaction. Am J Physiol 275: H476-H483, 1998.
BASSANI RA, BASSANI JW, BERS DM: Relaxation in ferret ventricular myocytes: unusual interplay among calcium transport systems. J Physiol Lond 476: 295-308, 1994.
BELENKIE I, DANI R, SMITH ER, TYBERG JV: Effects of volume loading during experimental acute pulmonary embolism. Circulation 80: 178-188, 1989.
BERS DM, BASSANI JW, BASSANI RA: Competition and redistribution among calcium transport systems in rabbit cardiac myocites. Cardiovasc Res 27: 1772-1777, 1993.
BRIDGE JH, SPITZER KW, ERSHLER PR: Relaxation of isolated ventricular cardiomyocytes by a voltage-dependent process. Science 241: 823-825, 1988.
BROWN CD, CHOW E, FARRAR DJ: Left ventricular unloading decreases rate of isovolumic right ventricular pressure decline. Am J Physiol 265: H1663-H1669, 1993.
BRUTSAERT DL, SYS SU: Relaxation and diastole of the heart. Physiol Rev 69: 1228-1315, 1989.
BURGER W, STRAUBE M, BEHNE M, SARAI K, BEYERSDORF F, ECKEL L, DERESER A, SATTER P, KALTENBACH M: Role of pericardial constraint for right ventricular function in humans. Chest 107: 46-49, 1995.
CORREIA-PINTO J, HENRIQUES-COELHO T, OLIVEIRA SM, MOREIRA AF: Evaluation of biventricular function in the rat: a new experimental model. Rev Port Cardiol 21: 1295-1302, 2002.
CORREIA-PINTO J, HENRIQUES-COELHO T, OLIVEIRA SM, LEITE-MOREIRA AF: Distinct load dependence of relaxation rate and diastolic function in Oryctolagus cuniculus and Rattus norvegicus. J Comp Physiol B 173: 401-407, 2003.
CORREIA-PINTO J, HENRIQUES-COELHO T, MAGALHAES S, LEITE-MOREIRA AF: Pattern of right ventricular pressure fall and its modulation by afterload. Physiol Res 53: 19-26, 2004.
DE VROOMEN M, CARDOZO RH, STEENDIJK P, VAN BEL F, BAAN J: Improved contractile performance of right ventricle in response to increased RV afterload in newborn lamb. Am J Physiol 278: H100-H105, 2000. DELL'ITALIA LJ, WALSH RA: Right ventricular diastolic pressure-volume relations and regional dimensions during
acute alterations in loading conditions. Circulation 77: 1276-1282, 1988.
GANDHI SK, POWERS JC, NOMEIR AM, FOWLE K, KITZMAN DW, RANKIN KM, LITTLE WC: The pathogenesis of acute pulmonary edema associated with hypertension. N Engl J Med 344: 17-22, 2001.
GILLEBERT TC, LEITE-MOREIRA AF, DE HERT SG: Load dependent diastolic dysfunction in heart failure. Heart
Fail Rev 5: 345-355, 2000.
GILLEBERT TC, LEITE-MOREIRA AF, DE HERT SG: Relaxation-systolic pressure relation. A load-independent assessment of left ventricular contractility. Circulation 95: 745-752, 1997.
GREYSON C, XU Y, COHEN J, SCHWARTZ GG: Right ventricular dysfunction persists following brief right ventricular pressure overload. Cardiovasc Res 34: 281-288, 1997.
GREYSON C, XU Y, LU L, SCHWARTZ GG: Right ventricular pressure and dilation during pressure overload determine dysfunction after pressure overload. Am J Physiol 278: H1414-H1420, 2000.
HASENFUSS G, SCHILLINGER W, LEHNART SE, PREUSS M, PIESKE B, MAIER LS, PRESTLE J, MINAMI K, JUST H: Relationship between Na+-Ca2+-exchanger protein levels and diastolic function of failing human
myocardium. Circulation 99: 641-648, 1999.
HOUSMANS PR, LEE NK, BLINKS JR: Active shortening retards the decline of the intracellular calcium transient in mammalian heart muscle. Science 221: 159-161, 1983.
KASS DA, YAMAZAKI T, BURKHOFF D, MAUGHAN WL, SAGAWA K: Determination of left ventricular end-systolic pressure-volume relationships by the conductance (volume) catheter technique. Circulation 73: 586-595, 1986.
KENT RL, ROZICH JD, MCCOLLAM PL, MCDERMOTT DE, THACKER UF, MENICK DR, MCDERMOTT PJ, COOPER G: Rapid expression of the Na+-Ca2+ exchanger in response to cardiac pressure overload. Am J
Physiol 265: H1024-H1029, 1993.
LANGER SF. Differential laws of left ventricular isovolumic pressure fall. Physiol Res 51: 1-15, 2002.
LANGER SF, SCHMIDT HD: Different left ventricular relaxation parameters in isolated working rat and guinea pig hearts. Influence of preload, afterload, temperature, and isoprenaline. Int J Card Imaging 14: 229-240, 1998. LEEUWENBURGH BPJ, STEENDIJK P, HELBING WA, BAAN J: Indexes of diastolic RV function: load
dependence and changes after chronic RV pressure overload in lambs. Am J Physiol Heart Circ Physiol 282: H1350-H1358, 2002.
LEITE-MOREIRA AF, CORREIA-PINTO J: Load as an acute determinant of end-diastolic pressure-volume relation.
Am J Physiol 280: H51-H59, 2001.
LEITE-MOREIRA AF, GILLEBERT TC: Nonuniform course of left ventricular pressure fall and its regulation by load and contractile state. Circulation 90: 2481-2491, 1994.
LEITE-MOREIRA AF, GILLEBERT TC: Myocardial relaxation in regionally stunned left ventricle. Am J Physiol 270: H509-H517, 1996.
LEITE-MOREIRA AF, CORREIA-PINTO J, GILLEBERT TC: Afterload induced changes in myocardial relaxation: a mechanism for diastolic dysfunction. Cardiovasc Res 43: 344-353, 1999a.
LEITE-MOREIRA AF, CORREIA-PINTO J, GILLEBERT TC: Load dependence of left ventricular contraction and relaxation. Effects of caffeine. Basic Res Cardiol 94: 284-293, 1999b.
LEITE-MOREIRA AF, CORREIA-PINTO J, GILLEBERT TC: Diastolic dysfunction and hypertension. N Engl J Med
344: 1401-1402, 2001.
LEWARTOWSKI B, WOLSKA BM, ZDANOWSKI K: The effects of blocking the Na-Ca exchange at intervals throughout the physiological contraction-relaxation cycle of single cardiac myocyte. J Mol Cell Cardiol 24: 967-976, 1992.
LU L, XU Y, ZHU P, GREYSON C, SCHWARTZ GG: A common mechanism for concurrent changes of diastolic muscle length and systolic function in intact hearts. Am J Physiol 280: H1513-H1518, 2001.
MATSUBARA H, TAKAKI M, YASUHARA S, ARAKI J, SUGA H: Logistic time constant of isovolumic relaxation pressure-time curve in the canine left ventricle. Better alternative to exponential time constant. Circulation 92: 2318-2326, 1995.
MEEHAN J, PIANO MR, SOLARO RJ, KENNEDY JM: Heavy long-term ethanol consumption induces an alpha- to beta-myosin heavy chain isoform transition in rat. Basic Res Cardiol 94: 481-488, 1999.
MORRIS-THURGOOD JA, FRENNEAUX MP: Diastolic ventricular interaction and ventricular diastolic filling. Heart
Fail Rev 5: 307-323, 2000.
NEGRETTI N, O'NEILL SC, EISNER DA: The effects of inhibitors of sarcoplasmic reticulum function on the systolic Ca2+ transient in rat ventricular myocytes. J Physiol Lond 468: 35-52, 1993.
PEREZ NG, HASHIMOTO K, MCCUNE S, ALTSCHULD RA, MARBAN E: Origin of contractile dysfunction in heart failure: calcium cycling versus myofilaments. Circulation 99: 1077-1083, 1999.
REISER PJ, KLINE WO: Electrophoretic separation and quantification of cardiac myosin heavy chain isoforms in eight mammalian species. Am J Physiol 274: H1048-H1053, 1998.
ROSE CE JR, VAN BENTHUYSEN K, JACKSON JT, TUCKER CE, KAISER DL, GROVER RF, WEIL JV: Right ventricular performance during increased afterload impaired by hypercapnic acidosis in conscious dogs. Circ
Res 52: 76-84, 1983.
SIPIDO KR, VOLDERS PG, VOS MA, VERDONCK F: Altered Na/Ca exchange activity in cardiac hypertrophy and heart failure: a new target for therapy? Cardiovasc Res 53: 782-805, 2002.
TAKIMOTO E, YAO A, TOKO H, TAKANO H, SHIMOYAMA M, SONODA M, WAKIMOTO K, TAKAHASHI T, AKAZAWA H, MIZUKAMI M, NAGAI T, NAGAI R, KOMURO I: Sodium calcium exchanger plays a key role in alteration of cardiac function in response to pressure overload. FASEB J 16: 373-378, 2002.
TAKIMOTO E, SOERGEL DG, JANSSEN PM, STULL LB, KASS DA, MURPHY AM: Frequency- and afterload-dependent cardiac modulation in vivo by troponin I with constitutively active protein kinase A phosphorylation sites. Circ Res 94: 496-504, 2004.
WEBER CR, PIACENTINO V, HOUSER SR, BERS DM. Dynamic regulation of sodium/calcium exchange function in human heart failure. Circulation 108: 2224-2229, 2003.
WEISFELDT ML, FREDERIKSEN JW, YIN FCP, WEISS JL:. Evidence of incomplete left ventricular relaxation in the dog. J Clin Invest 62: 1296-1302, 1978.
YAO A, MATSUI H, SPITZER KW, BRIDGE JH, BARRY WH: Sarcoplasmic reticulum and Na+/Ca2+ exchanger
function during early and late relaxation in ventricular myocytes. Am J Physiol 273: H2765-H2773, 1997. YAO A, SU Z, NONAKA A, ZUBAIR I, LU L, PHILIPSON KD, BRIDGE JH, BARRY WH: Effects of
overexpression of the Na+-Ca2+ exchanger on [Ca2+]i transients in murine ventricular myocytes. Circ Res 82:
657-665, 1998.
Reprint requests
Adelino F. Leite-Moreira, Department of Physiology, Faculty of Medicine, Alameda Professor Hernâni Monteiro, 4200-319 Porto, Portugal. E-mail: [email protected]