HESSD
6, 1523–1550, 2009Characteristics of Changma front at Chujado in Korea
C.-H. You et al.
Title Page
Abstract Introduction
Conclusions References
Tables Figures
◭ ◮
◭ ◮
Back Close
Full Screen / Esc
Printer-friendly Version
Interactive Discussion Hydrol. Earth Syst. Sci. Discuss., 6, 1523–1550, 2009
www.hydrol-earth-syst-sci-discuss.net/6/1523/2009/ © Author(s) 2009. This work is distributed under the Creative Commons Attribution 3.0 License.
Hydrology and Earth System Sciences Discussions
Papers published inHydrology and Earth System Sciences Discussionsare under open-access review for the journalHydrology and Earth System Sciences
Characteristics of precipitation system
accompanied with Changma front at
Chujado, Korea, 5 to 6 July in 2007
C.-H. You1, D.-I. Lee2, S.-M. Jang2, M. Jang2, H. Uyeda3, and T. Shinoda3
1
Atmospheric Environmental Research Institute, Pukyong National University, 599-1 Daeyeon 3-Dong Nam-Gu, Busan, 608-737, South Korea
2
Department of Environmental and Atmospheric Sciences, Pukyong National University, 599-1, Daeyon-Dong, Nam-Gu, Busan, 608-737, South Korea
3
Hydrospheric Atmospheric Research Center, Nagoya University, Furo-Cho, Chikusa-Ku, Nagoya, 464-8601, Japan
Received: 13 January 2009 – Accepted: 12 February 2009 – Published: 3 March 2009
Correspondence to: D.-I. Lee ([email protected])
HESSD
6, 1523–1550, 2009Characteristics of Changma front at Chujado in Korea
C.-H. You et al.
Title Page
Abstract Introduction
Conclusions References
Tables Figures
◭ ◮
◭ ◮
Back Close
Full Screen / Esc
Printer-friendly Version
Interactive Discussion
Abstract
The rainy season from June to July in the East Asia is called as the Changma in Korea, the Meiyu in China, or the Baiu in Japan. The mesoscale convective systems which oc-cur near a front frequently lead to severe weather phenomenon such as localized gust and heavy rainfall. An intensive field experiment was conducted at Chujado (33.95◦N,
5
126.28◦E) to characterize the precipitating system and the size distribution during a Changma period between 21 June 2007 and 11 July 2007. The precipitation system caused heavy rainfalls in Chujado for 20 h and three identified rainfall cases were an-alyzed using the Doppler radar data, disdrometer data, NCEP/NCAR reanalysis data, and sounding data Based on the radar reflectivity at Chujado, each rainfall system
10
maintained for 7 h, 4 h, and 9 h, respectively. The analysis with the total vertical wind shear (TVWS) and the directional vertical wind shear (DVWS) shows that the tempera-ture gradient was the strongest near the surface. Both warm and cold advections were occurred in all cases. The deep warm advection turns out to cause the longer rain-fall lifetime and stronger rainrate but smaller raindrop size. The unstable atmospheric
15
condition, which has cold advection at the surface and warm advection in higher level, causes the larger size diameter of raindrop.
1 Introduction
The rainy season from June to July over the East Asia is referred to the Changma in Korea, the Meiyu in China, and the Baiu in Japan. During this period the rainfall area
20
elongated from west to east is called the Meiyu-Baiu front or the Changma front. The mesoscale convective system occurred near the front frequently lead to severe weather such as localized gust and heavy rainfall. There have been studies on the frontal heavy precipitation events which sometimes accompany strong wind gusts near those areas (Matsumoto et al., 1971a, b; Akiyama, 1973). The formation of frontal systems is
25
HESSD
6, 1523–1550, 2009Characteristics of Changma front at Chujado in Korea
C.-H. You et al.
Title Page Abstract Introduction Conclusions References Tables Figures ◭ ◮ ◭ ◮ Back Close
Full Screen / Esc
Printer-friendly Version
Interactive Discussion China Sea (Ninomiya, 1978; Ninomiya and Akiyama, 1992; Lee et al., 1998; Ding and
Johnny, 2005).
Several field experiments have been carried out in the East Asia by various organiza-tions of the country at various locaorganiza-tions over the region to clarify the structure and evo-lution of these frontal precipitation systems. In Japan, observation studies of Doppler
5
radars were carried out in Okinawa (1987), Kyushu Island (1988), and Kyushu Island and over the East China Sea (1998–2002) (Ishihara et al., 1992, 1995; Takahashi et al., 1996; Yoshizaki et al., 2000). In China, the South China Sea Monsoon Experi-ment (SCSMEX) was carried out between 1996 and 2001 (Lau et al., 2000; Ding et al., 2004). The purpose of these experiments is to understand the mesoscale feature of
10
frontal systems formed in the East Asia (Moteki et al., 2004). In Taiwan TAMEX (Tai-wan Area Mesoscale Experiments) was carried out around Tai(Tai-wan in 1987 (Lin et al., 1991; Ray et al., 1991; Teng et al., 2000). In Korea, the KORMEX (Korean Mesoscale Experiment) was carried out in the middle of Korean peninsula in 1997 and 1998 (Oh et al., 1997) and the KEOP (Korean Enhanced Observing Program) was carried out in
15
the southern part of Korean peninsula from 2001 to present (Choi and Nam, 2006). These observational studies are very important especially in Korean peninsula be-cause more than half of annual precipitation over the Korean peninsula is occurred during the summer and a Changma front accompanies a belt-like peak rainfall zone which are developed in the convergence zone between the tropical maritime and
con-20
tinental air mass (Oh et al., 1997). Some heavy rainfall in Korea is developed by mesoscale disturbances in China and then propagates toward East along the frontal system. There have been also many studies on the synoptic conditions of this heavy rainfall (Kim et al., 1983; Lee et al., 1998). However, the observational studies are focused on the mesoscale features of Changma front and its background field at the
25
HESSD
6, 1523–1550, 2009Characteristics of Changma front at Chujado in Korea
C.-H. You et al.
Title Page
Abstract Introduction
Conclusions References
Tables Figures
◭ ◮
◭ ◮
Back Close
Full Screen / Esc
Printer-friendly Version
Interactive Discussion Global Research Laboratory (GRL) of Korean Ministry of Education, Science &
Tech-nology had set an intensive observation period (here after IOP) at Chujado (33.95◦N, 126.28◦E) between 21 June 2007 and 11 July 2007. We identified three separated rainfall systems as the Changma front passes Chujadoa and we analyzed each of them
5
Section 2 briefly describes the field experiment setup and the methods used for the case analysis. They include the dual Doppler analysis method for kinematic features, directional (total) vertical wind shear for advection (temperature gradient), and the drop size distributions. The synoptic condition and the characteristics of each system are examined in Sect. 3 and summaries and conclusions are presented in Sect. 4.
10
2 Experiment setup and methods
Several meteorological instruments were installed at Chujado during field observations. The rain gages collected rainfall every 1 min and radiosonde was launched every 6 h. The Precipitation Occurrence Sensor Systems (POSS) was installed to find out micro-physical features of the rainfall system. The surface weather chart, S-band Doppler
15
radars and enhanced IR satellite images from MTSAT were deployed. Global reanal-ysis data from NCEP/NCAR were obtained for the synoptic weather conditions of the system. This reanalysis data are composed of 2.5◦×2.5◦ grids with 17 vertical lev-els from 1000 hPa to 10 hPa every 6 h. Observation network covers the southwest-ern coast of the Korean peninsula and the northsouthwest-ern part of the East China Sea with
20
3 Doppler radars, upper-air soundings (Fig. 1).
To observe the kinematic characteristics of the Changma front dual Doppler radar analysis was carried out using radars at Gosan (33◦17 N 126◦09 E) and Seongsan
(33◦23 N 126◦52 E). Those data were interpolated to Cartesian grids using the Sorted Position Radar Interpolation (SPRINT) software (NCAR, 1999) and the Custom Editing
25
HESSD
6, 1523–1550, 2009Characteristics of Changma front at Chujado in Korea
C.-H. You et al.
Title Page Abstract Introduction Conclusions References Tables Figures ◭ ◮ ◭ ◮ Back Close
Full Screen / Esc
Printer-friendly Version
Interactive Discussion 0.5 km, respectively. Particle fall speeds were estimated from the reflectivity
(Bigger-staffand Houze, 1991) and vertical velocity was computed from an elastic equations of continuity (O’Brien, 1970). Three components of wind were estimated by dual Doppler analysis using equations presented by Armijo (1969), and Ray et al. (1978 and 1980). In order to understand the strength of temperature gradient and warm (or cold)
ad-5
vection the total vertical wind shear (here after, TVWS) and directional vertical wind shear (here after, DVWS) were calculated by radiosonde data (Neiman, 2003). The temperature gradient and the advection are approximated from geostrophic thermal wind equation on the isobaric layer (Holton, 1979). If the geostrophic vertical wind shear is assumed to be realistic, the temperature gradient and the advection can be
10
calculated from the Eqs. (1) and (2). It means that the TVWS is proportional to the strength of the temperature gradient and the positive (negative) DVWS is related to the warm (cold) advection.
dV d z ≡ r (d u
d z)
2+(d v
d z)
2,
(1)
dD d z ≡ −(u
d v d z −v
d u
d z) (2)
15
where, V=uiˆ+vjˆ, ¯u=(u(k+1)+u(k−1))/2 ¯v =(v(k+1)+v(k−1))/2,kis the vertical layer anddz is 500 m in this study.
The rain drop size distribution is calculated using the gamma distribution using 3rd, 4th, 6th moments as in Eq. (3) (Ulbrich, 1983; Kozu and Nakamura, 1991):
N(D)=N0Dmexp(−ΛD) (3)
20
HESSD
6, 1523–1550, 2009Characteristics of Changma front at Chujado in Korea
C.-H. You et al.
Title Page
Abstract Introduction
Conclusions References
Tables Figures
◭ ◮
◭ ◮
Back Close
Full Screen / Esc
Printer-friendly Version
Interactive Discussion Daily rainfall amount was distributed from 8.6 mm to 92.2 mm. Among these dates,
rainfall systems on 5th and 6th July were selected because of its significant rainfall amount and different movement direction.
The rainfall at Chujado was caused by Changma and the presence of strong low pressure (Fig. 2). The rainfall system in the period had different direction of movement
5
before and after passing through Chujado and there is a short break between each sys-tem. The vertical profile of temporal reflectivity at Chujado area was calculated from Gosan S-band weather radar (Fig. 3). Three different rainfall systems were catego-rized using animated Gosan radar data as follows (not shown here) i.e., (1) the case 1 occurs in 18:00 LT 5 July to 01:00 LT 6 July; (2) the case 2 occurs in 01:00 05:00 LT 6
10
July, and (3) the case 3 occurs in 05:00 14:00 LT 6 July. The sounding measurement analysis time is denoted as the case number through the analysis. In case 1, rainfall system moved from north-west to south-east. After very short break, another rainfall system (case 2) became weaker and moved to almost east. After short break again, it originated in the west or north-west of Chujado and moved to the north-east (case 3).
15
3 Results
Enhanced IR images from MTSAT-1R show that the convective cells were located at the south-western of Chujado and moved to north-eastward and south-eastward (Fig. 4). At 23:00 LT 5 July (case 1), rainfall system was located at Chujado and Jeju island. At 01:00 LT 6 July (case 2), there is no rainfall system over Chujado area but convective
20
cells are located at the western part of Chujado. After 11:00 LT 6 July (case 3), there is no significant convective system around Chujado.
The surface weather map shows that southerly wind appears in Chujado area due to the low pressure located at the western part of Jejudo (Fig. 5a). There is conver-gence over Korean peninsular. In the 850 hPa level, a strong wind higher than 15 ms−1
25
analy-HESSD
6, 1523–1550, 2009Characteristics of Changma front at Chujado in Korea
C.-H. You et al.
Title Page Abstract Introduction Conclusions References Tables Figures ◭ ◮ ◭ ◮ Back Close
Full Screen / Esc
Printer-friendly Version
Interactive Discussion sis area is covered with weak positive relative vorticity and the westerly wind is over
15 ms−1(Fig. 5c). Strong vertical wind shear would occur since westerly wind in upper
atmosphere and south-westerly at surface level. Upper level jet passed through Ko-rean peninsula and geopotential height at Chujado is between 9659 and 9700 (gpm) (Fig. 5d).
5
The air mass in the troposphere is very humid and there is strong wind shear in the boundary layer below 2 km though out the period. The wind speed became stronger with height reaching 20 ms−1 at 4 km. The Lifted Condensation Level (LCL)
was 935 hPa and the K-Index value which measure was 36 (Fig. 6a). At 03:00 LT 6 July, the wind veered from north-easterly to westerly or north-westerly below 4 km and
10
the wind speed was constant below 1 km and became stronger from 1 km to 3 km with height. The LCL was 927 hPa and the value of K-Index was 40 (Fig. 6b). In case 3, the wind speed at the surface was around 10 ms−1and increased with height below 2 km. All the layers below 10 km in height were humid with relative humidity larger than 80% and the radio sonde moved up and down in the height of 4∼6 km because of the strong
15
downdraft. The LCL was 951 hPa and the value of K-Index was 36 (Fig. 6c).
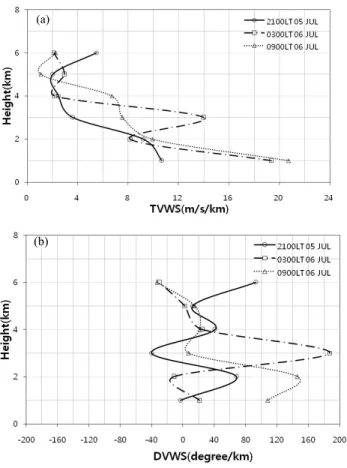
Figure 7 shows the TVWS and DVWS obtained from radio sondes for case 1, 2, and case 3 (at 21:00 LT on 5 July, 03:00 LT, and on 6 July, 09:00 LT). The TVWS is highest at the lower level and decreased by height through the period The high TVWS at case 2 (03:00 LT 6 July) is due to the presence of the lower level jet. The DVWSs were
20
−3.3 degrees/km, 68.2 degrees/km, −40.1 degrees/km, and 41.2 degrees/km at 1 km, 2 km, 3 km and 4 km, respectively. It means that the cold (warm) advection appeared at 1 km and 3 km (2 km and higher than 4 km). In case 2 (at 03:00 LT 6 July) the DVWS was 20.9 degrees/km at 1 km−11.2 degrees/km at 2 km, and 186.9 degrees/km at 3 km. It means that the warm (cold) advection dominated at the height of 1 km,
25
3 km, 4 km and 5 km (2 km and 6 km). In case 3 (at 6 July, 09:00 LT), the DVWS was 108.2 degrees/km at the height of 1 km and the positive DVWS dominated in the whole layer which means the warm advection was significant at all layers.
HESSD
6, 1523–1550, 2009Characteristics of Changma front at Chujado in Korea
C.-H. You et al.
Title Page Abstract Introduction Conclusions References Tables Figures ◭ ◮ ◭ ◮ Back Close
Full Screen / Esc
Printer-friendly Version
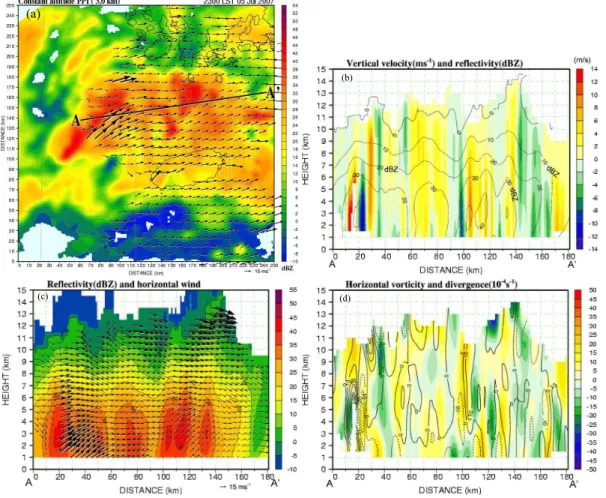
Interactive Discussion were deployed to understand the general kinematic characteristics of each rainfall
sys-tem. In case 1 (at 23:00 LT), horizontal convergence occurred in the western part of Chujado. The rainfall system moves into the north-eastern part (Fig. 8a). In the range of 10 to 30 km of the cross section A-A’ in Fig. 8a, both strong updraft and downdraft greater than ±10 ms−1 appear next to each other (Fig. 8b). The echo top of 30 dBZ
5
reaches to nearly 6 km and the strong south-westerly winds peak is about 30 ms−1 (Fig. 8c). The convergence are from 10 to 30 (×10−4s−1) and horizontal vorticity is 20 (×10−4s−1) within 20 km from “A” point (Fig. 8d). The updraft, convergence, and horizontal vorticity near Chujado were around 5 ms−1, 10 (×10−4s−1), and 5 to 15 (×10−4s−1), respectively.
10
In case 2, the precipitation system with relatively weaker intensity and wind speed than at case 1 moved into the east (Fig. 9a). The downdraft less than 4 ms−1 was dominated within 20 km from A as shown in Fig. 9b. The echo top of 30 dBZ was located around 4 km and the wind direction with height was almost constant (Fig. 9c). The convergence was not significant and horizontal vorticity was 15 (×10−4s−1) within
15
the range of 20 km from “A” (Fig. 9d). The updraft and horizontal vorticity near Chujado were around 3 ms−1and
−1 to 15 (×10−4s−1), respectively.
In case 3, rainfall system moves to the east or north-eastward and strong wind speed reaches greater than 15 ms−1 (Fig. 10a). The downdraft and updraft with 4 to 6 ms−1 occurrs in the range between 40 and 60 km from “A” and 30 dBZ echo top exists around
20
6 km in height (Fig. 10b). In Fig. 10c, south-westerly winds flowed at the surface and higher north-westerly winds than 15 ms−1 flowed at the range of 40 km from “A”. The convergence with 10 (×10−4s−1) occurrs near the 3 km in the range between 40 and 60 km from “A” (Fig. 10d). The updraft, convergence, and horizontal vorticity near Chujado were around 3 ms−1, 10 (×10−4s−1), and−10 to 5 (×10−4s−1), respectively.
25
HESSD
6, 1523–1550, 2009Characteristics of Changma front at Chujado in Korea
C.-H. You et al.
Title Page
Abstract Introduction
Conclusions References
Tables Figures
◭ ◮
◭ ◮
Back Close
Full Screen / Esc
Printer-friendly Version
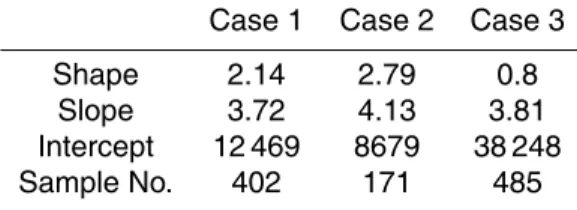
Interactive Discussion from a POSS disdrometer and gamma model for 402, 171, and 485 min, respectively.
The mean rainrate of each case was 6.14, 2.92, and 9.44 mm h−1. In all cases, the shape of DSDs has the exponential fitting except for smaller drop sizes.
However, there is significant difference of number concentrations before and after 2 mm drop in diameter between case 1 and case 3. The drops smaller than 2 mm in
5
diameter were contributed to case 3 and larger ones than 2 mm were contributed to case 1. This tendency is also shown in Fig. 12b. It is considered in simple sense that rain drops in case 1 would be affected by coalescence which decreases the numbers of small size drops and increase those of the larger drops. The DSDs in case 3 would be affected by break-up which increases the numbers of small size drops and decreases
10
the numbers of large size drops. The shapes of each case are 2.14, 2.79, and 0.8, respectively. This means that measured DSDs from gamma model were different from observed ones especially in smaller size since the smallest drop numbers in the ob-servation are more numbers than those of next bin size. In case 3, the empirical power law distribution reasonably agrees with the observation. The slopes are 3.72, 4.13,
15
and 3.81 and the intercepts are 12 469, 8679, and 38 248, respectively. Parameters of each gamma fitting are summarized in Table 1.
4 Summary and conclusions
To understand characteristics of precipitation system accompanied with Changma front, three rainfall cases within one precipitation system were identified and analyzed
20
by using rain gauge data, radio sonde data, POSS, weather radar and NCEP/NCAR re-analysis data. The schematic view of precipitation system accompanied by Changma front from 5 to 6 July in 2007 is shown in Fig. 13. These three rainfall cases caused by one precipitation system in a view of synoptic scale but we found out that there are different structures as follows;
25
HESSD
6, 1523–1550, 2009Characteristics of Changma front at Chujado in Korea
C.-H. You et al.
Title Page Abstract Introduction Conclusions References Tables Figures ◭ ◮ ◭ ◮ Back Close
Full Screen / Esc
Printer-friendly Version
Interactive Discussion than 20 ms−1 was appeared at higher layer than 4 km. The LCL (Lifted
Conden-sation Level) was 935 hPa and the value of K-Index was 36. The TVWS was 10.7 m/s/km around 1 km and became weaker than that at 1 km as the altitude was gradually increased. The DVWS were −3.3 degrees/km, 68.2 degrees/km, −40.1 degrees/km, and 41.2 degrees/km at 1 km, 2 km, 3 km, and 4 km,
respec-5
tively. It means that the cold (warm) advection was appeared at 1 km and 3 km (2 km and higher than 4 km). The strong updraft and downdraft greater than 10 ms−1 repeatedly occurred in the western side of Chujado and the echo top higher than 30 dBZ was around 6 km. The convergence was 10 to 30 (×10−4s−1) and horizontal vorticity was 20 (×10−4s−1) in the western side of Chujado The
10
rain drops in the case 1 would be affected by coalescence resulting the decreased number concentration of small size drops and the increased concentration of the larger drops.
2. Case 2: The wind direction was changed from eastward to west or north-westward upto 4 km and the wind speed was constant below 1 km and became
15
stronger up to 3 km. The LCL was 927 hPa and the value of K-Index was 40. The TWVS were 19.3 and 13.9 m/s/km at the height of 1 km and 3 km, respec-tively. The DVWS was 20.9 degrees/km at 1 km,−11.2 degrees/km at 2 km, and 186.9 degrees/km at 3 km. It means that the warm (cold) advection was domi-nated at the height of 1 km, 3 km, 4 km and 5 km (2 km and 6 km). The downdraft
20
less than 4 ms−1 dominated within 20 km in the western side of Chujado. The echo top higher than 30 dBZ was around 4 km. The convergence around was not significant and horizontal vorticity was 15 (×10−4s−1) in the range of 40 to 60 km western part of Chujado.
3. Case 3: The wind speed at the surface was around 10 ms−1
and was getting
25
HESSD
6, 1523–1550, 2009Characteristics of Changma front at Chujado in Korea
C.-H. You et al.
Title Page
Abstract Introduction
Conclusions References
Tables Figures
◭ ◮
◭ ◮
Back Close
Full Screen / Esc
Printer-friendly Version
Interactive Discussion m/s/km around surface and decreased as increase of the height. The DVWS was
108.2 degrees/km at 1 km in height and its positive value dominated in the whole layer which means the warm advection was significant at all layers. The downdraft and updraft with 4 to 6 ms−1occurred in the range between 40 and 60 km in the western side of Chujado and the echo top height of 30 dBZ was around 6 km.
5
The convergence with 10 (×10−4s−1) occurred upto 3 km in the range between 40 and 60 km western part of Chujado. It appears that the drop size distributions are affected by collisional break-up resulting the increased number concentration of the small size drops and decreased the number concentrations of the larger size drops.
10
In this study, the deep warm advection was proved to make rainfall system maintained for longer time and stronger rainrate but smaller size diameter of raindrop was con-tributed as shown in case 3. The instability, which means the cold advection at the surface and the warm advection at higher layer, would make larger size diameter of raindrop contributed to the rainfall system as occurred in case 1. The characteristics of
15
mesoscale precipitation system may need further investigated by analyzing the system for shorter time and focusing on the precipitation appearance like band shape type with its orientation as it is propagating.
Acknowledgements. This work was supported by the Korea Foundation for International Coop-eration of Science & Technology (KICOS) through a grant provided by the Korean Ministry of
20
HESSD
6, 1523–1550, 2009Characteristics of Changma front at Chujado in Korea
C.-H. You et al.
Title Page Abstract Introduction Conclusions References Tables Figures ◭ ◮ ◭ ◮ Back Close
Full Screen / Esc
Printer-friendly Version
Interactive Discussion
References
Armijo, L.: A theory for the determination of wind and precipitation velocities with Doppler radars, J. Atmos. Sci., 26, 570–575, 1969.
Akiyama, T.: The large-scale aspects of the characteristics features of the Baiu front, Pap. Meteorol. Geophys., 24, 157–188, 1973.
5
Biggerstaff, M. I. and Houze Jr., R. A.: Kinematic and precipitation structure of the 10–11 June, 1985 squall line, Mon. Weather. Rev., 119, 3034–3065, 1991.
Choi, Y. J. and Nam, J. C.: Introduction of phase I KEOP, Proceedings of the spring meeting of KMS, 384–385, 2006 (in Korean).
Ding, Y. H., Li, C. Y., and Liu, Y. J.: Overview of the South China Sea monsoon experiment,
10
Adv. Atmos. Sci., 21, 343–360, 2004.
Ding, Y. H. and Johnny, C. L. C.: The East Asian summer monsoon: and overview, Meteorol. Atmos. Phys., 89, 117–142, 2005.
Holton, J. R.: An introduction to dynamic meteorology: Academic Press, California, United States of America, 391 pp., 1979.
15
Ishihara, M., Tabata, A., Akaeda, K., Yokoyama, T., and Sakakibara, H.: The structure of a sub-tropical squall line observed with a Doppler radar, Tenki, 39, 727–743, 1992 (in Japanese). Ishihara, M., Fujiyoshi, Y., Tabata, A., Sakakibara, H., Akaeda, K., and Okamura, H.: Dual
Doppler radar analysis of an intense mesoscale rainband generated along the Baiu front in 1988: Its kinematical structure and maintenance process, J. Meteorol. Soc. Jpn., 73, 139–
20
163, 1995.
Kim, S. S., Chung, C. H., Park, S. U., and Lee, B. S.: The characteristic structural differences of the rainy front (Changma front) between the wet and dry seasons, J. Korean Meteor. Soc., 19, 12–32 , 1983 (in Korean).
Kozu, T. and Nakamura, K.: Rainfall parameter estimation from dual-radar measurements
com-25
bining reflectivity profile and path-integrated attenuation, J. Atmos. Ocean. Tech., 8, 259– 271, 1991.
Lau, K. M., Ding, Y. H., Wang, J. T., Johnson, R., Cifelli, R., Gerlach, J., Thjiely, O., Rikebbach, T., Tsay, S. C., and Lin, P. H.: A report of the field operation and early results of the South China Sea monsoon experiment (SCSMEX), B. Am. Meteor. Soc., 81, 1261–1270, 2000.
30
HESSD
6, 1523–1550, 2009Characteristics of Changma front at Chujado in Korea
C.-H. You et al.
Title Page Abstract Introduction Conclusions References Tables Figures ◭ ◮ ◭ ◮ Back Close
Full Screen / Esc
Printer-friendly Version
Interactive Discussion Lin, Y. J., Pasken, R. W., and Chang, H. W.: The structure of a subtropical prefrontal convective
rainband. Part I: Mesoscale kinematic structure determined from dual Doppler measure-ments, Mon. Weather Rev., 120, 1816–1836, 1991.
Miller, L. J. and Fredric, S. M.: Custom Editing and Display of Reduced Information in Carte-sian space (CEDRIC) manual, National Center for Atmospheric Research, Colorado, United
5
States of America, 130 pp., 1998.
Moteki, Q., Uyeda, H., Maesaka, T., Shinoda, T., Yoshizaki, M., and Kato, T.: Structure and development of two merged rainbands observed over the East China Sea during X-BAIU-99 PART I: Meso-β-scale structure and development processes, J. Meteorol. Soc. Jpn., 82, 19–24, 2004.
10
NCAR: Sorted Position Radar Interpolation (SPRINT) manual, National Center for Atmospheric Research, Colorado, United States of America, 76 pp., 1999.
Matsumoto, S., Yoshizumi, S., and Takeuchi, M.: Characteristic feature of Baiu front associated with heavy rainfall, J. Meteorol. Soc. Jpn., 49, 267–281, 1971a.
Matsumoto, S., Yoshizumi, S., and Takeuchi, M.: On the structure of the “Baiu Front” and the
15
associated intermediate scale disturbances in the lower atmosphere, J. Meteorol. Soc. Jpn., 48, 479–491, 1971b.
Nieman, P. J.: Private communication, 2003.
Ninomiya, K.: Heavy rainfalls associated with frontal depression in Asia subtropical humid region. PART I: Synoptic-scale features, J. Meteorol. Soc. Jpn., 56, 253–266, 1978.
20
Ninomiya, K. and Akiyama, T.: Multi-scale features of Baiu, the Summer Monsoon over Japan and East Asia, J. Meteorol. Soc. Jpn., 70, 467–495, 1992.
O’Brien, J. J.: Alternative solution to the classical vertical velocity problem, J. Appl. Meteorol., 9, 197–203, 1970.
Oh, J. H., Kwon, W. T., and Ryoo, S. B.: Review of the researches on Changma and future
25
observational study (KORMEX), Adv. Atmos. Sci., 14, 207–222, 1997.
Ray, P. S., Wagner, K. K., Johnson, K .W., Stephens, J. J., Bumgarner, W. C., and Mueller, E.A.: Triple-Doppler observations of a convective storm, J. Appl. Meteorol., 17, 1201–1212, 1978. Ray, P. S., Ziegler, C. L., Bumgarner, W., and Serafin, R. J.: Single- and multiple-Doppler radar
observations of tornadic storms, Mon. Weather Rev., 108, 1607–1625, 1980.
30
Ray, P. S., Robinson, A., and Lin, Y.: Radar analysis of a TAMEX frontal system, Mon. Weather Rev., 119, 2519–2539, 1991.
fea-HESSD
6, 1523–1550, 2009Characteristics of Changma front at Chujado in Korea
C.-H. You et al.
Title Page
Abstract Introduction
Conclusions References
Tables Figures
◭ ◮
◭ ◮
Back Close
Full Screen / Esc
Printer-friendly Version
Interactive Discussion tures of heavy rainfall events in lat period of the Baiu season in July 1988, Nagasaki
Prefec-ture, J. Meteorol. Soc. Jpn., 74, 539–561, 1996.
Teng, J. H., Chen, C. S., Wang, T. C. C., and Chen, Y. L.: Orographic effects on a squall line system over Taiwan, Mon. Weather Rev., 128, 1123–1138, 2000.
Ulbrich, C. W.: Natural variations in the analytical form of the raindrop size distribution, J. Clim.
5
Appl. Meteorol., 22, 1764–1775, 1983.
Yoshizaki, M., Kato, T., Tanaka, Y., Takayama, H., Shoji, Y., Seko, H., Arao, K., Manabe, K., and Members of X-BAIU-98 Observation: Analytical and numerical study of the 26 June 1998 orographic rainband observed in Western Kyushu, Japan, J. Meteorol. Soc. Jpn., 78, 835–856, 2000.
HESSD
6, 1523–1550, 2009Characteristics of Changma front at Chujado in Korea
C.-H. You et al.
Title Page
Abstract Introduction
Conclusions References
Tables Figures
◭ ◮
◭ ◮
Back Close
Full Screen / Esc
Printer-friendly Version
Interactive Discussion
Table 1.The characteristics of each case obtained from DSDs.
Case 1 Case 2 Case 3
Shape 2.14 2.79 0.8
HESSD
6, 1523–1550, 2009Characteristics of Changma front at Chujado in Korea
C.-H. You et al.
Title Page
Abstract Introduction
Conclusions References
Tables Figures
◭ ◮
◭ ◮
Back Close
Full Screen / Esc
Printer-friendly Version
Interactive Discussion
HESSD
6, 1523–1550, 2009Characteristics of Changma front at Chujado in Korea
C.-H. You et al.
Title Page
Abstract Introduction
Conclusions References
Tables Figures
◭ ◮
◭ ◮
Back Close
Full Screen / Esc
Printer-friendly Version
Interactive Discussion
HESSD
6, 1523–1550, 2009Characteristics of Changma front at Chujado in Korea
C.-H. You et al.
Title Page
Abstract Introduction
Conclusions References
Tables Figures
◭ ◮
◭ ◮
Back Close
Full Screen / Esc
Printer-friendly Version
Interactive Discussion
HESSD
6, 1523–1550, 2009Characteristics of Changma front at Chujado in Korea
C.-H. You et al.
Title Page
Abstract Introduction
Conclusions References
Tables Figures
◭ ◮
◭ ◮
Back Close
Full Screen / Esc
Printer-friendly Version
Interactive Discussion
HESSD
6, 1523–1550, 2009Characteristics of Changma front at Chujado in Korea
C.-H. You et al.
Title Page
Abstract Introduction
Conclusions References
Tables Figures
◭ ◮
◭ ◮
Back Close
Full Screen / Esc
Printer-friendly Version
Interactive Discussion
HESSD
6, 1523–1550, 2009Characteristics of Changma front at Chujado in Korea
C.-H. You et al.
Title Page
Abstract Introduction
Conclusions References
Tables Figures
◭ ◮
◭ ◮
Back Close
Full Screen / Esc
Printer-friendly Version
Interactive Discussion
HESSD
6, 1523–1550, 2009Characteristics of Changma front at Chujado in Korea
C.-H. You et al.
Title Page
Abstract Introduction
Conclusions References
Tables Figures
◭ ◮
◭ ◮
Back Close
Full Screen / Esc
Printer-friendly Version
Interactive Discussion
HESSD
6, 1523–1550, 2009Characteristics of Changma front at Chujado in Korea
C.-H. You et al.
Title Page
Abstract Introduction
Conclusions References
Tables Figures
◭ ◮
◭ ◮
Back Close
Full Screen / Esc
Printer-friendly Version
Interactive Discussion
HESSD
6, 1523–1550, 2009Characteristics of Changma front at Chujado in Korea
C.-H. You et al.
Title Page
Abstract Introduction
Conclusions References
Tables Figures
◭ ◮
◭ ◮
Back Close
Full Screen / Esc
Printer-friendly Version
Interactive Discussion
HESSD
6, 1523–1550, 2009Characteristics of Changma front at Chujado in Korea
C.-H. You et al.
Title Page
Abstract Introduction
Conclusions References
Tables Figures
◭ ◮
◭ ◮
Back Close
Full Screen / Esc
Printer-friendly Version
Interactive Discussion
HESSD
6, 1523–1550, 2009Characteristics of Changma front at Chujado in Korea
C.-H. You et al.
Title Page
Abstract Introduction
Conclusions References
Tables Figures
◭ ◮
◭ ◮
Back Close
Full Screen / Esc
Printer-friendly Version
Interactive Discussion
Fig. 11.The time series of rain drop size (left axis) and rainrate (right axis) derived from POSS
HESSD
6, 1523–1550, 2009Characteristics of Changma front at Chujado in Korea
C.-H. You et al.
Title Page
Abstract Introduction
Conclusions References
Tables Figures
◭ ◮
◭ ◮
Back Close
Full Screen / Esc
Printer-friendly Version
Interactive Discussion
HESSD
6, 1523–1550, 2009Characteristics of Changma front at Chujado in Korea
C.-H. You et al.
Title Page
Abstract Introduction
Conclusions References
Tables Figures
◭ ◮
◭ ◮
Back Close
Full Screen / Esc
Printer-friendly Version
Interactive Discussion