www.atmos-meas-tech.net/9/5763/2016/ doi:10.5194/amt-9-5763-2016
© Author(s) 2016. CC Attribution 3.0 License.
Measuring OVOCs and VOCs by PTR-MS in an urban roadside
microenvironment of Hong Kong: relative humidity and
temperature dependence, and field intercomparisons
Long Cui1, Zhou Zhang2, Yu Huang3,4, Shun Cheng Lee1, Donald Ray Blake5, Kin Fai Ho6, Bei Wang7, Yuan Gao1,8, Xin Ming Wang2, and Peter Kwok Keung Louie9
1Department of Civil and Environmental Engineering, The Hong Kong Polytechnic University, Hung Hom, Hong Kong, China
2State Key Laboratory of Organic Geochemistry, Guangzhou Institute of Geochemistry, Chinese Academy of Sciences, Guangzhou, China
3Key Lab of Aerosol Chemistry & Physics, Institute of Earth Environment, Chinese Academy of Sciences, Xi’an, China
4State Key Lab of Loess and Quaternary Geology (SKLLQG), Institute of Earth Environment, Chinese Academy of Sciences, Xi’an, China
5Department of Chemistry, University of California, Irvine, CA, USA
6School of Public Health and Primary Care, The Chinese University of Hong Kong, Shatin, Hong Kong, China
7Faculty of Science and Technology, Technological and Higher Education Institute of Hong Kong, Hong Kong, China
8Department of Civil Engineering, Chu Hai College of Higher Education, New Territories, Hong Kong, China
9Hong Kong Environmental Protection Department, Revenue Tower, 5 Gloucester Road, Wanchai, Hong Kong, China
Correspondence to:Shun Cheng Lee ([email protected])
Received: 14 April 2016 – Published in Atmos. Meas. Tech. Discuss.: 1 June 2016 Revised: 26 October 2016 – Accepted: 15 November 2016 – Published: 1 December 2016
Abstract. Volatile organic compound (VOC) control is an important issue of air quality management in Hong Kong because ozone formation is generally VOC limited. Several oxygenated volatile organic compound (OVOC) and VOC measurement techniques – namely, (1) offline 2,4-dinitrophenylhydrazine (DNPH) cartridge sampling fol-lowed by high-performance liquid chromatography (HPLC) analysis; (2) online gas chromatography (GC) with flame ionization detection (FID); and (3) offline canister sampling followed by GC with mass spectrometer detection (MSD), FID, and electron capture detection (ECD) – were applied during this study. For the first time, the proton transfer reaction–mass spectrometry (PTR-MS) technique was also introduced to measured OVOCs and VOCs in an urban
0.60, and 0.93, respectively. Overall, fair agreements were found between PTR-MS and online GC-FID for benzene (slope=1.23,r=0.95), toluene (slope=1.01,r=0.96) and C2-benzenes (slope=1.02, r=0.96) after correcting ben-zene and C2-benben-zenes levels which could be affected by frag-ments formed from ethylbenzene. For the intercomparisons between PTR-MS and offline canister measurements by GC-MSD/FID/ECD, benzene showed good agreement, with a slope of 1.05 (r=0.62), though PTR-MS had lower values for toluene and C2-benzenes with slopes of 0.78 (r=0.96) and 0.67 (r=0.92), respectively. All in all, the PTR-MS in-strument is suitable for OVOC and VOC measurements in urban roadside areas.
1 Introduction
Volatile organic compounds (VOCs), which are important precursors of tropospheric ozone and secondary organic aerosols (SOAs) (Sillman, 2002), can be emitted from mul-tiple anthropogenic sources (e.g., vehicular emissions, in-dustrial emissions, and solvent usage) and biogenic sources (Watson et al., 2001; Atkinson and Arey, 2003). VOCs also have adverse impact on human beings (von Schneidemesser et al., 2010; Lelieveld et al., 2015). As one of the most densely populated cities in the world, Hong Kong has over 7.2 million people and more than 699 540 registered vehicles in an area of 1104 km2 as of December 2014 (Hong Kong Transport Department, 2014). Special attention has been paid to the characteristics of roadside VOCs and their impacts on the local air quality of Hong Kong during the past years (Lee et al., 2002; Ho et al., 2004; Guo et al., 2007; Louie et al., 2013; Ling and Guo, 2014). Previous studies have shown that vehicular emissions are one of the major contributors to ambient VOCs in Hong Kong (Guo et al., 2007). Lau et al. (2010) found that 31–48 % of ambient VOCs in Hong Kong were generated by vehicle- and marine-vessel-related sources in 2002–2003, and the percentage increased to 40– 54 % in 2006–2007.
In order to investigate urban roadside VOCs in Hong Kong, multiple sampling and analytical techniques were used, such as offline 2,4-dinitrophenylhydrazine (DNPH) cartridge sampling followed by high-performance liquid chromatography (HPLC) analysis for oxygenated volatile organic compounds (OVOCs); online gas chromatography (GC) with flame ionization detection (FID); and offline can-ister sampling followed by GC with mass spectrometer de-tection (MSD), FID, and electron capture dede-tection (ECD) for VOCs (Ho et al., 2013; Cheng et al., 2014; Ou et al., 2015). These techniques, however, can be impacted by their relatively low sampling resolution that may lead to the un-derestimation or overestimation of ambient OVOC and VOC concentration levels (Wisthaler et al., 2008; Jobson et al., 2010; Wang et al., 2014). Moreover, since there is no single
technique that can measure all OVOCs and VOCs simultane-ously, different kinds of sampling and analytical techniques are usually used to obtain the measurements of these species (Wisthaler et al., 2008; Ambrose et al., 2010; Jobson et al., 2010; Warneke et al., 2011a).
Proton transfer reaction-mass spectrometry (PTR–MS) is a relatively novel method that can fulfill online measure-ments of OVOCs and VOCs at trace levels in ambient air. Proton transfer enables soft ionization of chemical species that have a higher proton affinity (PA) than that of the reagent species (i.e., H2O). PTR-MS does not need any sam-ple treatment such as drying and/or precondensation like gas chromatographic analysis, and it is available for monitor-ing OVOCs which are quite difficult to quantify from canis-ter samples. Hence, PTR-MS has recently been widely used in atmospheric chemistry research (de Gouw and Warneke, 2007; Jobson et al., 2010). PTR-MS has been used in China for environmental studies throughout the years (Wang et al., 2014, 2016). But PTR-MS was firstly used in an urban road-side microenvironment of Hong Kong to measure ambient OVOCs and VOCs in this study.
Formaldehyde (HCHO) is one of the most abundant OVOCs in Hong Kong. The lifetime of HCHO in the bound-ary layer is estimated to be only several hours when pho-tolysis and its reaction with OH radical occur with sunlight. Because HCHO is carcinogenic (Kerns et al., 1983), it is one of the OVOCs of most interest in urban areas. Only offline DNPH cartridge sampling analyzed by HPLC has previously been used to determine the level of ambient formaldehyde in Hong Kong (Ho et al., 2002; Guo et al., 2004; Louie et al., 2013; Cheng et al., 2014). PTR-MS was introduced to mea-sure ambient concentrations of formaldehyde continuously in this study. HCHO can be protonated by the following Re-action (R1):
HCHO+H3O+ → HCHOqH++H2O, (R1) HCHOqH++H2O → HCHO+H3O+. (R2) However, because the proton affinity (PA) of formaldehyde (170.4 kcal mol−1) is just slightly higher than that of wa-ter (165.2 kcal mol−1), the backward Reaction (R2) of pro-tonated formaldehyde with H2O can lead to an underestima-tion of HCHO by PTR-MS (Hansel et al., 1997). Jobson and McCoskey (2010) found that the sensitivity to HCHO can be improved by removing water vapor from the air sampling in-let. Correction for absolute humidity (AH) effects on HCHO measurement by PTR-MS was further discussed by Vlasenko et al. (2010). However, the previous studies did not fully dis-cuss the effect of ambient relative humidity (RH) and/or tem-perature (T) separately and integratively on HCHO measure-ments by PTR-MS. In addition, few studies have reported in-tercomparisons between PTR-MS and DNPH-HPLC during field studies, especially in urban roadside areas.
mea-surement techniques. The effect of ambient conditions (RH and T) on OVOC and VOC measurements by PTR-MS is discussed in this paper. Detailed comparisons of PTR-MS, DNPH-HPLC, online GC-FID, and offline canister sampling followed by GC-MSD/FID/ECD for OVOC and VOC mea-surements at an urban roadside site in Hong Kong are con-ducted.
2 Methodology
2.1 Field sampling site
An urban roadside station, Mong Kok (MK) air quality moni-toring station (AQMS), was chosen as the field sampling site in this study. This sampling site, which is one of the three roadside monitoring stations established by the Hong Kong Environment Protection Department (HKEPD), is located in a mixed commercial and residential area with heavy daily traffic in Hong Kong. Briefly, MK AQMS is the best rep-resentative of the roadside environment in Hong Kong, and more detailed information can be found elsewhere (Chan et al., 2002; Lee et al., 2002). The field study was conducted in May, August, and November 2013 and February, May, and August 2014 to cover the seasonal variations of traffic-related pollutants.
2.2 PTR-MS
A commercially available PTR-MS instrument (PTR-QMS 500, IONICON Analytik GmbH, Innsbruck, Austria) was used in this study. The PTR-MS instrument has been de-scribed in detail elsewhere (Lindinger et al., 1998; de Gouw et al., 2003; de Gouw and Warneke, 2007). Briefly, PTR-MS mainly consists of a discharge ion source, a drift tube, and a quadrupole mass spectrometer. In this study, H3O+ was utilized as the reagent ion, the drift tube was operated at 2.2 mbar pressure, and the electric field was maintained at 600 V difference. The E/N (Estands for the electric field strength, andN stands for the air density inside drift tube) value in the drift tube was kept at 136 Townsend (Td). The electric field maintains a controlled ion velocity in the drift tube so that the clustering of water ions can be reduced. The PTR-MS inlet system and the drift tube were maintained at 60◦C to minimize wall losses.
The PTR-MS instrument was located in a shelter with an air-conditioning system at the MK station. The inlet was lo-cated about 2 m above the ground. A 1/8′′ Teflon line was
used as a sample line. The sample air was pumped at a flow rate of 75 mL min−1, with an estimated residence time of 2 s in the inlet line. An in-line particulate filter (4.7 mm Teflon membrane filter assembly, Whatman Inc., Clifton, NJ, USA) was used to prevent particles from entering the instrument.
An Ionimed mixed-VOC gas standard (IONICON An-alytik GmbH, Innsbruck, Austria) was used for PTR-MS calibration in this study. Seventeen species were contained
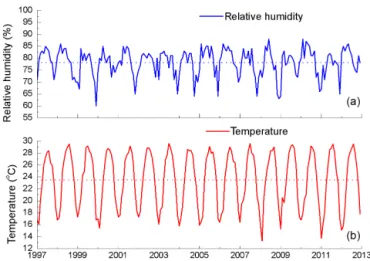
Figure 1.Statistics of relative humidity and temperature of Hong Kong from 1997 to 2012; dashed lines represent the average levels of RH andT (data were obtained from the Hong Kong Observa-tory).
in the gas standard, namely formaldehyde, methanol, ace-tonitrile, acetaldehyde, ethanol, acrolein, acetone, isoprene, crotonaldehyde, 2-butanone, benzene, toluene, o-xylene, chlorobenzene, α-pinene, 1,2-dichlorobenzene, and 1,2,4-trichlorobenzene with mixing ratios about 1 ppm for each compound. Standard VOC gas mixtures (Supelco TO-14 Cal-ibration Mix) were used for determining the transmission curve of the PTR-MS instrument. Zero air was generated by a gas calibration unit (GCU) (IONICON Analytik GmbH, Innsbruck, Austria) with a VOC scrubber installed inside the GCU. Background level was determined by zero air with the frequency of half an hour each day. The relative humidity and temperature of inlet gas were controlled by adjusting the humidification chamber and a dew point mirror inside the GCU. Ionimed mixed-VOC gas standard was diluted with four different ratios (0.08, 0.06, 0.04, and 0.001) to calibrate the PTR-MS. Calibrations were done every 6 days to ensure the accuracy of PTR-MS. The relative humidity and temper-ature of inlet gas for calibration were set at 80 % and 25◦C, respectively, according to the average level (RH=78.2 % andT=23.5◦C) of ambient air in Hong Kong from 1997 to 2012 (shown in Fig. 1; data were obtained from the Hong Kong Observatory, http://www.hko.gov.hk/cis/climat_.htm). The accuracy and the measurement precision of the PTR-MS were 3–20 and 1.6–10.0 %, respectively.
Table 1.Detection limit, accuracy, precision, and total uncertainty of the PTR-MS for individual VOCs in gas standard.
Component m/z LOD (pptv) Accuracy Precision Uncertainty
Formaldehyde 31 296 11.9 % 3.1 % 12.3 %
Methanol 33 162 5.3 % 2.7 % 5.9 %
Acetonitrile 42 17 7.4 % 2.0 % 7.7 %
Acetaldehyde 45 101 3.0 % 1.7 % 3.4 %
Ethanol 47 237 19.9 % 10.0 % 22.3 %
Acrolein 57 23 11.8 % 2.4 % 12.0 %
Acetone 59 31 4.2 % 1.7 % 4.5 %
Isoprene 69 40 18.0 % 3.4 % 18.3 %
Crotonaldehyde 71 25 15.5 % 2.1 % 15.6 %
2-Butanone 73 18 6.3 % 1.6 % 6.5 %
Benzene 79 12 4.6 % 1.8 % 4.9 %
Toluene 93 30 7.1 % 2.0 % 7.4 %
o-Xylene 107 25 7.4 % 1.7 % 7.6 %
α-Pinene 137 29 9.9 % 2.2 % 10.1 %
Dichlorobenzenes 147 21 7.8 % 2.7 % 8.3 %
Trichlorobenzenes 181 96 10.0 % 3.3 % 10.5 %
Table 2.Summary of detection limit, accuracy, and precision of different techniques used in this study.
Method Measured parameters LOD (pptv) Accuracy Precision
PTR-MS OVOCs and VOCs 12–296 3–20 % 1.6–10.0 %
DNPH-HPLC OVOCs 20–450 1–15 % 0.5–10.0 %
Online GC-FID VOCs 15–1186 5–20 % 1.2–10.1 %
Offline GC-MSD/FID/ECD VOCs 1–10 1–5 % 0.5–5.0 %
The total uncertainty for each species can be determined by the geometric sum of the accuracy and precision (Eerdekens et al., 2009). The LOD, accuracy, precision, and total uncer-tainty for each species measured by PTR-MS are listed in Table 1. Table 2 is a summary table in which the LOD, ac-curacy, and precision for PTR-MS and the other three tech-niques described in following sections are shown.
2.3 DNPH-HPLC
Twenty-four-hour (00:00–23:59) OVOC samples were col-lected by an ATEC Model 2200 automated sampler (Atmo-spheric Technology, Malibu, CA, USA) once every 6 days in each sampling month. An ozone scrubber (Sep-Pak; Waters Corporation, Milford, MA) was used to remove ozone dur-ing carbonyl sampldur-ing with 2,4-dinitrophenylhydrazine car-tridges (Waters Sep-Pak DNPH-Silica, Milford, MA). The flow rate was regulated at 0.7 L min−1by a mass flow con-troller. Cartridge samples were analyzed according to the United States Environmental Protection Agency (USEPA) Method TO-11A (USEPA, 1999).
A HPLC system (Perkin Elmer Series 2000, MA, USA) coupled with an ultraviolet (UV) detector operating at 360 nm was used for chemical analysis. The column for separation was a 4.6×150 mm Hypersil ODS 5 m reversed phase column (Alltech, Deerfield, IL) at room temperature
2.4 Online GC-FID
An online GC-FID analyzer (Syntech Spectras GC 955, Se-ries 600/800, the Netherlands), which consists of two sep-arate systems for detection of C2–C5 and C6–C10 hydro-carbons was used to collect VOC speciation data contin-uously from May 2013 to August 2014. All the online GC-FID data used in this study were measured by the HKEPD (http://epic.epd.gov.hk/ca/uid/airdata). Data quality was assured by strict quality assurance and quality control (QA/QC) procedures. Weekly calibrations were conducted by using NPL standard gas (National Physical Laboratory, Teddington, Middlesex, UK). More details about the on-line GC-FID system can be found from previous studies in Hong Kong (Xue et al., 2014; Ou et al., 2015). The C2– C10 hydrocarbon species included ethane, ethene, ethyne, propane, propene, n-butane, i-butane, 1-butene, trans -2-butene,cis-2-butene, 1,3-butadiene,n-pentane,i-pentane, 1-pentene, trans-2-pentene, n-hexane, 2-methyl pentane, n -heptane,n-octane,i-octane, benzene, toluene, ethylbenzene,
m,p-xylene, o-xylene, 1,2,4-trimethylbenzene, and 1,3,5-trimethylbenzene. Sampling resolution for the online GC-FID analyzer was 30 min, and hourly averaged data were used for further analysis. The accuracy and precision of the measurements were 5–20 and 1.2–10.1 %, respectively. The accuracy of each species measured by online GC-FID was determined by the percentage difference between measured mixing ratio and actual mixing ratio based on weekly span checks and monthly calibrations. The precision was based on the 95 % probability limits for the integrated precision check results (Ling et al., 2013; Lyu et al., 2016).
2.5 Offline GC-MSD/FID/ECD
Twenty-four-hour (00:00–23:59) VOC samples were col-lected using 2 L electropolished, conditioned stainless-steel canisters and an ATEC Model 2200 automated sampler (At-mospheric Technology, Malibu, CA) once every 6 days in each sampling month. All canisters used in this study were pre-cleaned and evacuated by the Rowland–Blake group at the University of California, Irvine (UCI). Detailed infor-mation of the preparation and pre-conditioning of the can-isters can be found elsewhere (Blake et al., 1994; Simp-son et al., 2010). After sampling, canisters with air samples were sent back to the laboratory at UCI for VOC analy-sis by a GC-MSD/FID/ECD system within 1 week of col-lecting the canister samples. Complete analytical details are given in Colman et al. (2001). Briefly, the sample flow is split into five streams, with each stream chromatographi-cally separated on an individual column and sensed by a single detector, namely (1) FID with a DB-1 column (60 m; ID: 0.32 mm; film: 1 mm); (2) FID with PLOT (30 m; ID: 0.53 mm)+DB-1 (5 m; ID: 0.53 mm; film: 1 mm) columns; (3) ECD with a Restek 1701 column (60 m; ID: 0.25 mm; film: 0.50 mm); (4) ECD with DB-5 (30 m; ID: 0.25 mm;
film: 1 mm)+Restek 1701 (5 m; ID: 0.25 mm; film: 0.5 mm) columns; and (5) MSD with a DB-5ms column (60 m; ID: 0.25 mm; film: 0.5 mm). This technique was used to measure 55 C1–C10VOCs, including all those measured by the online GC-FID. The accuracy of the VOC measurements was 5 % or better; replicate runs of the calibration standards yielded a measurement precision that ranged from 0.5 to 5 % (Colman et al., 2001; Ling and Guo, 2014; Lyu et al., 2016).
3 Results and discussion
3.1 Effect of ambient RH andT on PTR-MS measurement
As described in the Methodology section, four-point cali-brations were conducted to get the calibration curves. The experimental reaction rate coefficient (k) of each com-pound was obtained by the original inputkvalue (typically 2.0×10⁻⁹cm3s−1)multiplied by the slope of the measured concentration to the diluted concentration of standard gas, because the volume mixing ratio (VMR) of each species is inversely related to its reaction rate coefficient (k) (see Eq. 1) (de Gouw and Warneke, 2007). Experimentalkvalues of se-lected VOC and OVOC species were obtained under different ambient conditions, and RH ranged from 25 to 100 %, while T ranged from 5 to 25◦C through this method.
VMR=µ0N0 kL ×
E N2×
IRH+×TRH 3O+ IH3O+×TRRH+
, (1)
where VMR is the volume mixing ratio (ppbv);µ0is the re-duced mobility (cm V−1s−1),N
0is the gas number density at standard pressure (1 atm) and temperature (273.15 K),kis the reaction rate coefficient (10−9cm3s−1),L is the length of the drift tube (9.3 cm in this study),Eis the electric field strength (V m−1),Nis the air density in the drift tube (m−3), I is the numbers of detected ions (cps), and TR is the trans-mission factor of respective ions.
Figure 2.The effect of ambient RH on sensitivity and experimentalkvalue of HCHO (m/z31) and benzene (m/z79).
and Smith (2008). Beauchamp et al. (2013) used a simi-lar mixed gas standard for PTR-MS calibration; low sensi-tivity of HCHO was also found below 2 ncps ppbv−1 when the RH ranged from 20 to 100 %. Moreover, strong nonlin-ear dependence on RH for HCHO was found by Beauchamp et al. (2013), and the sensitivity of HCHO significantly de-creased by about 50 % when the RH of inlet air inde-creased from 20 to 100 %, which is comparable to this study. The ef-fect of ambient temperature on sensitivity and experimental
kvalue of HCHO and benzene is plotted in Fig. 3 under dif-ferent RH. Both the sensitivity and experimentalkvalue sig-nificantly dropped by 30–40 % when the temperature of inlet air increased from 5 to 25◦C. Both sensitivity and experi-mentalkvalue maintained a relatively stable level (variance less than 5 %) for benzene when the temperature of inlet air was changed under the given RH, and the same for the other species in the standard gas excluding HCHO. A quadratic polynomial fit was found to be the best-fit model (r2> 0.98) for the experimentalkvalue of HCHO with a single variable (RH orT of inlet air). Because the RH andT of inlet gas for calibration were set at 80 % and 25◦C, respectively,R
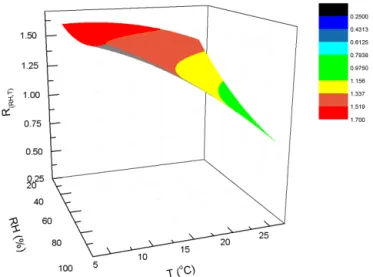
(RH,T) (the ratio ofkvalue under given ambient conditions to the experimentalkvalue under 80 % and 25◦C) was chosen to explore the integrated effects of ambient RH and T on ex-perimentalkvalue. Poly 2-D regression, which used a binary quadratic equation, was found to be the best nonlinear sur-face simulation of R(RH,T ), ambient RH, andT for HCHO in this study, and the following equation (Eq. 2) shows the
relationship between them:
R(RH,T )= (2)
r0+a·RH+b·T+c·RH2+d·T2+f·RH·T , whereR(RH,T )is the ratio of experimental reaction rate under given RH andT to calibrated reaction rate under 80 % and 25◦C, RH is the relative humidity of inlet gas/air, andT is the temperature of inlet gas/air.
The constant term r0 and coefficients a, b,c, d, and f as well as the correlation coefficients of all species in the gas standard are listed in Table 3. The difference ofR(RH,T ) was within 10 % for all species except HCHO (m/z 31) when the condition of inlet air changed within the controlled range for RH (25–100 %) andT (5–25◦C). TheR(RH,T ) for formaldehyde differs significantly because of humidity ef-fects on HCHO measurement by the PTR-MS. Excellent cor-relation was found betweenR(RH,T ), ambient RH, andT for HCHO (m/z31) with a correlation coefficient of 0.97. The relationship between these three factors is plotted in Fig. 4.
Figure 3.The effect of ambient temperature on sensitivity and experimentalkvalue of HCHO (m/z31) and benzene (m/z79) under different RH.
Table 3.Poly 2-D simulation results of different species in gas standard for the PTR-MS.
Component m/z r Value
r0 a b c d f
Formaldehyde 31 0.97 1.63E+00 −3.81E−03 1.92E−02 5.10E−05 −6.41E−04 −3.76E−04 Methanol 33 0.68 9.43E−01 1.16E−03 −6.16E−04 −7.23E−06 −8.01E−05 2.44E−05 Acetonitrile 42 0.72 9.77E−01 6.82E−04 −1.63E−03 −3.01E−06 −3.62E−05 1.80E−05 Acetaldehyde 45 0.70 1.04E+00 −5.07E−04 −3.97E−03 1.24E−06 4.83E−07 3.74E−05 Ethanol 47 0.67 1.16E+00 −3.30E−03 −1.83E−02 −6.65E−06 1.67E−04 2.35E−04 Acrolein 57 0.74 9.94E−01 −4.42E−04 −5.98E−03 −1.47E−06 2.32E−05 8.29E−05 Acetone 59 0.77 1.04E+00 −6.97E−04 −2.27E−03 6.21E−06 −4.00E−05 2.17E−05 Isoprene 69 0.92 1.00E+00 −1.38E−03 −8.82E−03 7.97E−06 1.13E−04 9.88E−05 Crotonaldehyde 71 0.79 8.69E−01 2.03E−03 −2.91E−04 −7.67E−06 −2.55E−05 1.57E−05 2-Butanone 73 0.74 9.77E−01 6.06E−04 −1.20E−03 −2.06E−06 −4.10E−05 1.41E−05 Benzene 79 0.81 1.03E+00 −3.93E−04 5.65E−03 1.17E−05 −1.53E−04 −6.35E−05 Toluene 93 0.84 1.03E+00 1.91E−04 4.66E−03 7.32E−06 −1.67E−04 −5.62E−05
o-Xylene 107 0.86 1.03E+00 1.06E−03 2.15E−03 −1.75E−06 −1.05E−04 −4.56E−05
Figure 4. Simulation of experimental reaction rate coefficient, ambient relative humidity (RH), and temperature (T) for HCHO (m/z31).
Figure 5.Experimentalkvalue of HCHO (m/z31) as a function of absolute humidity in sample air.
was found between the above two correction methods, with a slope of 1.02 and a correlation coefficient of 0.99 (as shown in Fig. 6).
A relationship between the normalized detection sensi-tivity, S (ncps ppbv−1), of HCHO and its humidity depen-dence at a certain E/N condition was stated by Inomata et al. (2008) as follows:
S=m n ·
a [H2O]sample+b
· 1
88.0, (3)
where m is the detection sensitivity of HCHO by direct introduction (ncps ppbv−1), n is the detection sensitivity of HCHO by dynamic dilution (ncps ppbv−1), a and b are fitting parameters obtained from the simulation equa-tion y=a/(x+b) for the signal intensity of HCHO, and
Figure 6.Linear regression of two correction methods for HCHO concentrations during the field study at MK in Hong Kong.
[H2O]sample is the water vapor concentration in sample air (mmol mol−1).
Ion counts are divided by 88.0 because the humidity de-pendence was measured with HCHO of 88.0 ppbv in the dy-namic dilution method in this study. The relationship of the signal intensity of HCHO and the water vapor concentration in sample air is plotted in Fig. 7. Simulated fitting parame-ters,aandb, are 5404±72 (ncps mmol mol−1)and 26±0.4 (mmol mol−1), respectively. The value ofm/nis 1.09 in this study, and it is about 1.2 times that of the (ka/k−a)/avalue. This result agrees with the study of Inomata et al. (2008). Hence, the normalized detection sensitivity of HCHO in this study can be determined as a function of the water vapor con-centration in sample air as Eq. (4).
S= 67.18
AHsample+26.04 (4)
Figure 8 shows the comparison of the measured detection sensitivity of HCHO and the normalized detection sensitiv-ity obtained from Eq. (4). Good agreement was found be-tween the measured detection sensitivity and the normalized detection sensitivity of HCHO with a slope of 1.18±0.01 (r=0.998). Since the normalized detection sensitivity of HCHO was 1.18 times that of the measured detection sen-sitivity, lower HCHO concentration will be obtained by us-ing the normalized detection sensitivity with a percentage of about 15.3 %.
3.2 PTR-MS vs. DNPH-HPLC
Figure 7.The relationship of the signal intensity atm/z31 and the water vapor concentration in sample air.
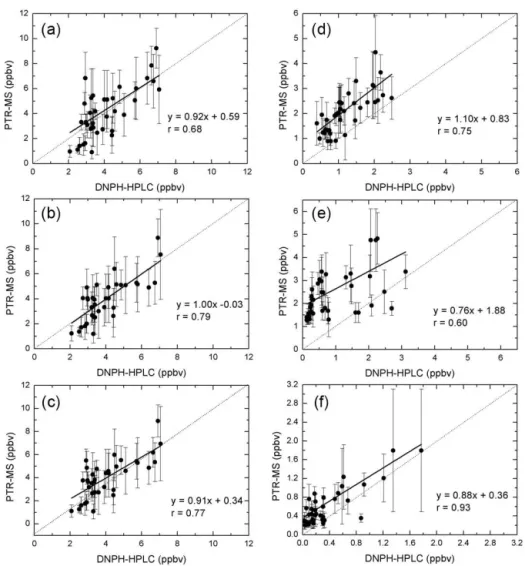
HPLC) with a correlation coefficient of 0.60. Concentrations of HCHO measured by the PTR-MS in Fig. 9b were the cor-rected data by the Poly 2-D regression of RH andT. Since the conditions of inlet air for calibration were set at RH=80 % andT=25◦C, which were close to the average level of am-bient air in Hong Kong from 1997 to 2012 (shown in Fig. 1), uncorrected concentrations of HCHO measured by PTR-MS were only slightly lower than those by DNPH-HPLC with a percentage of 8.0 % (r=0.68). Corrected concentrations of HCHO by absolute humidity in sample air also correlated well with those by DNPH-HPLC (slope=0.91, r=0.77), because of the excellent correlation between these two differ-ent correction methods discussed above. However, correction for HCHO concentrations by Poly 2-D regression of RH and T, which has a better slope than the others, is a better choice. Moreover, it is easy to measure RH andT of ambient air for further correction of HCHO data by PTR-MS in practice.
Wisthaler et al. (2008) reported the intercomparison be-tween PTR-MS and DNPH-HPLC in an atmosphere simu-lation chamber; good agreement was found between PTR-MS and DNPH-HPLC while ambient air was introduced into the chamber, but the concentration of HCHO measured by DNPH-HPLC was less than that by PTR-MS, which could be caused by some interferences for the DNPH-HPLC method or the varying performance of the KI ozone scrubber. Overes-timation of DNPH-HPLC for HCHO in the presence of NO2 was also reported by Herrington and Hays (2012), because NO can be oxidized to NO2in the upstream ozone scrubber, and NO2 will react with DNPH to form 2,4-dinitrophenyl azide (DNPA), which has similar chromatographic proper-ties to the formaldehyde-DNP-hydrazone. Hence, the inter-cept of−0.03 for HCHO intercomparison between PTR-MS and DNPH-HPLC in this study may be explained by the in-terference of NO2because of the high NOxlevels at the road-side sampling site.
Low acetaldehyde collection efficiencies (CEs), ranging from 1 to 62 %, were found by Herrington et al. (2007) for
Figure 8.Linear regression of the measured detection sensitivity of HCHO and its normalized detection sensitivity by water vapor concentration in sample air.
the typical 24 h sampling period, which can lead to the un-derestimation of acetaldehyde by the DNPH-HPLC method. And this artifact is consistent with the result for acetalde-hyde intercomparisons in this study. It was found that ke-tone (aceke-tone and MEK) concentrations determined by the DNPH-HPLC method could be underestimated by 35–80 % under high-RH (> 50 %) conditions when the temperature is about 22◦C (Ho et al., 2014). This DNPH issue could explain the 12 % difference between PTR-MS and DNPH-HPLC for MEK and the relatively bad agreement for acetone in our study.
3.3 PTR-MS vs. online GC-FID
Hourly data were used to conduct intercomparison be-tween PTR-MS and online GC-FID. Because the ion sig-nal at m/z107 reflects C2-benzenes (the sum ofp-xylene,
ethylben-Figure 9.Intercomparison between ambient OVOC measurements by PTR-MS and by DNPH-HPLC during the field study at MK in Hong Kong:(a)formaldehyde without correction,(b)formaldehyde corrected byR(RH,T),(c)formaldehyde corrected byk(AH),(d) acetalde-hyde,(e)acetone, and(f)MEK. Linear regression fits are indicated by the solid black line. Error bar stands for the standard deviation of 24 h averaged PTR-MS data. Dashed line is the 1:1 line for reference.
zene and propylbenzene tom/z79:
[benzene]= [M79] −Sethylbenzene Sbenzene
BFethylbenzene[ethylbenzene]
−Spropylbenzene
Sbenzene BFpropylbenzene[propylbenzene], (5) where [benzene] is the volume mixing ratio of benzene, [M79] is the volume mixing ratio ofm/z79, [ethylbenzene] is the actual volume mixing ratio of ethylbenzene, [propy-lbenzene] is actual volume mixing ratio of propylbenzene, Sx/Sbenzeneis the ratio of the ionization efficiencies, and BF is the fraction ofm/z79 ion product that each produces upon ionization.
Since propylbenzene was not measured in this study, only ethylbenzene was used to correct the concentrations of benzene and C2-benzenes measured by PTR-MS following
Eqs. (6) and (7): propylbenzene tom/z79.
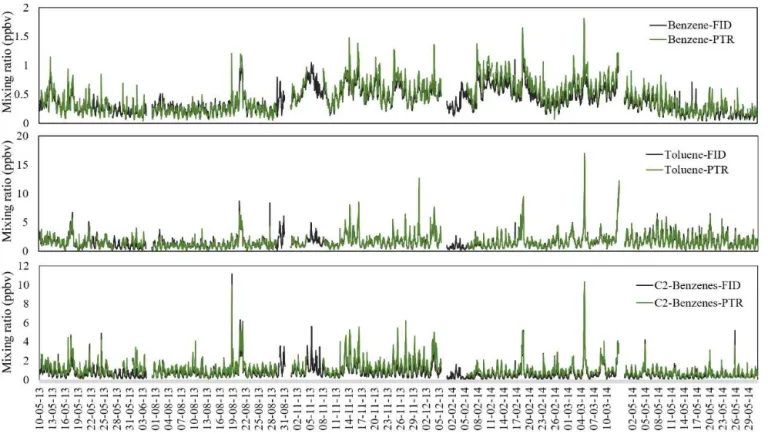
Figure 10.Measurement results for benzene, toluene, and C2-benzenes obtained during the field study at MK in Hong Kong. The black lines show the online GC-FID data, and the green lines show the PTR-MS results.
C2-benzenes is achieved using the corrected concentrations of C2-benzenes by PTR-MS. Since the toluene-to-benzene ratio is one of the key indicators for determining VOC sources and C2-benzenes are related to vehicular emissions and solvent usage, accurate measurements are required in studies on source apportionment of ambient VOCs. The two equations above (Eqs. 6 and 7) could offer a good correction method for the concentrations of benzene and C2-benzenes measured by PTR-MS in an urban roadside area of Hong Kong.
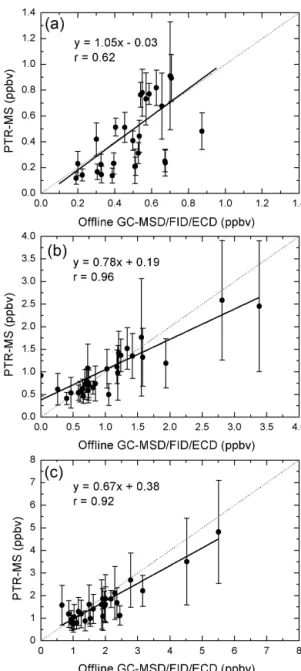
3.4 PTR-MS vs. offline GC-MSD/FID/ECD
The intercomparison between the PTR-MS data averaged over the 24 h canister sampling interval and offline GC-MSD/FID/ECD analysis of the canisters is displayed in Fig. 12. Corrected concentrations of benzene and C2-benzenes by the PTR-MS were used for comparison. Ac-ceptable linear regressions were found for benzene, toluene, and C2-benzenes between the PTR-MS and the offline GC-MSD/FID/ECD with correlation coefficients of 0.62, 0.96 and 0.92, respectively. However, the mixing ratios of toluene and C2-benzenes measured by PTR-MS were lower than those measured by offline canister samples with percentages of 22 and 33 %, respectively. The maximum offsets from the 1:1 line were usually found at high concentrations, which could be mainly caused by the different sampling time
reso-lution for each sample of the PTR-MS and canister samples. The canister samples were 24 h samples with constant flow, while PTR-MS detected a total group of 17 different species with a 30 s cycle. From previous studies on comparison be-tween the PTR-MS and the GC-MSD/FID/ECD, the slope for toluene ranged 0.52–1.18, and the slope for C2-benzenes ranged 0.58–3.20 (Kato et al., 2004; Christian et al., 2004; de Gouw et al., 2003; Warneke et al., 2001), so PTR-MS and of-fline GC-MSD/FID/ECD analysis were comparable for aro-matic hydrocarbon measurements in this study.
3.5 Comparison with other studies
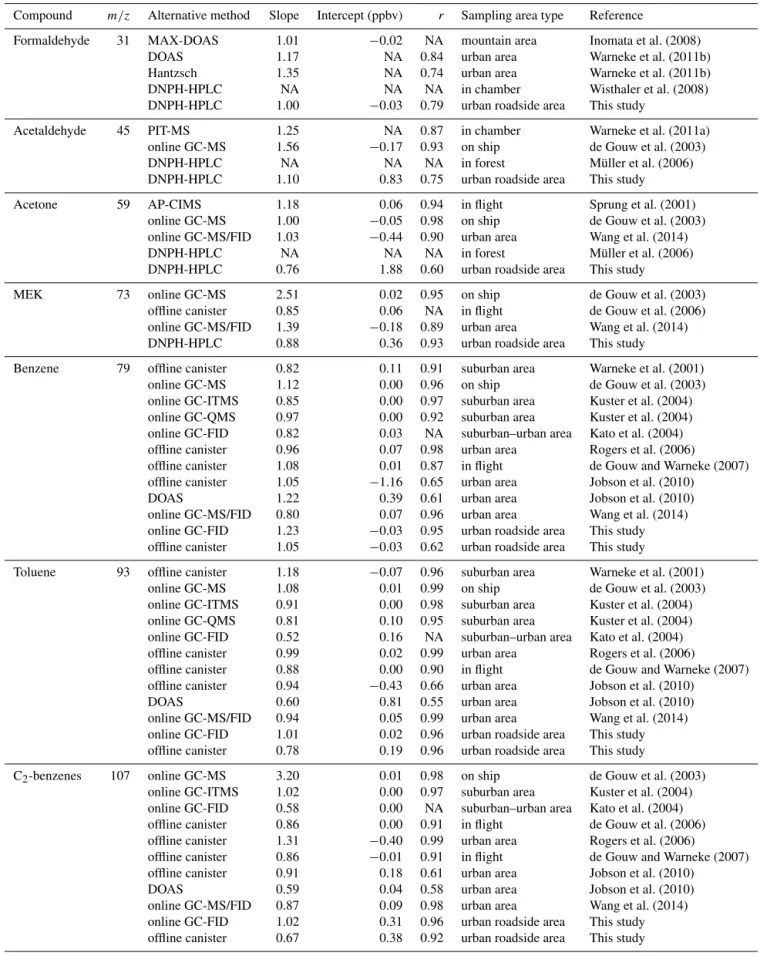
Intercomparisons between PTR-MS and other alternative technologies are summarized in Table 4. Most studies were conducted in urban areas, suburban areas, coastal areas, forested areas, or the free troposphere. Overall, most of the slopes of PTR-MS to alternative methods agreed to within less than the PTR-MS measurement accuracy of 20 %.
moun-Table 4.Intercomparisons between PTR-MS and alternative methods in this study and the comparison with previous other studies.
Compound m/z Alternative method Slope Intercept (ppbv) r Sampling area type Reference
Formaldehyde 31 MAX-DOAS 1.01 −0.02 NA mountain area Inomata et al. (2008)
DOAS 1.17 NA 0.84 urban area Warneke et al. (2011b)
Hantzsch 1.35 NA 0.74 urban area Warneke et al. (2011b)
DNPH-HPLC NA NA NA in chamber Wisthaler et al. (2008)
DNPH-HPLC 1.00 −0.03 0.79 urban roadside area This study
Acetaldehyde 45 PIT-MS 1.25 NA 0.87 in chamber Warneke et al. (2011a)
online GC-MS 1.56 −0.17 0.93 on ship de Gouw et al. (2003)
DNPH-HPLC NA NA NA in forest Müller et al. (2006)
DNPH-HPLC 1.10 0.83 0.75 urban roadside area This study
Acetone 59 AP-CIMS 1.18 0.06 0.94 in flight Sprung et al. (2001)
online GC-MS 1.00 −0.05 0.98 on ship de Gouw et al. (2003)
online GC-MS/FID 1.03 −0.44 0.90 urban area Wang et al. (2014)
DNPH-HPLC NA NA NA in forest Müller et al. (2006)
DNPH-HPLC 0.76 1.88 0.60 urban roadside area This study
MEK 73 online GC-MS 2.51 0.02 0.95 on ship de Gouw et al. (2003)
offline canister 0.85 0.06 NA in flight de Gouw et al. (2006)
online GC-MS/FID 1.39 −0.18 0.89 urban area Wang et al. (2014)
DNPH-HPLC 0.88 0.36 0.93 urban roadside area This study
Benzene 79 offline canister 0.82 0.11 0.91 suburban area Warneke et al. (2001)
online GC-MS 1.12 0.00 0.96 on ship de Gouw et al. (2003)
online GC-ITMS 0.85 0.00 0.97 suburban area Kuster et al. (2004)
online GC-QMS 0.97 0.00 0.92 suburban area Kuster et al. (2004)
online GC-FID 0.82 0.03 NA suburban–urban area Kato et al. (2004)
offline canister 0.96 0.07 0.98 urban area Rogers et al. (2006)
offline canister 1.08 0.01 0.87 in flight de Gouw and Warneke (2007)
offline canister 1.05 −1.16 0.65 urban area Jobson et al. (2010)
DOAS 1.22 0.39 0.61 urban area Jobson et al. (2010)
online GC-MS/FID 0.80 0.07 0.96 urban area Wang et al. (2014)
online GC-FID 1.23 −0.03 0.95 urban roadside area This study
offline canister 1.05 −0.03 0.62 urban roadside area This study
Toluene 93 offline canister 1.18 −0.07 0.96 suburban area Warneke et al. (2001)
online GC-MS 1.08 0.01 0.99 on ship de Gouw et al. (2003)
online GC-ITMS 0.91 0.00 0.98 suburban area Kuster et al. (2004)
online GC-QMS 0.81 0.10 0.95 suburban area Kuster et al. (2004)
online GC-FID 0.52 0.16 NA suburban–urban area Kato et al. (2004)
offline canister 0.99 0.02 0.99 urban area Rogers et al. (2006)
offline canister 0.88 0.00 0.90 in flight de Gouw and Warneke (2007)
offline canister 0.94 −0.43 0.66 urban area Jobson et al. (2010)
DOAS 0.60 0.81 0.55 urban area Jobson et al. (2010)
online GC-MS/FID 0.94 0.05 0.99 urban area Wang et al. (2014)
online GC-FID 1.01 0.02 0.96 urban roadside area This study
offline canister 0.78 0.19 0.96 urban roadside area This study
C2-benzenes 107 online GC-MS 3.20 0.01 0.98 on ship de Gouw et al. (2003)
online GC-ITMS 1.02 0.00 0.97 suburban area Kuster et al. (2004)
online GC-FID 0.58 0.00 NA suburban–urban area Kato et al. (2004)
offline canister 0.86 0.00 0.91 in flight de Gouw et al. (2006)
offline canister 1.31 −0.40 0.99 urban area Rogers et al. (2006)
offline canister 0.86 −0.01 0.91 in flight de Gouw and Warneke (2007)
offline canister 0.91 0.18 0.61 urban area Jobson et al. (2010)
DOAS 0.59 0.04 0.58 urban area Jobson et al. (2010)
online GC-MS/FID 0.87 0.09 0.98 urban area Wang et al. (2014)
online GC-FID 1.02 0.31 0.96 urban roadside area This study
offline canister 0.67 0.38 0.92 urban roadside area This study
Figure 11.Intercomparison between ambient aromatic hydrocarbon measurements by PTR-MS and by online GC-FID during the field study at MK in Hong Kong:(a)benzene,(b)toluene, and(c)C2 -benzenes. Original data are plotted in black dots; grey dots represent the corrected data based on Eqs. (6) and (7). Linear regression fits for original and corrected data are indicated by the solid black line and the solid grey line, respectively. Dashed line is the 1:1 line for reference.
tain areas (slope=1.01) (Inomata et al., 2008) and ur-ban areas (slope=1.17) (Warneke et al., 2011b). HCHO measurement by DNPH-HPLC was compared to PTR-MS in an atmosphere simulation chamber by Wisthaler et al. (2008), and significant lower HCHO levels by DNPH-HPLC were observed in dry synthetic air because of hydrazine-to-hydrazone conversion. Proton-transfer-reaction mass-spectrometry (PIT-MS), atmospheric pressure chem-ical ionization mass spectrometry (AP-CIMS), and
GC-Figure 12.Intercomparison between ambient aromatic hydrocarbon measurements by PTR-MS (corrected based on Eqs. 6 and 7) and by offline canister measurements using GC-MSD/FID/ECD during the field study at MK in Hong Kong:(a)benzene,(b)toluene, and (c)C2-benzenes. Linear regression fits are indicated by the solid black line. Error bar stands for the standard deviation of 24 h aver-aged PTR-MS data. Dashed line is the 1:1 line for reference.
from 1.00 to 1.18. In this study, however, the slope is 0.76 (PTR-MS to HPLC) with an offset of 1.88, which could have resulted from other interferences on m/z59. The slopes of MEK varied in a large ranges (0.85–2.51) in previous studies, but a reasonable correlation between PTR-MS and DNPH-HPLC for MEK (slope=0.88,r=0.93) was found in this study.
Intercomparisons between PTR-MS and alternative meth-ods (both online and offline methmeth-ods) for benzene, toluene, and C2-benzenes have been conducted by previous studies in various areas. For benzene, PTR-MS was always reason-ably comparable to other online or offline techniques, with slopes ranging from 0.82 to 1.22. In this study, PTR-MS correlated well with offline canister measurements for ben-zene (slope=1.05), but a higher slope of 1.23 was found be-tween PTR-MS and online GC-FID, which could be due to interferences (e.g., propylbenzene) atm/z79. Lower toluene levels measured by PTR-MS as compared to offline canister measurements were found in this study, with a slope of 0.78 (r=0.96). Lower toluene levels measured by PTR-MS were also reported for PTR-MS vs. DOAS (Jobson et al., 2010) and PTR-MS vs. online GC-FID (Kato et al., 2004) in an ur-ban area. Similarly, lower C2-benzenes levels measured by PTR-MS than by offline canister measurements were found with a slope of 0.67 (r=0.92) in this study, which could have resulted from the much longer sampling resolution of offline canister sample. The slopes of C2-benzenes varied from 0.59 to 3.20 in previous studies with different area types.
4 Conclusions
The effect of ambient RH and T on HCHO measure-ments by PTR-MS was further investigated in this study. Due to the backward reaction of protonated HCHO with H2O, the sensitivity of HCHO decreased significantly when ambient RH and/or T varied. Meanwhile, the calibrated reaction rate coefficient of HCHO and H3O+ also de-creased significantly. The combined effect of RH and T on the HCHO measurement by PTR-MS was explored in this study. A Poly 2-D regression was found to be the best nonlinear surface simulation of R(RH,T ), ambient RH and T for HCHO, following the equation R(RH,T )=1.63– 3.81×10⁻³·RH+1.92×10⁻²×T+5.10×10⁻⁵ qRH2− 6.41×10⁻⁴·T2−3.76×10⁻⁴·RH·T. Through a field sam-pling study at an urban roadside area at MK AQMS, cor-rection of HCHO concentrations by both ambient RH andT and by absolute humidity in sample air agreed well with each other (slope=1.02,r=0.99).
A field study of OVOCs and VOCs using the PTR-MS was conducted at MK in Hong Kong from May 2013 to August 2014. Good agreement was found between PTR-MS and DNPH-HPLC for formaldehyde (slope=1.00, r=0.79), acetaldehyde (slope=1.10, r=0.75) and MEK (slope=0.88, r=0.93). For acetone, the relatively bad
agreement (slope=0.76, r=0.60) should be the result of the DNPH issue, since there is huge underestimation (35– 80 %) for ketones measured by the DNPH-HPLC method when RH > 50 %. Moreover, correction for HCHO concen-trations by Poly 2-D regression of ambient RH andT was found to be better than directly correcting by absolute humid-ity in the sample air. Aromatic hydrocarbons measurements by PTR-MS were intercompared with online GC-FID and of-fline canister measurements using GC-MSD/FID/ECD. After correcting benzene and C2-benzenes levels that were mea-sured by the PTR-MS, which could be affected by frag-ments from ethylbenzene and propylbenzene atm/z79, good agreements were found between PTR-MS and online GC-FID for toluene (slope=1.01, r=0.96) and C2-benzenes (slope=1.02,r=0.96), but a higher benzene level was still detected by the PTR-MS when compared with that by on-line GC-FID (slope=1.23,r=0.95). For the intercompar-isons between PTR-MS and off-canister measurements us-ing GC-MSD/FID/ECD, benzene showed good agreement, with a slope of 1.05 (r=0.62); underestimated toluene and C2-benzenes levels by PTR-MS were obtained with slopes of 0.78 (r=0.96) and 0.67 (r=0.92), respectively. In sum-mary, the PTR-MS instrument can be used in urban roadside areas for OVOC and VOC measurements. But further inter-comparisons between PTR-MS and other offline analytical techniques need to be conducted with the higher sampling time resolutions of offline analytical techniques.
5 Data availability
The data shown in this study can be available on request to authors. Please refer to the author list for contact details.
Acknowledgements. This study was supported by the Environmen-tal Protection Department of the Hong Kong Special Administrative Region for a 2-year PTR-MS study (project number: 12-01661), Research Grants Council of the Hong Kong Government (PolyU 152083/14E and PolyU 152090/15E), and the Hong Kong RGC Collaborative Research Fund (C5022-14G).
The opinions expressed in this paper are those of the author and do not necessarily reflect the views or policies of the Government of the Hong Kong Special Administrative Region, nor does mention of trade names or commercial products constitute an endorsement or recommendation of their use.
Edited by: E. C. Apel
Reviewed by: J. D. Beauchamp and two anonymous referees
References
loading, Atmos. Meas. Tech., 3, 959–980, doi:10.5194/amt-3-959-2010, 2010.
Atkinson, R. and Arey, J.: Atmospheric Degradation of Volatile Organic Compounds, Chem. Rev., 103, 4605–4638, doi:10.1021/cr0206420, 2003.
Beauchamp, J., Herbig, J., Dunkl, J., Singer, W., and Hansel, A.: On the performance of proton-transfer-reaction mass spectrom-etry for breath-relevant gas matrices, Meas. Sci. Technol., 24, 125003, doi:10.1088/0957-0233/24/12/125003, 2013.
Blake, D. R., Smith, T. W., Chen, T. Y., Whipple, W. J., and Rowland, F. S.: Effects of biomass burning on sum-mertime nonmethane hydrocarbon concentrations in the Cana-dian wetlands, J. Geophys. Res.-Atmos., 99, 1699–1719, doi:10.1029/93JD02598, 1994.
Chan, C. Y., Chan, L. Y., Wang, X. M., Liu, Y. M., Lee, S. C., Zou, S. C., Sheng, G. Y., and Fu, J. M.: Volatile organic com-pounds in roadside microenvironments of metropolitan Hong Kong, Atmos. Environ., 36, 2039–2047, doi:10.1016/S1352-2310(02)00097-3, 2002.
Cheng, Y., Lee, S. C., Huang, Y., Ho, K. F., Ho, S. S. H., Yau, P. S., Louie, P. K. K., and Zhang, R. J.: Diurnal and seasonal trends of carbonyl compounds in roadside, urban, and subur-ban environment of Hong Kong, Atmos. Environ., 89, 43–51, doi:10.1016/j.atmosenv.2014.02.014, 2014.
Christian, T. J., Kleiss, B., Yokelson, R. J., Holzinger, R., Crutzen, P. J., Hao, W. M., Shirai, T., and Blake, D. R.: Compre-hensive laboratory measurements of biomass-burning emis-sions: 2. First intercomparison of open-path FTIR, PTR-MS, and GC-MS/FID/ECD, J. Geophys. Res.-Atmos., 109, D02311, doi:10.1029/2003JD003874, 2004.
Colman, J. J., Swanson, A. L., Meinardi, S., Sive, B. C., Blake, D. R., and Rowland, F. S.: Description of the Analysis of a Wide Range of Volatile Organic Compounds in Whole Air Samples Collected during PEM-Tropics A and B, Anal. Chem., 73, 3723– 3731, doi:10.1021/ac010027g, 2001.
de Gouw, J. and Warneke, C.: Measurements of volatile organic compounds in the earth’s atmosphere using proton-transfer-reaction mass spectrometry, Mass Spectrom. Rev., 26, 223–257, doi:10.1002/mas.20119, 2007.
de Gouw, J. A., Goldan, P. D., Warneke, C., Kuster, W. C., Roberts, J. M., Marchewka, M., Bertman, S. B., Pszenny, A. A. P., and Keene, W. C.: Validation of proton transfer reaction-mass spec-trometry (PTR-MS) measurements of gas-phase organic com-pounds in the atmosphere during the New England Air Quality Study (NEAQS) in 2002, J. Geophys. Res.-Atmos., 108, 4682, doi:10.1029/2003JD003863, 2003.
de Gouw, J. A., Warneke, C., Stohl, A., Wollny, A. G., Brock, C. A., Cooper, O. R., Holloway, J. S., Trainer, M., Fehsenfeld, F. C., Atlas, E. L., Donnelly, S. G., Stroud, V., and Lueb, A.: Volatile organic compounds composition of merged and aged forest fire plumes from Alaska and western Canada, J. Geophys. Res.-Atmos., 111, D10303, doi:10.1029/2005JD006175, 2006. Eerdekens, G., Ganzeveld, L., Vilà-Guerau de Arellano, J., Klüpfel,
T., Sinha, V., Yassaa, N., Williams, J., Harder, H., Kubistin, D., Martinez, M., and Lelieveld, J.: Flux estimates of isoprene, methanol and acetone from airborne PTR-MS measurements over the tropical rainforest during the GABRIEL 2005 campaign, Atmos. Chem. Phys., 9, 4207–4227, doi:10.5194/acp-9-4207-2009, 2009.
Graus, M., Müller, M., and Hansel, A.: High Resolution PTR-TOF: Quantification and Formula Confirmation of VOC in Real Time, J. Am. Soc. Mass Spectr., 21, 1037–1044, doi:10.1016/j.jasms.2010.02.006, 2010.
Guo, H., Lee, S. C., Louie, P. K. K., and Ho, K. F.: Char-acterization of hydrocarbons, halocarbons and carbonyls in the atmosphere of Hong Kong, Chemosphere, 57, 1363–1372, doi:10.1016/j.chemosphere.2004.07.055, 2004.
Guo, H., So, K. L., Simpson, I. J., Barletta, B., Meinardi, S., and Blake, D. R.: C1–C8 volatile organic compounds in the atmosphere of Hong Kong: Overview of atmospheric process-ing and source apportionment, Atmos. Environ., 41, 1456–1472, doi:10.1016/j.atmosenv.2006.10.011, 2007.
Hansel, A., Singer, W., Wisthaler, A., Schwarzmann, M., and Lindinger, W.: Energy dependencies of the proton transfer reactions H3O++CH2O
<
CH2OH++H2O, Int. J. Mass Spectrom., 167, 697–703, doi:10.1016/S0168-1176(97)00128-6, 1997.Herrington, J. S. and Hays, M. D.: Concerns regarding 24-h sam-pling for formaldehyde, acetaldehyde, and acrolein using 2,4-dinitrophenylhydrazine (DNPH)-coated solid sorbents, Atmos. Environ., 55, 179–184, doi:10.1016/j.atmosenv.2012.02.088, 2012.
Herrington, J. S., Fan, Z.-H., Lioy, P. J., and Zhang, J.: Low Ac-etaldehyde Collection Efficiencies for 24-Hour Sampling with 2,4-Dinitrophenylhydrazine (DNPH)-Coated Solid Sorbents, En-viron. Sci. Technol., 41, 580–585, doi:10.1021/es061247k, 2007. Ho, K. E., Lee, S. C., Guo, H., and Tsai, W.: Seasonal and di-urnal variations of volatile organic compounds (VOCs) in the atmosphere of Hong Kong, Sci. Total Environ., 322, 155–166, doi:10.1016/j.scitotenv.2003.10.004, 2004.
Ho, K. F., Lee, S. C., Louie, P. K. K., and Zou, S. C.: Seasonal varia-tion of carbonyl compound concentravaria-tions in urban area of Hong Kong, Atmos. Environ., 36, 1259–1265, doi:10.1016/S1352-2310(01)00570-2, 2002.
Ho, K. F., Ho, S. S. H., Lee, S. C., Louie, P. K. K., Cao, J. J., and Deng, W. J.: Volatile Organic Compounds in Roadside Environ-ment of Hong Kong, Aerosol Air Qual. Res., 13, 1331–1347, doi:10.4209/aaqr.2012.10.0278, 2013.
Ho, S. S. H., Chow, J. C., Watson, J. G., Ip, H. S. S., Ho, K. F., Dai, W. T., and Cao, J.: Biases in ketone measurements using DNPH-coated solid sorbent cartridges, Analytical Methods, 6, 967–974, doi:10.1039/C3AY41636D, 2014.
Huang, Y., Ho, S. S. H., Ho, K. F., Lee, S. C., Yu, J. Z., and Louie, P. K. K.: Characteristics and health impacts of VOCs and carbonyls associated with residential cooking ac-tivities in Hong Kong, J. Hazard. Mater., 186, 344–351, doi:10.1016/j.jhazmat.2010.11.003, 2011.
Inomata, S., Tanimoto, H., Kameyama, S., Tsunogai, U., Irie, H., Kanaya, Y., and Wang, Z.: Technical Note: Determination of formaldehyde mixing ratios in air with PTR-MS: laboratory ex-periments and field measurements, Atmos. Chem. Phys., 8, 273– 284, doi:10.5194/acp-8-273-2008, 2008.
Jobson, B. T. and McCoskey, J. K.: Sample drying to im-prove HCHO measurements by PTR-MS instruments: laboratory and field measurements, Atmos. Chem. Phys., 10, 1821–1835, doi:10.5194/acp-10-1821-2010, 2010.
Molina, L. T.: Comparison of aromatic hydrocarbon measure-ments made by PTR-MS, DOAS and GC-FID during the MCMA 2003 Field Experiment, Atmos. Chem. Phys., 10, 1989–2005, doi:10.5194/acp-10-1989-2010, 2010.
Kato, S., Miyakawa, Y., Kaneko, T., and Kajii, Y.: Urban air mea-surements using PTR-MS in Tokyo area and comparison with GC-FID measurements, Int. J. Mass Spectrom., 235, 103–110, doi:10.1016/j.ijms.2004.03.013, 2004.
Kerns, W. D., Pavkov, K. L., Donofrio, D. J., Gralla, E. J., and Swenberg, J. A.: Carcinogenicity of Formaldehyde in Rats and Mice after Long-Term Inhalation Exposure, Cancer Res., 43, 4382–4392, 1983.
Kuster, W. C., Jobson, B. T., Karl, T., Riemer, D., Apel, E., Goldan, P. D., and Fehsenfeld, F. C.: Intercomparison of Volatile Organic Carbon Measurement Techniques and Data at La Porte during the TexAQS2000 Air Quality Study, Environ. Sci. Technol., 38, 221–228, doi:10.1021/es034710r, 2004.
Lau, A. K. H., Yuan, Z., Yu, J. Z., and Louie, P. K. K.: Source apportionment of ambient volatile organic com-pounds in Hong Kong, Sci. Total Environ., 408, 4138–4149, doi:10.1016/j.scitotenv.2010.05.025, 2010.
Lee, S. C., Chiu, M. Y., Ho, K. F., Zou, S. C., and Wang, X.: Volatile organic compounds (VOCs) in urban atmosphere of Hong Kong, Chemosphere, 48, 375–382, 2002.
Lelieveld, J., Evans, J. S., Fnais, M., Giannadaki, D., and Pozzer, A.: The contribution of outdoor air pollution sources to pre-mature mortality on a global scale, Nature, 525, 367–371, doi:10.1038/nature15371, 2015.
Lindinger, W., Hansel, A., and Jordan, A.: On-line monitoring of volatile organic compounds at pptv levels by means of proton-transfer-reaction mass spectrometry (PTR-MS) medical appli-cations, food control and environmental research, Int. J. Mass Spectrom., 173, 191–241, doi:10.1016/S0168-1176(97)00281-4, 1998.
Ling, Z. H., Guo, H., Zheng, J. Y., Louie, P. K. K., Cheng, H. R., Jiang, F., Cheung, K., Wong, L. C., and Feng, X. Q.: Es-tablishing a conceptual model for photochemical ozone pollu-tion in subtropical Hong Kong, Atmos. Environ., 76, 208–220, doi:10.1016/j.atmosenv.2012.09.051, 2013.
Ling, Z. H. and Guo, H.: Contribution of VOC sources to photochemical ozone formation and its control policy im-plication in Hong Kong, Environ. Sci. Policy, 38, 180–191, doi:10.1016/j.envsci.2013.12.004, 2014.
Louie, P. K. K., Ho, J. W. K., Tsang, R. C. W., Blake, D. R., Lau, A. K. H., Yu, J. Z., Yuan, Z., Wang, X., Shao, M., and Zhong, L.: VOCs and OVOCs distribution and control policy implications in Pearl River Delta region, China, Atmos. Environ., 76, 125–135, doi:10.1016/j.atmosenv.2012.08.058, 2013.
Lyu, X., Guo, H., Simpson, I. J., Meinardi, S., Louie, P. K. K., Ling, Z., Wang, Y., Liu, M., Luk, C. W. Y., Wang, N., and Blake, D. R.: Effectiveness of replacing catalytic converters in LPG-fueled vehicles in Hong Kong, Atmos. Chem. Phys., 16, 6609–6626, doi:10.5194/acp-16-6609-2016, 2016.
Müller, K., Haferkorn, S., Grabmer, W., Wisthaler, A., Hansel, A., Kreuzwieser, J., Cojocariu, C., Rennenberg, H., and Herrmann, H.: Biogenic carbonyl compounds within and above a coniferous forest in Germany, Atmos. Environ., 40, Supplement 1, 81–91, doi:10.1016/j.atmosenv.2005.10.070, 2006.
Ou, J., Guo, H., Zheng, J., Cheung, K., Louie, P. K. K., Ling, Z., and Wang, D.: Concentrations and sources of non-methane hydrocarbons (NMHCs) from 2005 to 2013 in Hong Kong: A multi-year real-time data analysis, Atmos. Environ., 103, 196– 206, doi:10.1016/j.atmosenv.2014.12.048, 2015.
Rogers, T. M., Grimsrud, E. P., Herndon, S. C., Jayne, J. T., Kolb, C. E., Allwine, E., Westberg, H., Lamb, B. K., Zavala, M., Molina, L. T., Molina, M. J., and Knighton, W. B.: On-road measurements of volatile organic compounds in the Mexico City metropolitan area using proton transfer reac-tion mass spectrometry, Int. J. Mass Spectrom., 252, 26–37, doi:10.1016/j.ijms.2006.01.027, 2006.
Sillman, S.: Chapter 12 The relation between ozone, NOx and hy-drocarbons in urban and polluted rural environments, in: Devel-opments in Environmental Science, edited by: Jill Austin, P. B. and William, S., Elsevier, 339–385, 2002.
Simpson, I. J., Blake, N. J., Barletta, B., Diskin, G. S., Fuelberg, H. E., Gorham, K., Huey, L. G., Meinardi, S., Rowland, F. S., Vay, S. A., Weinheimer, A. J., Yang, M., and Blake, D. R.: Characteriza-tion of trace gases measured over Alberta oil sands mining opera-tions: 76 speciated C2–C10volatile organic compounds (VOCs), CO2, CH4, CO, NO, NO2, NOy, O3and SO2, Atmos. Chem. Phys., 10, 11931–11954, doi:10.5194/acp-10-11931-2010, 2010. Spanel, P. and Smith, D.: Quantification of trace levels of the potential cancer biomarkers formaldehyde, acetaldehyde and propanol in breath by SIFT-MS, J. Breath Res., 2, 046003, doi:10.1088/1752-7155/2/4/046003, 2008.
Sprung, D., Jost, C., Reiner, T., Hansel, A., and Wisthaler, A.: Acetone and acetonitrile in the tropical Indian Ocean bound-ary layer and free troposphere: Aircraft-based intercomparison of AP-CIMS and PTR-MS measurements, J. Geophys. Res.-Atmos., 106, 28511–28527, doi:10.1029/2000JD900599, 2001. USEPA: EPA Method TO-11A: Determination of Formaldehyde in
Ambient Air Using Adsorbent Cartridge Followed by High Per-formance Liquid Chromatography (HPLC), US Environmental Protection Agency, 1999.
Vlasenko, A., Macdonald, A. M., Sjostedt, S. J., and Abbatt, J. P. D.: Formaldehyde measurements by Proton transfer reaction – Mass Spectrometry (PTR-MS): correction for humidity effects, At-mos. Meas. Tech., 3, 1055–1062, doi:10.5194/amt-3-1055-2010, 2010.
von Schneidemesser, E., Monks, P. S., and Plass-Duelmer, C.: Global comparison of VOC and CO observa-tions in urban areas, Atmos. Environ., 44, 5053–5064, doi:10.1016/j.atmosenv.2010.09.010, 2010.
Wang, B., Liu, Y., Shao, M., Lu, S., Wang, M., Yuan, B., Gong, Z., He, L., Zeng, L., Hu, M., and Zhang, Y.: The contributions of biomass burning to primary and secondary organics: A case study in Pearl River Delta (PRD), China, Sci. Total Environ., 569–570, 548–556, doi:10.1016/j.scitotenv.2016.06.153, 2016. Wang, M., Zeng, L., Lu, S., Shao, M., Liu, X., Yu, X., Chen,
W., Yuan, B., Zhang, Q., Hu, M., and Zhang, Z.: Develop-ment and validation of a cryogen-free automatic gas chro-matograph system (GC-MS/FID) for online measurements of volatile organic compounds, Analytical Methods, 6, 9424–9434, doi:10.1039/C4AY01855A, 2014.
humidity dependence, and field intercomparison, Int. J. Mass Spectrom., 207, 167–182, doi:10.1016/S1387-3806(01)00366-9, 2001.
Warneke, C., Roberts, J. M., Veres, P., Gilman, J., Kuster, W. C., Burling, I., Yokelson, R., and de Gouw, J. A.: VOC identifica-tion and inter-comparison from laboratory biomass burning us-ing PTR-MS and PIT-MS, Int. J. Mass Spectrom., 303, 6–14, doi:10.1016/j.ijms.2010.12.002, 2011a.
Warneke, C., Veres, P., Holloway, J. S., Stutz, J., Tsai, C., Alvarez, S., Rappenglueck, B., Fehsenfeld, F. C., Graus, M., Gilman, J. B., and de Gouw, J. A.: Airborne formaldehyde measure-ments using PTR-MS: calibration, humidity dependence, inter-comparison and initial results, Atmos. Meas. Tech., 4, 2345– 2358, doi:10.5194/amt-4-2345-2011, 2011b.
Watson, J. G., Chow, J. C., and Fujita, E. M.: Review of volatile organic compound source apportionment by chemical mass balance, Atmos. Environ., 35, 1567–1584, doi:10.1016/S1352-2310(00)00461-1, 2001.
Wisthaler, A., Apel, E. C., Bossmeyer, J., Hansel, A., Junkermann, W., Koppmann, R., Meier, R., Müller, K., Solomon, S. J., Stein-brecher, R., Tillmann, R., and Brauers, T.: Technical Note: In-tercomparison of formaldehyde measurements at the atmosphere simulation chamber SAPHIR, Atmos. Chem. Phys., 8, 2189– 2200, doi:10.5194/acp-8-2189-2008, 2008.