Ultrasonic Signal Processing Hybrid Technique for
Analysis of Alcoholic Fermentation Process
Juli´an A. Villamar´ın and Maria Stela Veludo de Paiva,
Abstract—An analysis of the alcoholic fermentation biopro-cess by quantitative ultrasound signal probiopro-cessing is shown in this study. The main objectives were to detect, characterize and classify the dispersed and continuous phases of a liquid mixture during its fermentation process. The liquid mixture is a liquid-solid system composed by sugarcane juice and yeast species saccharomyces cerevisiae. This sample study was monitored by ultrasound exposure in pulse-echo mode during the fermentation bioprocess and then ultrasound backscattering echoes were recorded in RoI. The computational procedures implemented for ultrasonic characterization were based in the extraction of spectral attributes (central frequency, spectral bandwidth, etc.), ultrasonic parameters (such as attenuation and the integrated backscattering coefficient), stationarity anal-ysis by non-parametric statistical Run Test, backscattering waveform analysis by Curve Fitting on bandwidth spectrum and data classification by k-means algorithm. The main results showed a parametric discrimination of regions inside liquid system with and without solid particles during the fermentation evolution. Further, it was identified the stationary state in the death phase of the fermentation bioprocess, which corresponds to particles dilution and substrates depletion.
Index Terms—Alcoholic Fermentation, Backscattering, Sac-charomyces Cerevisiae, Spectral Analysis, Ultrasonic Parame-ter.
I. INTRODUCTION
T
HE ultrasound signal processing techniques for quanti-tative materials characterization have become a funda-mental tool for both industrial and clinical applications [1]. Several studies have contributed with ultrasound parametric techniques in materials characterization providing recently a powerful tool for nondestructive analysis with high per-formance and low cost [2]. In the industrial setting, the monitoring of complex dynamic phenomena by ultrasound such as ethanol production processes receives great attention aiming to improve the performance of fermentation process through control measurements of alcoholic concentration, pH value and so on [3]. The importance of obtaining better performance in ethanol production from relationship between sugars consumed and alcohol produced has led to the modernization of the fermentation bioprocess such as implementation of ultrasonic system monitoring [4], [5], [6]. Currently, several studies [3], [4], [7], [5] have reported the use of conventional acoustic parameters such as propagation velocity and acoustic impedance from carbohydrate aqueous solutions to assess alcoholic concentration and density of liquid mixtures contained inside fermentation systems. These parametric measures are quantitative indices that allow toManuscript submitted on March 17, 2012; revised April 12, 2012. The authors gratefully acknowledge the Brazilian Federal Agency of Support and Evaluation of Postgraduate Education (CAPES) for providing a scholarship. J. Villamar´ın is with the Department of Electrical Engineering, School of Engineering of S˜ao Carlos-University of S˜ao Paulo, S˜ao Paulo, Brazil, e-mail: [email protected].
describe changes in the liquid medium during the conduction of fermentation bioprocess in which, sugars in aqueous solution are decomposed into alcohol and carbon dioxide by the action of yeast cells. Recently, most research has been fo-cused on the characterization of fermentation liquid mixtures in bioreactors from alcohol concentration measurements, cal-culating conventionally the propagation velocity by the time of flight of ultrasonic waves [8], [5]. In this sense, few studies have been addressed to characterize liquid mixtures being fermented from time evolution analysis of its continuous and dispersed phases during the gradual fermentation stages. Therefore, this study shows a quantitative characterization in the interest region (RoI) of the fermentation fluid where are identified and differentiated acoustic reflections associated to groups of solid particles (called dispersed phase) and acoustic reflections from the liquid solution of fermentation fluid (called continuous phase). Classification procedures between the continuous and dispersed phases were made from acoustic parameter calculations on ultrasound vectors collected experimentally during the fermentation process. The results of the experimental measurements of pH, density and percentage of solid mass were correlated with values obtained of acoustic parameters and detection rate of solid particles (calculated from ultrasonic backscattering signals by the classification algorithm K-means). Thereby, these estimates allowed describe the local behavior of the main stages of the fermentation process, such as cellular adaptation (lag phase), tumultuous phase (given by rapid growth of yeast cells) and stationary phase given by fermentation slowdown and depletion of carbohydrates.
II. STATE OF THE ART
by analysis of variations on spectral content, which is due to absorption effects from interest medium [11]. However, attenuation does not contribute significantly for assessment of chemical composition such as alcoholic concentration, where the propagation velocity is better [10]. The previous fact is because the attenuation coefficient measurements in liquid mixtures may show nonlinear and disproportionate behaviors compared with linear increases of substances concentrations in solvents. Several parameters such as particle size distri-bution and backscattering coefficient can be used to enhance ultrasonic analysis about the fermentation process and also to provide new control strategies of monitoring alcoholic fermentation [4], [11], [10]. Finally, unlike recent studies [8], [9], [4] that have been focused in the monitoring of substrates and alcohol concentrations in fermentation process through classical acoustic parameters, this work aims to assess non-invasively the state of the liquid mixture contained within the fermentation system during the time evolution of the fermentation process. This is realized by a hybrid technique of ultrasound signal processing, which allows a quantitative characterization of the time evolution from the dispersed and continuous phase of the fermentation liquid.
III. THEORETICALFUNDAMENTS A. Fermentation
The alcoholic fermentation is a biochemical process that does not require oxygen to convert carbohydrates in metabolic waste such as ethanol and carbon dioxide [4]. Often, this process is made by yeast cells saccharomyces cerevisiae which are microorganisms that obtain energy necessary to survive from breakdown of glucose molecules. Under specific conditions, high yields of fermentation pro-cess depend on the balance between the amount of ferment and sugars in the broth and also of diverse control parameters such as temperature, fermentation time, sugar depletion, resistance-tolerance and stability of yeast in alcohol and minimization of microbial contamination.
During fermentation, the main phases are called: celular adaptation, tumultuous phase or main fermentation and post fermentation. The first phase describes features such as the yeast multiplication and the start of the alcohol production which is evidenced by the emission of carbon dioxide (CO2).
In this way, the tumultous phase is characterized by an in-tense alcohol production with CO2release, which is followed
by a local temperature increase, foams and wine acidity. The post-fermentation is characterized by a deceleration of the fermentation activity showing carbohydrate depletion and accumulation of substances and toxins.
B. Acoustic Parameter
Quantitative characterization techniques by ultrasound can be used to describe material acoustic properties and dynami-cal process, like industrial product manufacture. The classidynami-cal acoustic parameters calculated in this study to characterize the RoI were attenuation and backscattering coefficient. The attenuation parameter involves loss from wave energy during its propagation through a medium where energy losses can be associated with reflection, scattering and/or absorption. However, absorption features were disregarded because the sample was exposed to a low-power ultrasonic field. Thus,
the attenuation model in the frequency domain is given by Eq.( 1):
|H(f)|=eβfnx (1) where |H(f)| is the module of the attenuation transfer function,β is the attenuation coefficient, f is the frequency, nis the attenuation frequency-dependence andxis the prop-agation distance. Otherwise, the integrated backscatering co-efficient (IBC) describes quantitatively the multi-directional scattering process caused by interaction mechanism between incident waves and the distribution of heterogeneity charac-teristics from propagation medium. IBC was estimated by Eq.( 2):
ubsc(f) = 1.45D2/S0∆zM(f) (2)
where D is the distance from the transducer positioning, S0 is the transducer active surface, ∆z is the medium
propagation distance,M(f)is the average spectrum obtained from divison between the power spectral density from sample and reference spectrum.
C. Run Test
The Run Test is a non parametric statistical test used to assess the randomness hypothesis for a distribution or data sequence evaluating the mutual dependence between their values. In this study, the Run Test was used to find stationary transient echoes on ultrasound backscattering signals which are produced by interaction between the inspection acoustic field and transit of non-soluble solid particles in the fluid. Thus, stationary transient echoes can be seen like ultrasound signal segments which have distribution parameters that do not change over time. These stationary transient effects on ul-trasound backscattering echoes involve smooth modulations of frequency and amplitude due to the interaction wave-particles during the fermentation fluid in ROI. The Run Test (modus operandi) is based on the clustering variables within predetermined classes from statistical estimators which, al-low to assess the equality condition between adjacent data values for an inspected data sequence.
IV. MATERIALS ANDMETHODS
A. Experimental Setup
Fig. 1. Fermentation characterization system
B. Computational Characterization System
The computational system proposed to characterize the fermentation process is composed by: detection, character-ization and classification stages. These computational proce-dures were implemented in Matlab (7.6.0). In the detection stage were marked high amplitude transient signals (associ-ated with particles transit) on ultrasound vectors collected in the fermentation RoI. These procedure were based in two algorithms: the Run Tests and Curve Fitting analysis. At first, the Run Test basically performs a hypothesis test that evaluates the variance of equally divided ultrasound signal segments aiming to tag identical sequences observed (called ”runs”) and so to find a mutual independece between their segments.
Subsequently, the stationarity condition of ultrasound seg-ments was evaluated applying run hypothesis test, where the number of ”runs” are compared with R value obtained from the run distribution. The R value depends of the interval betweenn1−ς/2andnς/2, whereN is the number of
observations,n=N/2andς = 0.90is the significance level. Moreover, the Curve Fitting analysis is based in a spectral shift method where angular coefficients are estimated from the bandwidth of normalized power spectra, which have been previously estimated from ultrasound vectors collected in RoI. These coefficients obtained by linear regression provide discriminatory indices to identify disturbance areas due to particles motion in the fermentation medium. Thus, in the detection stage can be labeled ultrasonic signal segments that are associated with non-soluble solid particles in the fermentation fluid. The characterization stage is based in spectral analysis of ultrasound signals collected in the fer-mentation RoI over time. For spectral estimates was used a Blackmman Harrish window with a size of 10 times the ul-trasound pulse width given by equipment. The implemented characterization algorithm extracts spectral attributes such as spectrum bandwidth, fundamental frequency and the value of its magnitude. In this stage, acoustic parameter such as attenuation and IBC are estimated according matematical
model expressed in section 2. The attenuation was calculated by the spectral difference method in which, the power spectral density (PSD) from a specular reflection (obtained during wave propagation in non attenuating medium) was compared with power spectral densities from ultrasound backscattering signals recorded in RoI during different times of fermentation. Finally, the classification stage was based in the K-means algorithm, which calculates measurements of the euclidean distance between normalized parameters that were estimated by computational procedures of detection and characterization.
V. RESULTS ANDDISCUSSION
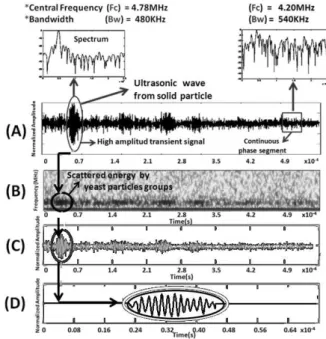
Figures 2 and 3 show an example of the results obtained in detection stage from computational procedures based in the Run test and Curve fitting respectively. In Figure 2 can be seen that high intensity transients from ultrasound backscat-tering signals (produced by interaction wave - non soluble particles) are detected and extracted for further spectral analysis. The applied Run test on ultrasound backscattering signals showed that the distinction between signals associated to solid particles and continuous phase is given because there are spectral and statistics differences between them. Thus, spectral differences among phases are around 11.80% and statistical differences are 31.28%.
Fig. 2. Detection by Run Test analysis. (A) Description of an ultrasound backscattering signal from a liquid mixture of sugarcane juice and yeast on mechanical agitation. (B) Spectrogram. (C) Detection of a group of non-soluble solid particles (dispersed phase). (D) wave extraction associated to saccharomyce particles in RoI.
Fig. 3. Detection by Curve Fitting shows that ultrasound vector points with angular coefficients greater than 0.5 are selected to construct a signal that is likely to be associated with reflections from solid particles of the dispersed phase within the RoI.
However, in the fermentation turbulent phase, ultrasound signal characteristics are more diffuse due to the fermen-tation dynamic behaviour: high CO2 emissions, bubbles
generation, yeast particles multiplication and noise given by mechanical agitation. These effects produce interference on ultrasonic reflections from continuous and dispersed phases providing some acoustic parameters with similar values, making it difficult to differentiate between phases. However, the obtained results in detection and characterization stages were used as input parameters to the classification stage. This allowed an acceptable approximation to distinguish between dispersed and continuous components in the fermentation fluid by relationship between quantitative indices estimated (IBC and attenuation) and the features extracted from ultra-sound signal such as stationarity and detection of specular reflections (see Fig. 4).
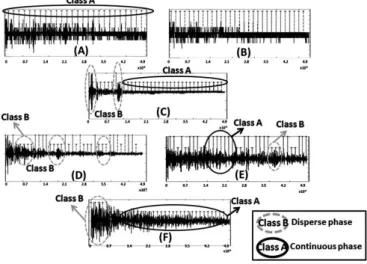
Fig. 4. Examples of classification of the continuous and dispersed phase on ultrasound backscatter signals in different fermentation phases byK-means. (A) Propagation in sugarcane without yeast particles. (B) Propagation in water. (C) Aggregation ofsaccharomyces c.in sugarcane. (D) Adaptation celular phase. (E) Turbulent phase. (F) Stationary phase (Deceleration fermentation activity).
In Figure 4, lines of different heights show the clas-sification of ultrasonic signal segments corresponding to reflections from disperse and continuous phases of the
fer-mentation fluid during their main phases. In each stage of the alcoholic fermentation were compared the number of ultrasonic segments (identified as components of the disperse phase) associated to reflections from insoluble solid particles and the percentage of solid mass measured experimentally by filtration of 50 ml of fermentation fluid. This comparison showed a proportional relationship between the increase in the number of solid particles (identified by the hybrid system proposed) and increasing the percentage of solid mass due to the yeast multiplication in the turbulent stage, such as seen in Fig. 5. In the stationary phase (post-fermentation stage), the relationship between the number of solid particles (identified by classification stage) and the percentage of solid mass showed a proportional depletion due to the sample homogenization, which indicates solid mass loss due to particles dilution (see Fig. 5).
Fig. 5. Relationship between mass percentage of solid particles and number of ultrasonic wave segments identified as reflections from disperse phase by computational procedures implemented.
Figure 6 shows the average fluctuation of various parame-ters calculated to characterize the fermentation liquid mixture over time. These parameters also were estimated in water, which was considered as a reference medium because this is a non attenuating medium with known acoustic properties and therefore enables more easily the computational pro-cedures calibration for the identification of particles of the disperse phase.
In figure 6 can be observed the variations among parameters for water and sugarcane juice in state of rest, mechanical agitation and stirring with aggregation of yeast particles. The average percentage of variation among the parameters for water and sugarcane juice at rest and agitation were 19.7693%and 17.9693%respectively. Moreover, the average percentage of variation among parameters from fermentation phases was approximately 20.4649%. Thus, the difference of the parameters measured between the fermentation phases such as adaptation and tumultuous was 23.9129% approx-imately and the differences between the tumultuous and stationary phase was 15.5638% approximately.
Fig. 6. Variation of mean values of parameters calculated in different propagation media. P1 = Angular coefficient (obatained from spectral dif-ference method). P2 = Fundamental frequency amplitude. P3= Fundamental frequency. P4 = Variance from ultrasonic backscattering signal. P5= Number of ultrasonic segments classified as ”dispersed phase” using K-means. P6 = Mean value of angular coefficients calculated from spectral bandwidth (using Curve fitting). P7 = Spectral bandwidth. P8 = IBC. P9 = Fundamental frequency from an average power spectrum in RoI.
During stationary phase, IBC values decrease according to the diminution in the fermentative activity seen as a more homogeneous liquid mixture with less ultrasonic energy dispersion (caused by dilution and sedimentation of solid particles).
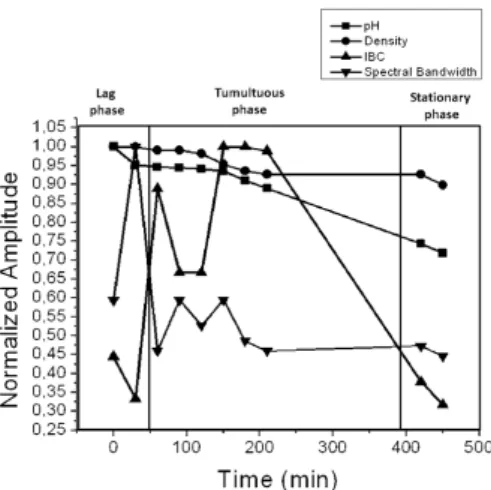
Fig. 7. Parameter variation profiles during different stages of alcoholic fermentation.
Otherwise, in Figure 7, the time evolution of the spectral bandwidth calculated from the average power spectrum of ultrasound backscattering signals (collected in RoI during different times of fermentation) showed how this parameter can describe quantitatively the fermentation process. Thus, the chaotic dynamics of the fluid during the tumultuous phase is observed through the decrease of spectral bandwidth values. The reduction in bandwidth of power spectra is caused by attenuation of high frequencies which, in turn, is related to heterogeneous characteristics of the sample such as high concentration of particles. Figure 6 also shows that the curves of parameters measured can be used to describes the fermentation process kinetics.
VI. CONCLUSION
The hybrid technique of ultrasonic signal processing im-plemented in this study, which is comprised for compu-tational procedures of detection, characterization and clas-sification showed a good performance to identify during mechanical agitation, the continuous and dispersed phase of a liquid mixture of sugar cane juice and yeast particles (species saccharomyces cerevisiae) during the alcoholic fermentation process. The identification of ultrasonic signals associated to insoluble solid particles allowed to obtain in the RoI an approximation of the variation of the solids percentage in the continuous phase. This can be very useful to analyze the dynamic behavior of the fluid inside the fermentation system such as growth of solid particles during the tumultuous phase and homogenization in the stationary phase (post-fermentation) described by the dilution and sedimentation of particles. This study also showed that a classical parameter as the integrated backscattering coefficient (IBC) was effective to describe quantitatively the main phases of the fermentation process. This parameter describes growth and depletion of biomass which can be correlated with the efficiency of the fermentative activity. Also, the correlation between estimated parameters and experimental measurements of pH, density and percentage of solid mass provided a good description of the fermentation time evolution such as exponential and deceleration phases. We expect to improve the classification process by robust implementation of a non linear classifier based in logic fuzzy and mining of input variables.
ACKNOWLEDGMENT
The authors gratefully acknowledge to Dr. Paulo Se-leghim, professor of mechanical engineering department of the School of Engineering of So Carlos - University of Sao Paulo for all the support provided.
REFERENCES
[1] F. Chemat, Z. Huma, and M. Khan, “Applications of ultrasound in food technology: Processing, preservation and extraction,”Ultrasonics Sonochemistry, vol. 18, pp. 813–835, 2011.
[2] R. Jirik and T. T. J. Jan, “Characterization of the ultrasonic attenuation coeffcient and its frequency dependence in a polymer gel dosimeter,”
Phys. Med. Biol, pp. 6747–6759, 2007.
[3] D. Krausea, T. schock, M. Hussein, and T. Becker, “Ultrasonic charac-terization of aqueous solutions with varying sugar and ethanol content using multivariate regression methods,” Journal de Chemometrics, vol. 25, pp. 216–223, 2011.
[4] P. Resa, L. Elvira, F. M. de Espinosa, R. Gonzales, and J. Barcenilla, “On-line ultrasonic velocity monitoring of alcoholic fermentation kinetics,”Bioprocess Biosyst, vol. 32, pp. 321–331, 2009.
[5] Y. Lok and B. Hitzmann, “Ultrasonic measurements and its evaluation for the monitoring of saccharomyces cerevisiae cultivation,” Food Research International, vol. 1, pp. 16–29, 2004.
[6] B. Henning, P. C. Daur, S. Prange, and K. Dierks, “In-line con-centration measurement in complex liquids using ultrasonic sensors,”
Ultrasonics, vol. 38, pp. 799–803, 2000.
[7] P. Resa, L. Elvira, and F. M. de Espinosa, “Concentration control in alcoholic fermentation processes from ultrasonic velocity measure-ments,”Food Research International, vol. 37, pp. 587–594, 2004. [8] S. Hoche, W. Hussein, M. Hussein, and T. Becker, “Time-of-flight
prediction for fermentation process monitoring,”Engineering in Life Sciences, vol. 4, pp. 417–428, 2011.
[9] N. Lamberti, L. Ardia, D. Albanese, and M. D. Matteo, “An ultrasound technique for monitoring the alcoholic wine fermentation,” Ultrason-ics, vol. 49, pp. 94–97, 2009.
[10] A. Dukhin, P. Goetz, and B. Travers, “Use of ultrasound for character-ization dairy products,”American Dairy Science Association, vol. 88, pp. 1320–1334, 2005.