Submitted 29 September 2015 Accepted 5 November 2015 Published26 November 2015
Corresponding author Stanley E. Lazic, [email protected]
Academic editor Mikhail Spivakov
Additional Information and Declarations can be found on page 10
DOI10.7717/peerj.1444
Copyright 2015 Lazic
Distributed under
Creative Commons CC-BY 4.0
OPEN ACCESS
Ranking, selecting, and prioritising genes
with desirability functions
Stanley E. Lazic
In Silico Lead Discovery, Novartis Institutes for Biomedical Research, Basel, Switzerland
ABSTRACT
In functional genomics experiments, researchers often select genes to follow-up or validate from a long list of differentially expressed genes. Typically, sharp thresholds are used to bin genes into groups such as significant/non-significant or fold change above/below a cut-offvalue, andad hoccriteria are also used such as favouring well-known genes. Binning, however, is inefficient and does not take the uncertainty of the measurements into account. Furthermore,p-values, fold-changes, and other outcomes are treated as equally important, and relevant genes may be overlooked with such an approach. Desirability functions are proposed as a way to integrate multiple selection criteria for ranking, selecting, and prioritising genes. These functions map any variable to a continuous 0–1 scale, where one is maximally desirable and zero is unacceptable. Multiple selection criteria are then combined to provide an overall desirability that is used to rank genes. In addition top-values and fold-changes, further experimental results and information contained in databases can be easily included as criteria. The approach is demonstrated with a breast cancer microarray data set. The functions and an example data set can be found in the desiR package on CRAN (https://cran.r-project.org/web/packages/desiR/) and the development version is available on GitHub (https://github.com/stanlazic/desiR).
Subjects Bioinformatics, Computational Biology, Genomics, Oncology
Keywords Desirability, Gene expression, Microarray, R, Data fusion, Rank aggregation
INTRODUCTION
Naggara et al., 2011;Bennette & Vickers, 2012;Barnwell-Menard, Li & Cohen, 2015). For example, if a gene is truly expressed, but due to sampling error has an average expression level just below the threshold, it will be removed from further consideration. This problem is compounded when multiple hard thresholds from several criteria are combined. Second, all selection criteria are implicitly given equal importance, which is often unsuitable. For example, fold-changes might be considered more relevant thanp-values in a pilot study or an underpowered experiment. Finally, there may still be thousands of genes that meet the chosen criteria and there is no clear way to sort or reduce the list further: genes with the smallestp-values are not necessarily the best candidates to follow-up. In such cases researchers may turn to informal methods such as selecting genes that are known to be in relevant pathways or are recognised from a recent publication. The combination of multiple hard thresholds andad hocmethods can miss potentially interesting genes.
Desirability functions are proposed for ranking, selecting, and prioritising genes. They were developed in the 1960s byHarrington (1965)and later extended byDerringer & Suich (1980). They are frequently used in cheminformatics to rank compounds (Segall, 2012; Bickerton et al., 2012) and are co-opted here to prioritise genes.
MATERIALS AND METHODS
Applying desirability functions is a three step procedure: (1) choose the relevant variables to be used as selection criteria, (2) map the values for each variable onto a continuous 0–1 scale using the appropriate desirability function, and (3) calculate the overall desirability as a weighted combination of the individual desirabilities. The genes are then ranked by their overall desirability. These steps are discussed below.
Choose variables for selection criteria
The biological question will determine the variables chosen as selection criteria, and for most studies will include the fold-change (either uni- or bidirectional) andp-value for a comparison of interest. The mean and variance of each gene can be used as nonspecific soft filters to deprioritise genes that are not expressed or have near-constant expression across all samples (McClintick & Edenberg, 2006;Hackstadt & Hess, 2009;Bourgon, Gentleman & Huber, 2010). The real advantage of this approach is that information from databases and other statistical parameters can be used as additional criteria. For example, a translational study using mice might prioritise genes that have a high sequence homology with human genes. Alternatively, genes that are expressed in specific tissues might be prioritised; a study of a neurodegenerative disease may use blood samples, but the main interest is genes that are expressed in the brain. Genes whose protein products are easily accessible and measurable might be preferred for biomarker studies; for example, if they are secreted or located on the cell surface. Genes that are known targets of drugs might be preferred if the intention is to inhibit their function in subsequent experiments using genetic and pharmacological methods.
conditions—such as being up-regulated in Parkinson’s, Alzheimer’s, and Huntington’s disease—compared to controls. The usual hard significance threshold and Venn diagram approach will accumulate false negatives; if the power for each comparison is 0.7, then the power to detect a gene in all three comparisons is only 0.73=0.343. Another application
is to prioritise genes that are differentially expressed in some conditions but not in others (exclusive OR). For example, genes that are differentially expressed only in Parkinson’s disease compared to controls and unchanged in the other two diseases. Another criterion is consistency of expression across groups. Genes with similar expression levels between males and females and those without circadian or seasonal variation might be better biomarkers for a diagnostic assay (Dopico et al., 2015). A final example is a dose-response experiment where dose is treated as an ordered categorical factor and analysed with an analysis of variance. The genes of primary interest would be those with a large linear coefficient, but without large quadratic or cubic coefficients.
Map values to 0–1 with desirability functions
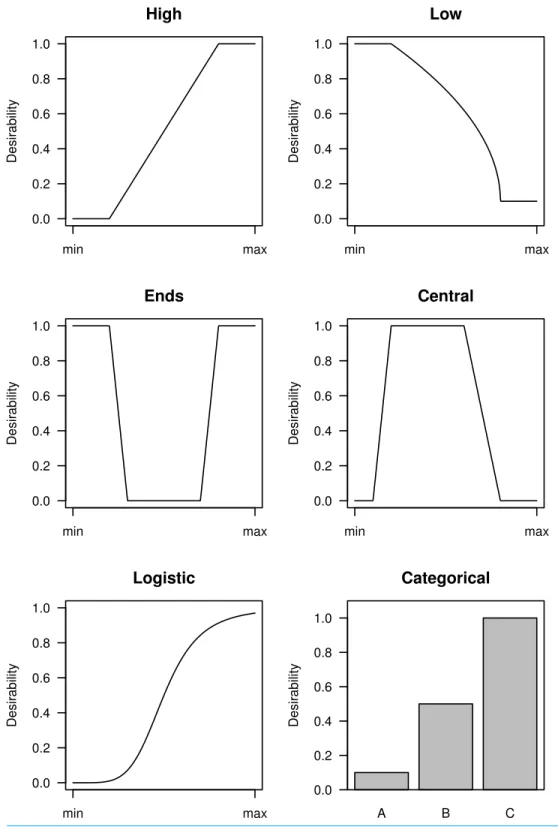
Once the key variables have been selected, the next step is to map their values to a 0–1 scale. The choice of mapping function depends on whether high, low, central, or extreme values are considered desirable. Categorical variables can also be included and examples are shown inFig. 1. Most functions have user-defined cut points that specify where the functions change. The cut points can be based on relevant values (e.g.,p<0.05,
fold-change>2) or on the properties of the distributions; for example, the top 10% of
a distribution gets a maximum desirability. The minimum and maximum desirability can also be chosen, but zero and one are often suitable defaults. In some cases a non-zero minimum desirability might be preferred so that a gene is not excluded. Any function that maps values to a 0–1 scale can be used, but those shown inFig. 1should cover most situations in experimental biology.
Calculate the overall desirability
The criteria are then assigned weights according to their importance. The absolute values of the weights are unimportant, only their relative ratios. For example, values of 20 and 10, 2 and 1, or 1 and 0.5 are equivalent because the first value is twice the value of the second, and therefore will contribute twice as much to the overall desirability. The individual desirabilities and weights are then combined into an overall desirability using a weighted geometric mean (Eq. (1))
D=exp
n
i=1 wilndi
n
i=1 wi , (1)
where the natural log ofndesirabilities (di,i=1...n) are multiplied by the importance
weights (wi,i=1...n), and then divided by the sum of the weights. A geometric mean is
gene is not expressed and has a desirability of zero for this criterion, then the values of the other desirabilities are irrelevant.
One or two main criteria, such as the fold-change andp-value, should be given a high weight so that they drive the ranking. Criteria used as soft filters (e.g., average expression) are assigned low weights, and other criteria that are of secondary importance are given intermediate weights. The R script in theSupplemental Informationprovides a complete analysis for this example.
RESULTS AND DISCUSSION
A microarray example
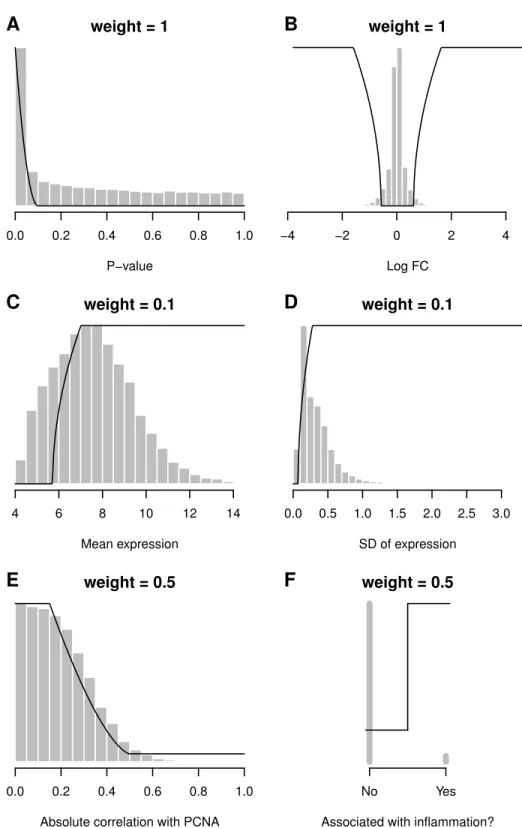
Desirability functions are illustrated with a breast cancer Affymetrix microarray study fromFarmer et al.(2005, GEO: GDS1329). For this example the basal and luminal groups are compared and the apocrine group is not used. Using only a false discovery rate (FDR) cut-offof 0.05, there are 4,830 differentially expressed probe sets between these two groups, which is far too many to follow-up experimentally. Additional variables are therefore used for selection criteria and are shown inFig. 2. Thep-value (low values good) and log2fold-change (extreme values good) are the two key criteria and receive a maximum
weight of one. Probe sets with ap-value below 0.0001 are given the maximum desirability (d=1), probe sets withp-values greater than 0.1 are completely filtered out (d=0), and
probe sets with intermediatep-values receive intermediate desirability values. The average expression (high values good) and variability of expression (high values good) are used as soft nonspecific filters and receive a low weight of 0.1—or 10% of the maximal weight. A low weight is used because we do not want the ranked list to be driven by these variables.
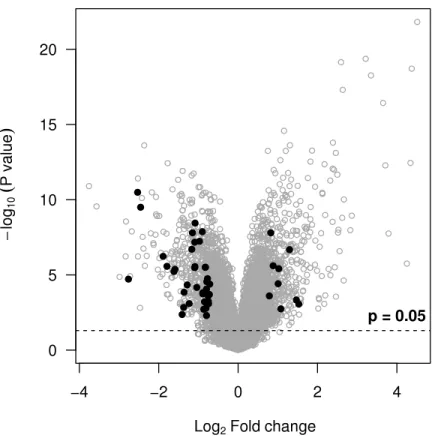
Figure 3 Volcano plot showing probe sets with an overall desirability greater than 0.7 (black points).They meet all of the selection criteria but are not necessarily those with the smallestp-values or most extreme fold-changes.
given our selection criteria. Alternative desirabilities can be calculated to address different questions or reflect different criteria.
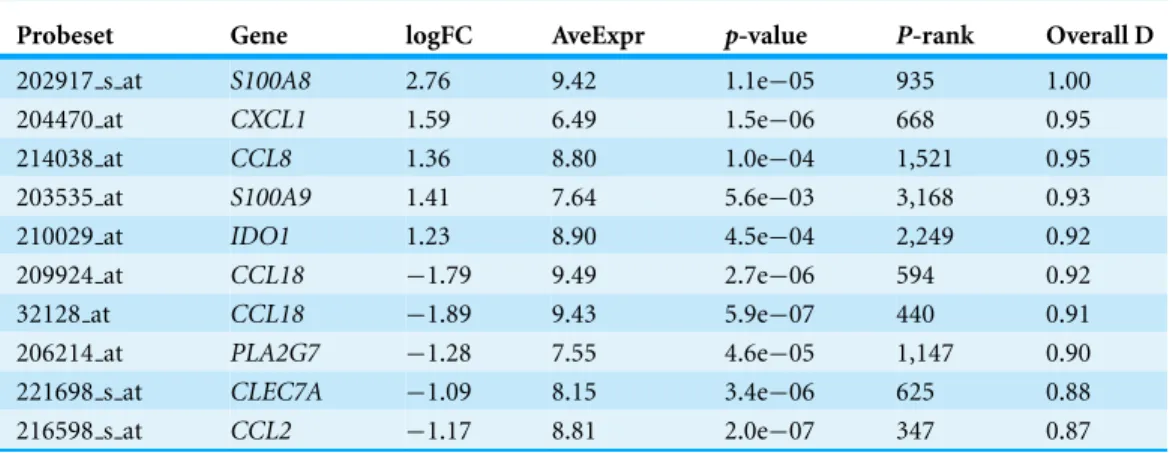
Table 1shows the top ten probe sets sorted by overall desirability. Most genes are known to be relevant for breast cancer and have an FDR<0.01, even though the FDR was not a
selection criterion. The columnP-rank shows the probe sets’ location in a list sorted by p-value (to make the list comparable to a standard analysis, 10,700 low expressed (mean expression<6) and low variance (standard deviation<0.25) probe sets were removed).
For example,S100A9is ranked 3,168th when the list is sorted byp-value and it is unlikely to be selected as a candidate for follow-up experiments, despite having a fold-change of 21.41
=2.66, meeting all other criteria, and is involved in breast cancer (Yin et al., 2013;
Gumireddy et al., 2014;Cormier et al., 2014). On their own, the results inTable 1do not prove that these genes are relevant for breast cancer, only that they best met the overall criteria, given all the individual criteria, their mappings, and importance weights.Table 1 therefore represents the beginning of the validation round and not the end of the study. Since the functions can be modified to make favoured genes appear near the top of a list, one should ensure that the ranking reflects the criteria rather than the criteria reflecting a desired ranking. In other words, the workflow is criteria→ranked list→validation, not
favourite genes→criteria→scientific claim. As with many methods that have multiple
Table 1 Top ten probe sets sorted by overall desirability.
Probeset Gene logFC AveExpr p-value P-rank Overall D
202917 s at S100A8 2.76 9.42 1.1e−05 935 1.00
204470 at CXCL1 1.59 6.49 1.5e−06 668 0.95
214038 at CCL8 1.36 8.80 1.0e−04 1,521 0.95
203535 at S100A9 1.41 7.64 5.6e−03 3,168 0.93
210029 at IDO1 1.23 8.90 4.5e−04 2,249 0.92
209924 at CCL18 −1.79 9.49 2.7e−06 594 0.92
32128 at CCL18 −1.89 9.43 5.9e−07 440 0.91
206214 at PLA2G7 −1.28 7.55 4.6e−05 1,147 0.90
221698 s at CLEC7A −1.09 8.15 3.4e−06 625 0.88
216598 s at CCL2 −1.17 8.81 2.0e−07 347 0.87
Notes.
logFC, log fold-change; AveExpr, average expression;P-rank, rank when gene list is sorted byp-value; Overall D, overall desirability.
which cut points and weights affect the overall results and to check the stability of the final list (Boulesteix & Slawski, 2009).
Integrating data with desirability functions
Desirability functions can not only be used to rank genes within a single experiment, but also to rank genes across several experiments, and to integrate diverse and heterogeneous data—so called data fusion. Suppose a breast cancer proteomics data set with the same two patient groups is available and we are interested in finding genes that are consistently up- or down-regulated in both data sets. An overall desirability can be calculated for the microarray and proteomics data separately, using whatever criteria are deemed relevant. The two experiment-level overall desirabilities can then be combined into a second-level overall desirability, where the weights reflect the experiments’ relevance, importance, or quality. This is preferable to hard significance thresholds and Venn diagrams for the reasons discussed above. It may also be preferable to a meta-analysis, since it could argued that the data sets are sufficiently different and are not estimating a common parameter; and with only two experiments, the between-experiment variance will be poorly estimated.
(e.g., top 40 genes in each list) to make the analysis manageable. This is another example of binary thresholding, and many genes are excluded even before the data are combined. There are likely many genes that are consistently but moderately differentially expressed across experiments and these can be missed with such an approach. The desirability approach only uses one hard threshold at the very last step, and so all genes are retained until the end. Since the approach is computationally trivial, there is no need to remove genes (mapping the six criteria to a 0–1 scale and combining the results of 22,214 probe sets took less than a second with a 2.93 GHz processor). How the desirability approach compares with the different rank aggregation methods on predictive performance or the ability to select good genes (by some criterion) is still an open question.
There may be missing values when integrating data because an entity may not be measured in all experiments. For example, there may be data for a gene in the microarray experiment but not in the proteomics experiment. In this case the second-level ranking will only use the microarray data. Since the importance weights are normalised to sum to one across all criteria or experiments, criteria with missing values will not influence the ranking, and the remaining criteria will maintain their relative importance. In such cases it is useful to include an additional column in the ranked table indicating the number of experiments or assays for which there are observations.
What desirability functions are not
Desirability functions are not a machine learning method; they are not expected to select genes whose main virtue is their ability to discriminate between groups or to improve predictions. A gene that is related to proliferation may be an excellent predictor of group membership or survival, but may be irrelevant to a scientist interested in inflammatory aspects of the disease.
Desirability functions are not prior probabilities; they represent preferences for certain outcomes or characteristics over others regardless of their prior probability. Subjective decisions are made, but the same is true for the usual method of selecting genes based onp-values and fold-changes, which implicitly use a step-function to map variables to a binary 0/1 scale at a given threshold, and all variables are given equal weight. We might ask whether step-functions are suitable and whether all variables should be given equal weight?
The desirability approach is a simple algorithm that formalises and generalises current methods of selecting genes.
CONCLUSIONS
and so can be shared with others, criticised, and modified as needed. Seventh, it is computationally efficient, especially compared to optimisation methods. Finally, the uncertainty in the estimates is taken into account by avoiding unnecessary dichotomisation and mapping estimates to intermediate values between zero and one.
The main disadvantage of this approach is that the results are not probabilistic—there are nop-values or confidence intervals associated with the desirabilities. However, the purpose of this approach is not to declare that something new has been discovered, but to select and prioritise genes for further experimentation. A more detailed discussion of the functions and options are provided in the R package vignette (https://cran.r-project.org/ web/packages/desiR/vignettes/Gene ranking.pdf).
ACKNOWLEDGEMENTS
I would like to thank Pierre Farmer for suggesting the breast cancer microarray data set and for comments on the manuscript, and Ansgar Schuffenhauer and Steffen Renner for comments on the manuscript and/or R package.
ADDITIONAL INFORMATION AND DECLARATIONS
Funding
The author received no funding for this work.
Competing Interests
The author is an employee of Novartis Institutes for Biomedical Research. Author Contributions
• Stanley E. Lazic conceived and designed the experiments, performed the experiments,
analyzed the data, contributed reagents/materials/analysis tools, wrote the paper, prepared figures and/or tables, reviewed drafts of the paper.
Data Availability
The following information was supplied regarding data availability: https://cran.r-project.org/web/packages/desiR/.
Supplemental Information
Supplemental information for this article can be found online athttp://dx.doi.org/ 10.7717/peerj.1444#supplemental-information.
REFERENCES
Aerts S, Lambrechts D, Maity S, Van Loo P, Coessens B, De Smet F, Tranchevent L-C, De Moor B, Marynen P, Hassan B, Carmeliet P, Moreau Y. 2006.Gene prioritization through genomic data fusion.Nature Biotechnology24(5):537–544DOI 10.1038/nbt1203.
Bennette C, Vickers A. 2012. Against quantiles: categorization of continuous variables in epidemiologic research, and its discontents.BMC Medical Research Methodology12:21
DOI 10.1186/1471-2288-12-21.
Bickerton GR, Paolini GV, Besnard J, Muresan S, Hopkins AL. 2012.Quantifying the chemical
beauty of drugs.Nature Chemistry4(2):90–98DOI 10.1038/nchem.1243.
Boulesteix A-L, Slawski M. 2009.Stability and aggregation of ranked gene lists.Briefings in Bioinformatics10(5):556–568DOI 10.1093/bib/bbp034.
Bourgon R, Gentleman R, Huber W. 2010.Independent filtering increases detection power for high-throughput experiments.Proceedings of the National Academy of Sciences of the United States of America107(21):9546–9551DOI 10.1073/pnas.0914005107.
Chen H, Cohen P, Chen S. 2007.Biased odds ratios from dichotomization of age.Statistics in Medicine26(18):3487–3497DOI 10.1002/sim.2737.
Cohen J. 1983.The cost of dichotomization.Applied Psychological Measurement7(3):249–253 DOI 10.1177/014662168300700301.
Cormier K, Harquail J, Ouellette RJ, Tessier PA, Guerrette R, Robichaud GA. 2014.Intracellular expression of inflammatory proteins S100A8 and S100A9 leads to epithelial-mesenchymal transition and attenuated aggressivity of breast cancer cells.Anti-Cancer Agents in Medicinal Chemistry14(1):35–45DOI 10.2174/18715206113136660333.
DeConde RP, Hawley S, Falcon S, Clegg N, Knudsen B, Etzioni R. 2006.Combining results of microarray experiments: a rank aggregation approach.Statistical Applications in Genetics and Molecular Biology5:Article15DOI 10.2202/1544-6115.1204.
Derringer G, Suich R. 1980.Simultaneous optimization of several response variables.Journal of Quality Technology12(4):214–219.
Dopico XC, Evangelou M, Ferreira RC, Guo H, Pekalski ML, Smyth DJ, Cooper N, Burren OS, Fulford AJ, Hennig BJ, Prentice AM, Ziegler A-G, Bonifacio E, Wallace C, Todd JA. 2015.
Widespread seasonal gene expression reveals annual differences in human immunity and
physiology.Nature Communications6:7000DOI 10.1038/ncomms8000.
Fan H, Zhao H, Pang L, Liu L, Zhang G, Yu F, Liu T, Xu C, Xiao Y, Li X. 2015.Systematically prioritizing functional differentially methylated regions (fDMRs) by integrating multi-omics data in colorectal cancer.Scientific Reports5:12789DOI 10.1038/srep12789.
Farmer P, Bonnefoi H, Becette V, Tubiana-Hulin M, Fumoleau P, Larsimont D, Macgrogan G, Bergh J, Cameron D, Goldstein D, Duss S, Nicoulaz A-L, Brisken C, Fiche M, Delorenzi M, Iggo R. 2005.Identification of molecular apocrine breast tumours by microarray analysis. Oncogene24(29):4660–4671DOI 10.1038/sj.onc.1208561.
Gumireddy K, Li A, Kossenkov AV, Cai KQ, Liu Q, Yan J, Xu H, Showe L, Zhang L, Huang Q. 2014.ID1 promotes breast cancer metastasis by S100A9 regulation.Molecular Cancer Research 12(9):1334–1343DOI 10.1158/1541-7786.MCR-14-0049.
Hackstadt AJ, Hess AM. 2009.Filtering for increased power for microarray data analysis.BMC Bioinformatics10:11DOI 10.1186/1471-2105-10-11.
Harrington J. 1965.The desirability function.Industrial Quality Control21(10):494–498.
Irwin J, McClelland G. 2003.Negative consequences of dichotomizing continuous predictor variables.Journal of Marketing Research40:366–371DOI 10.1509/jmkr.40.3.366.19237.
Lazic SE. 2008.Why we should use simpler models if the data allow this: relevance for ANOVA designs in experimental biology.BMC Physiology8:16DOI 10.1186/1472-6793-8-16.
Lin S, Ding J. 2009.Integration of ranked lists via cross entropy Monte Carlo with applications to
mRNA and microRNA Studies.Biometrics65(1):9–18DOI 10.1111/j.1541-0420.2008.01044.x.
MacCallum RC, Zhang S, Preacher KJ, Rucker DD. 2002.On the practice of dichotomization of quantitative variables.Psychological Methods7(1):19–40DOI 10.1037/1082-989X.7.1.19.
McClintick JN, Edenberg HJ. 2006.Effects of filtering by present call on analysis of microarray
experiments.BMC Bioinformatics7:49DOI 10.1186/1471-2105-7-49.
Moreau Y, Tranchevent L-C. 2012.Computational tools for prioritizing candidate genes: boosting disease gene discovery.Nature Reviews Genetics13(8):523–536DOI 10.1038/nrg3253.
Naggara O, Raymond J, Guilbert F, Roy D, Weill A, Altman DG. 2011.Analysis by categorizing or dichotomizing continuous variables is inadvisable: an example from the natural
history of unruptured aneurysms. American Journal of Neuroradiology32(3):437–440
DOI 10.3174/ajnr.A2425.
Owen SV, Froman RD. 2005.Why carve up your continuous data?Research in Nursing and Health 28(6):496–503DOI 10.1002/nur.20107.
Pihur V, Datta S, Datta S. 2008.Finding common genes in multiple cancer types through
meta-analysis of microarray experiments: a rank aggregation approach.Genomics
92(6):400–403DOI 10.1016/j.ygeno.2008.05.003.
Segall MD. 2012.Multi-parameter optimization: identifying high quality compounds with a balance of properties.Current Pharmaceutical Design18(9):1292–1310
DOI 10.2174/138161212799436430.
Senn S. 2003. Disappointing dichotomies. Pharmaceutical Statistics 2(4):239–240 DOI 10.1002/pst.90.
Streiner DL. 2002.Breaking up is hard to do: the heartbreak of dichotomizing continuous data. Canadian Journal of Psychiatry47(3):262–266.
Venet D, Dumont JE, Detours V. 2011.Most random gene expression signatures are significantly
associated with breast cancer outcome.PLoS Computational Biology7(10):e1002240
DOI 10.1371/journal.pcbi.1002240.