AERA Open October-December 2016, Vol. 2, No. 4, pp. 1 –15 DOI: 10.1177/2332858416679374 © The Author(s) 2016. http://ero.sagepub.com
Creative Commons CC-BY: This article is distributed under the terms of the Creative Commons Attribution 3.0 License THE annual shortage of special education teachers (SETs)
across the United States poses staffing challenges for local school districts (U.S. Department of Education, 2015a) and the education of nearly 6.5 million children with disabilities (U.S. Department of Education, 2015b). However, efforts to improve the supply of SETs often overlook key concerns about the diversity and distribution of SETs across schools. In special education under the Individuals with Disabilities Education Act (IDEA; 2004), students of color represent nearly half of 6- to 21-year-olds enrolled in classrooms (Snyder & Dillow, 2015), yet teachers of color represent only 17% of SETs (Schools and Staffing Survey, 2011).1 These trends have led some to argue that cultural mismatch between teachers and students may contribute to racial dis-parities in special education and poor academic outcomes for students with disabilities (Tyler, Yzquierdo, Lopez-Reyna, & Flippin, 2004). In acknowledging the needs of stu-dents of color who will make up more than half of the total student population by 2024, the U.S. Department of Education (2016b) recently released a report emphasizing the need for racial diversity in a profession that remains majority White. Yet despite current and past calls for recruit-ing more teachers of color overall (Patton, Williams, Floyd, & Cobb, 2003), there is little research on whether this has improved in special education.
A concern closely related to students’ access to racially diverse SETs is the availability of SETs with appropriate
training and qualifications. Highly effective teachers have been linked to positive long-term outcomes for children overall (Chetty, Friedman, & Rockoff, 2014), and research indicates that children with disabilities achieve higher test scores when taught by teachers with SET certification (Feng & Sass, 2013). Unfortunately, schools characterized by pov-erty and high rates of racial minorities are less likely to attract qualified teachers (Clotfelter, Ladd, & Vigdor, 2005; Lankford, Loeb, & Wyckoff, 2002). Although these dispari-ties in the distribution of general education teachers have been well documented, the extent of SET sorting across schools, districts, and counties is less clear. An understand-ing of whether the variation in teacher qualifications exists among schools within districts or simply across districts is critical for improving SET recruitment and hiring policies that can ensure that SETs are distributed equitably at the appropriate school and district levels. The former may require policy change among district leaders, while the latter suggests the need for state-level initiatives to distribute SETs more equitably across regions. Focusing on the distribution of SETs is also relevant for understanding how to improve student access to SETs of color beyond increasing the sup-ply, especially if teachers of color are more likely to select specific geographic areas (Reininger, 2012).
In this study, we investigated changes in the racial com-position of the SET workforce in California from 1997 to 2014 and the distribution of SETs by professional
Diversity and Equity in the Distribution of Teachers
With Special Education Credentials: Trends From California
North Cooc Man Yang
The University of Texas at Austin
The shortage of special education teachers (SETs) is a persistent challenge in the United States, but less is known about two other important issues that affect students with disabilities: racial diversity within the SET workforce and the distribution of SETs. Using administrative data on all teachers in California from 1997 to 2014, we examine the racial composition and distribution of teachers with special education credentials. Our results from descriptive and regression analyses show that while teachers with special education credentials remain majority White, the number of teachers of color with special educa-tion credentials has increased at a rate more than twice that of general educaeduca-tion teachers and special educaeduca-tion students of color. We also find that much of the distribution of teachers with special education credentials occurs across districts within the same regional county, while disparities in teacher qualifications are larger by school poverty, racial composition, and student achievement. The results have policy implications for improving diversity and educational equity within the special education workforce.
Keywords: special education teachers, diversity, equity, distribution, qualifications 679374EROXXX10.1177/2332858416679374Cooc and YangDiversity and Equity in Special Education
Cooc and Yang
characteristics. We focused on SETs in California because the state serves the largest and one of the more racially diverse special education populations in the country. Using data on all teachers with special education credentials over the last 18 years, this study is one of the first to document changes in the racial composition of the SET workforce over an extended period and assess whether calls for SET diversity during previous amendments of IDEA have succeeded (Patton et al., 2003). We also extend previous work that has examined the distribution of SET quality in high-poverty schools (Mason-Williams, 2015), by simultaneously assess-ing the extent of variation in SET qualifications at the school, district, and county levels. We further link teacher and school records to analyze differences in SET quality by school char-acteristics. Overall, the state context allows us to probe deeper into the extent to which the degree of inequality in the distribution of SETs may affect the educational opportunities and legal rights of students with disabilities.
Background
Racial Diversity and the SET Workforce
Nearly 83% of all teachers in the United States identify as White, with 7% as Hispanic, 7% as Black, and 2% as Asian (Aud et al., 2011). Research indicates progress in diversify-ing the teacher workforce, as the total number of teachers of color has doubled over the last 20 years (Ingersoll & May, 2011). However, the workforce remains majority White and contrasts with a student population that has become more diverse. Currently more than 40% of students are students of color (Snyder & Dillow, 2015), but the total number has increased by nearly 75% from 1988 to 2008 (Ingersoll & May, 2011). These trends are also reflected in special educa-tion, where students of color are 46% of the population (Snyder & Dillow, 2015), which has increased nationally by 25% from 2000 to 2010. Data from the Schools and Staffing Survey (2011) indicate that about 15% of SETs are teachers of color, slightly less than non-SETs.
The racial disparities in the student and teacher popula-tion have led to a push for the increased recruitment of teachers of color (U.S. Department of Education, 2016b), often based on two rationales about equity and learning. The first rationale stems from the view that public institutions should reflect the composition of society. Schools, in this case, “should look like America” (Tyler et al., 2004, p. 23). Social institutions such as schools should also make attempts to include groups that have been historically marginalized and excluded from equal opportunities in the labor market. In special education, this movement was reflected in IDEA amendments of 1990 and 1997 that called for an increase in the number of underrepresented groups in teacher education programs (Patton et al., 2003). Research shows that the per-centage of undergraduates who are students of color has increased from 21% in 1990 to 43% in 2014 (National
Center for Education Statistics, n.d.), suggesting that more students of color are attending college but not necessarily entering teaching.
The second rationale relates to the benefits of diversity to the teacher workforce and students. The U.S. Department of Education (2016b) argues that “we are stronger as a nation when people of varied backgrounds, experiences, and per-spectives work and learn together; diversity and inclusion breeds innovation” (p. 1). Research shows that teachers of color can serve as positive role models who challenge nega-tive stereotypes for all students while improving academic outcomes (Dee, 2004; Egalite, Kisida, & Winters, 2015). Other studies have found that teachers of color are more likely to have higher expectations of students of color (Grissom & Redding, 2016) and develop more trusting rela-tionships (Villegas & Irvine, 2010).
Within special education, more teachers of color may help address the persistent challenges of racial disparities in student referral for services. Indeed, the lack of teachers who understand the cultural backgrounds and behaviors of students has been cited as a potential source of the overi-dentification students of color in special education (Artiles, Harry, Reschly, & Chinn, 2002) and school disciplinary practices for students with disabilities (Sullivan, Van Norman, & Klingbeil, 2014). However, federal data show-ing the past and current overrepresentation of students of color in special education (i.e., U.S. Department of Education, 2015b) have been challenged by recent works (Hibel, Farkas, & Morgan, 2010; Morgan et al., 2015). Studies based on richer student-level data have revealed that students of color are underrepresented relative to White peers in special education, when controlling for student background differences. Underrepresentation raises the concern that students of color, when statistically similar to White students, are overlooked for special education ser-vices. While it is unclear why students of color are under-represented in these studies, one possibility is that these students lack cultural advocates within schools who under-stand their special needs. The debate about whether students of color are under- or overrepresented in special education is an ongoing one (see response from Skiba, Artiles, Kozleski, Losen, & Harry, 2016), but these disparities sup-port the need for more SETs of color to ensure that students of color are appropriately identified for special education.
Distribution of SETs
Diversity and Equity in Special Education
particularly those where student poverty and racial minority rates are low and achievement levels are high (Clotfelter et al., 2005; Lankford et al., 2002). In special education, an unequal distribution of SETs challenges the provision of a free and appropriate public education to students with dis-abilities and the requirement that all teachers are highly qualified under IDEA (Yell & Crockett, 2011). Unequal access to qualified SETs may compromise the long-term outcomes for a legally protected student population.
Focusing on the distribution of SETs is also important because policies aimed at solely increasing the supply of SETs will not be able to ensure that students with disabilities have access to qualified teachers (Boe et al., 2013). Studies exam-ining the distribution of SETs have focused mainly on differ-ences in SETs by school or district poverty levels. Using national data from the School and Staffing Survey, Mason-Williams (2015) found that SETs in high-poverty schools were less likely to have teaching experience, a master’s degree or higher, and certification in content areas. Fall and Billingsley (2011) found similar patterns for SETs in high-poverty dis-tricts using data from the Study of Personnel Needs in Special Education. However, the extent to which SETs are distributed along other important school characteristics, such as racial composition and achievement level, is unknown. Furthermore, previous studies focusing on schools and districts separately ignore that SETs may be distributed simultaneously at multi-ple levels, across schools within the same district or across districts within counties. It is important to note that research on the distribution of SETs focuses on describing where they teach, which is separate from addressing what factors contrib-ute to these patterns. The latter is beyond the scope of this study, but a combination of local policies, geography, and individual preferences may influence the distribution of teach-ers (e.g., Loeb & Reininger, 2004).
California Context
California has played an important role in shaping current national special education policies and the discourse on racial disproportionality. In Diana v. State Board of
Education (1974), the court ruled that districts in a California
county had disproportionately enrolled more Chicano stu-dents in special education classes than in general education. The case led to the development of new measures to assess “significant variance” in the percentage of Chicano students in special education relative to that in the school population. A similar case later that decade, Larry P. vs. Riles (1979), argued that the proportion of African American students in a local district identified for special education was higher than in general education. As part of that settlement, the court ordered the California Department of Education to monitor the overrepresentation of African American students. Both court cases raised national awareness of issues affecting stu-dents of color, while concerns from the Diana case were
eventually incorporated into Public Law 94-142 in 1975, now known as IDEA. Current national policies and debates about racial disproportionality in special education are a legacy of these legal battles (MacMillan, Hendrick, & Watkins, 1988; U.S. Department of Education, 2016a).
Currently, California is home to more than 6.3 million stu-dents from diverse racial, linguistic, and socioeconomic back-grounds. Of the K–12 student population in 2014, more than half (53%) identify as Hispanic, followed by White (25%), Asian (12%), and African American (6%; California Department of Education, n.d.). About 22% of students are considered English learners, most of whom speak Spanish as a primary language (85%). More than half receive free or reduced-priced lunches. In special education, California spends nearly 20% more than the nation as a whole, but the state has one of the lowest special education enrollment rates in the country at 11% (Lipscomb, 2009). The racial composi-tion within special educacomposi-tion is similar to the state student population for Hispanics (53%) and Whites (27%), slightly higher for African Americans (10%), and lower for Asians (9%; California Department of Education, n.d.). In part due to the size and demographics of the student population and the history of special education in the state, California presents a strong case to explore diversity and equity in SET trends.
Present Study
Cooc and Yang
Research Question 1: What are the trends in the growth of
teachers of color with special education credentials from 1997–1998 to 2014–2015?
Research Question 2: To what extent are teachers with
special education credentials distributed among coun-ties, districts, and schools in terms of other profes-sional qualifications?
Research Question 3: To what extent are the
qualifica-tions of teachers with special education credentials distributed with respect to school poverty, racial com-position, and student achievement?
Method
Data Source
Teachers. Our analyses used administrative data sets that
contain information on teachers, students, schools, and dis-tricts from the California Department of Education. We focused on teacher data sets from the 1997–1998 to 2014– 2015 school years, which are the oldest and most recent files publicly available for download from the department. The main file of interest was an individual-level data set that included the information on demographic traits and profes-sional qualifications (i.e., years of teaching and education level) of nearly 350,000 school staff members employed each year in California. We created a subsample of SETs based on whether a staff member was assigned a teacher position, possessed a special education and full teaching cre-dential, and worked a full-time equivalent of 0.50 or higher. This excluded staff members who worked as administrators or for pupil services (i.e., librarians and cooking staff).
Although our definition of SETs based on credentials is similar to other studies examining teacher distributions in other subject fields (e.g., Ingersoll & Perda, 2010), there are limitations. Primarily, it is possible that a teacher possessed a special education teaching credential but did not teach spe-cial education that year. Some general education teachers may acquire a special education credential to improve employment chances or earn an extra stipend in some dis-tricts (Clotfelter, Glennie, Ladd, & Vigdor, 2008). Since we were unable to identify in the data set whether teachers with special education credentials taught special education, we interpret our estimates in this study as the total supply of teachers with a special education credential in a given year. One advantage of focusing on the supply of teachers with special education credentials is that schools may assign teachers without appropriate credentials for special educa-tion posieduca-tions when there are shortages (Rosenberg & Sindelar, 2005).
Although we were unable to identify teachers’ main teaching assignments in the data, we attempted to assess, using two other resources, the extent to which the number of teachers with special education credentials may be an over-estimate of the number of teachers who teach special
education. First, according to the national School and Staffing Survey of 2011, nearly 87% of teachers with a spe-cial education credential in California also held a spespe-cial education teaching position. This indicates that a majority of teachers with a special education credential do teach special education in the state. Second, we compared our estimates with those from the Bureau of Labor Statistics, which pro-duces employment data for more than 800 occupations for the nation and individual states based on surveys of indus-tries. In Figure 1, we find comparable trends, with our annual estimates of teachers with a special education credential approximately 2.2% higher than Bureau of Labor Statistics records, particularly in more recent years. Both external data sources suggest that a special education credential is an ade-quate proxy to examining SET trends in the state. To further address whether trends in this study reflect those unique to SETs, we also conducted similar analyses of teachers with-out special education credentials where appropriate. The overlap between teachers with special education credentials and teachers with a formal special education position is important for comparison with other SET studies that use the latter. However, to be consistent with the data in this study, we interpret our results as teachers with special education credentials in the remainder of this article.
Students. When comparing teachers with special education
credentials with student trends, we used annual state records on the total number of students with disabilities in the state, disaggregated by race and ethnicity. For parsimony, we cre-ated a category that combines all students of color.
Schools and districts. The remaining files contained
demo-graphic data on students at the school and district levels, including student enrollment, free or reduce-priced lunches, and academic achievement on the state assessments. We linked the school files with the teacher data set using a school identification number. Unfortunately, staff identifica-tion numbers are not unique across years and cannot be linked to examine employment histories. For analyses focus-ing on the distribution of SETs across schools and districts, we focused on the most recent year, 2014–2015. This merged data set included 8,331 schools across 868 districts and 57 counties. With the exception of the 2009–2010 to 2011–2012 school years, which did not release special education teacher data, all files can be downloaded from the California Depart-ment of Education website or the online tool DataQuest.
Measures
Teacher characteristics. In addition to describing trends in
used in Mason-Williams (2015) and Lankford et al. (2002)— including binary indicators for novice teachers who had three years of experience or less (1 = yes, 0 = no), an advanced degree (1 = master’s or higher, 0 = bachelor’s or less), and tenure status (1 = tenured, 0 = probationary, long-term substi-tute, or temporary employee). Although teachers were identi-fied by whether they possessed a special education credential, the data set indicated whether they possessed credentials in other subject areas. We added a binary indicator for whether these teachers possessed two or more other credentials, as an indirect measure of teacher quality and expertise in other areas. Last, given our interest in examining the racial diver-sity of the SET workforce, we added a measure of the teach-er’s race (1 = minority, 0 = White).
School characteristics. Using the school-level demographic
files, we identified three student characteristics to under-stand how teachers with special education credentials may be distributed across schools. Similar to other studies that examined teacher labor markets (e.g., Clotfelter et al., 2005; Lankford et al., 2002), ours focused on the percentage of students of color in the school, the percentage of students receiving free or reduce-priced lunches (an indicator of school poverty rate), and the average student achievement level (a composite measure from the school’s academic per-formance index based on student results across grades on the California Standardized Test and Reporting program). We divided each school-level variable into quartiles to summa-rize the characteristics of teachers with special education credentials in those schools—for instance, the percentage of
novice teachers in low-poverty (below first quartile) versus high-poverty (above third quartile) schools.
Analytic Method
For our first research question, regarding trends in the growth of teachers of color with special education creden-tials over the last 18 years, we used basic descriptive statis-tics. Specifically, we adopted an approach similar to that of Boe (2006), where the growth in the total number of teachers of color is compared with a baseline 1997–1998 school year. The percentage growth served as a common metric to com-pare trends for teachers of color with and without special education credentials. We used the same approach when examining changes in the number of special education stu-dents of color relative to teachers of color with special edu-cation credentials. We also calculated the percentage of special education students and teachers with special educa-tion credentials who are racial minorities for each year as a comparison.
In our second research question, we examined the distri-bution of teachers with special education credentials across schools and districts, using three strategies. The first entailed calculating district averages for each teacher characteristic (i.e., percentage of teachers with special education creden-tials who have a master’s degree in a district) and summariz-ing the distribution at the 10th, 50th, and 90th percentiles across all districts. We focused on the district level here since districts averaged about 42.2 SETs, compared with 4.5 at the school level. The second strategy entailed decomposing the
FIGURE 1. A comparison of the number of teachers with special education credentials from the California Department of Education
Cooc and Yang
variation in each of the five SET characteristics across schools, districts, and regional counties using an intercept-only multilevel logistic regression model that combines teachers (Level 1) nested within schools (Level 2) nested within districts (Level 3) and counties (Level 4) for the 2014– 2015 school year file:
logit
(
pijkl)
= β0jkl = β0+u0jkl+υ0kl+τ0l (1)This model predicts the log odds of a teacher characteristic (i.e., holding a master’s degree or higher) for teacher i in school j, district k, and county l; pijkl is the probability of that characteristic; β0 is the fixed intercept; and u0jkl, υ0kl, and τ0l are random effects for the school, district, and county levels, respectively. Using the variance components, we estimated intraclass correlations to describe the variation in each teacher characteristic for the following:
Between counties:
ρ
σ
σ σ σ σ
υ
υ υ υ
= + + + ( ) ( ) ( ) ( ) 4 2 4 2 3 2 2 2 2
Between districts within counties:
ρ
σ σ
σ σ σ σ
υ υ
υ υ υ
= + + + + ( ) ( ) ( ) ( ) ( ) 4 2 3 2 4 2 3 2 2 2 2
Between schools within districts:
ρ
σ σ
σ σ σ σ
υ υ
υ υ υ
= + + + + ( ) ( ) ( ) ( ) ( ) 3 2 2 2 4 2 3 2 2 2 2
For the logistic function, σ2 π 2
3
= , and subscripts on συ()
2
indicate the level of nesting. This decomposition strategy provides insight into understanding potential solutions to disparities in the qualifications of teachers with special edu-cation credentials. For instance, if much of the variation in qualifications is across districts, then district hiring or recruitment strategies may be more practical, or more atten-tion should focus on district-specific factors (Lankford et al., 2002). However, if much of the variation is among schools within districts, then principals may need to identify school-based incentives to recruit SETs. Our third strategy to exam-ine the distribution of teachers with special education credentials by professional qualifications involved a sum-mary of the percentage of teachers with specific attributes annually over the last 18 years.
To address our third research question, about the extent to which the qualifications of teachers with special education credentials are distributed by school poverty, racial composi-tion, and achievement level, we adopt an approach used by Clotfelter, Ladd, Vigdor, and Wheeler (2006) and Mason-Williams (2015), where each school-level characteristic from the 2014–2015 year is first ranked and divided into quartiles.
For school poverty, Quartile 4 represents high-poverty schools (more than 86% of students qualify free or reduced-price lunch), while Quartile 1 represents low-poverty schools (less than 38% of students qualify). We created similar quartiles for percentage school minority, where Quartile 4 represents high-minority schools (more than 95% of students are minorities) and Quartile 1 equals low-minority schools (less than 56% of students are minorities). Last, for achievement, we used each school’s average academic performance index score from 2011 to 2013 (the most recent score) and created similar quar-tiles. We then compared the proportion of teachers with spe-cial education credentials with each teacher attribute in the first and fourth quartiles of each school characteristic. For instance, we examined the proportion of teachers with a mas-ter’s degree in high- and low-poverty schools using a z test of proportions. Since five teacher characteristics and three school characteristics resulted in 15 statistical tests, we used a con-servative Bonferroni correction (0.05/15 = 0.003) to reduce the likelihood of rejecting the null hypothesis by chance. We reported Cohen’s d for the effect sizes. Our analyses were conducted with Stata 14.0 and “melogit” for the multilevel models.
Results
Research Question 1: Trends in Teachers of Color With Special Education Credentials
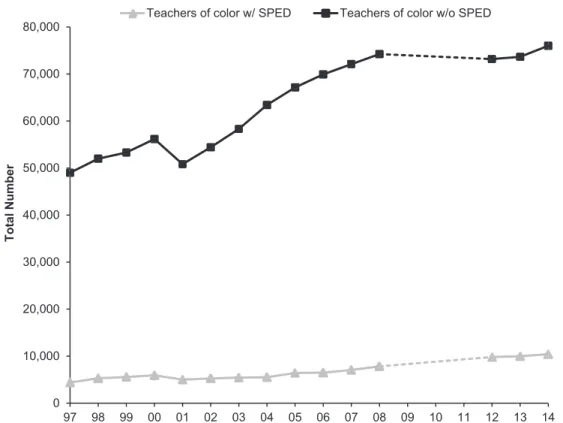
FIGURE 2. A comparison of the total number of teachers of color with and without special education (SPED) credentials from the California Department of Education sample. Data not available for 2009–2011.
FIGURE 3. A comparison of the percentage of teachers of color among teachers with and without special education (SPED) credentials
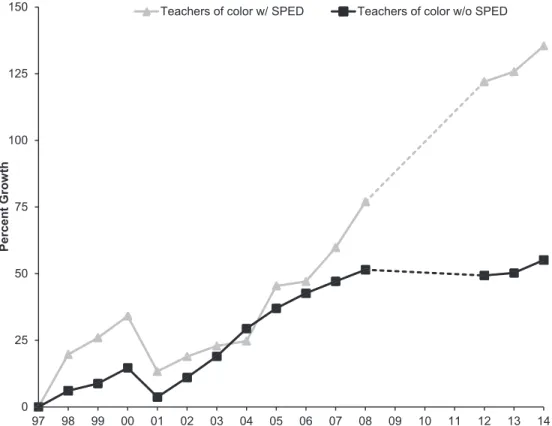
FIGURE 4. A comparison of the percentage growth in teachers of color among teachers with and without special education (SPED) credentials from the California Department of Education. Data not available for 2009–2011.
FIGURE 5. A comparison of growth rate of teachers of color with special education (SPED) credentials and students of color in SPED,
Diversity and Equity in Special Education
27% since 2002–2003, compared with 98% for teachers of color in special education. Thus, although currently less than one third of teachers with special education credentials are teachers of color, the state has seen large growth in the diver-sity of the SET workforce, which has outpaced changes in general education teachers (i.e., those without special educa-tion credentials) and students of color in special educaeduca-tion.
Research Question 2: Distribution of Teachers With Special Education Credentials
Uneven distribution. In Table 1, we present the 10th, 50th,
and 90th percentiles for measures of SET qualifications and characteristics across all districts in the state. The results show that the qualifications of teachers with special education cre-dentials are unevenly distributed across districts. For instance, some districts employed no teachers with a special education credential who have a master’s degree and none in nontenured positions (10th percentile of all districts). At the upper end are districts where 75% of teachers with a special education cre-dential also held a master’s degree and all were employed in tenured positions (90th percentile of all districts). As a point of comparison, 50% of all teachers with a special education credential in the state had a master’s degree, and 78% were employed in tenured positions. In some districts, nearly 40% were novice teachers with 3 years of experience or less, while other districts had no novice teachers. We see the same pattern for teachers with a special education credential who have mul-tiple subject credentials, but most noticeable is the distribution of teachers by race. At the 90th percentile or above, there are districts where nearly half the teachers with a special educa-tion credential are teachers of color, compared with only 14% of teachers in districts at or below the median. Because district
size may skew the number of teachers with a special educa-tion credential, we also present results limited to larger dis-tricts that are above the median in total student enrollment (see bottom half of Table 1). The results show less extreme but similar patterns of districts employing teachers with spe-cial education credentials who have fewer qualifications as compared with other districts.
Variance decomposition. In Table 2, we present the
decom-position of the variation in teacher characteristics of those with special education credentials by school, district, and county, using intraclass correlations. Although the variation in teacher characteristics was relatively low at the different levels of clustering, the results indicate that a larger percent-age of the variation in teacher characteristics was among districts within counties. For instance, we found that about 21% of the variation in teachers’ education level was among districts within counties; 18% was among counties; and 5% was among schools within districts. The level of sorting across districts within counties suggests that district prac-tices may affect where teachers work. The pattern is fairly consistent for the other teacher characteristics, except whether the teacher is a racial minority. In the last row, we see that the variation in the racial background of teachers with special education credentials is either among counties (45%) or among districts within counties (50%). This sug-gests that the distribution of teachers of color with special education credentials appears related to geography rather than differences across schools.
Changes in the distribution of SET attributes over time. In
Figure 6, we summarize the percentage of teachers with spe-cial education credentials for three teacher attributes at the state level for each available year. The results indicate that the percentage of teachers with special education credentials in tenured positions fluctuated from 60% to 75% over the last 18 years. The percentage with master’s degrees or higher dropped from 55% to 46% from 1997 to 2001 but remained fairly consistent since then. In contrast, the percentage of novice teachers with special education credentials each year is low, ranging from 12% to 16% during that period. Overall, Figure 6 suggests little change in these professional charac-teristics, except that more teachers with special education credentials hold tenured positions.
Research Question 3: Sorting Teachers With Special Education Credentials by School Characteristics
To better understand the sorting of teachers with special education credentials, we examined the extent to which the qualifications of these teachers are sorted with respect to the economic, racial, and achievement levels of students within schools. In Table 3, we divide these teachers according to whether they taught in high- or low-poverty schools, high- or low-minority schools, and high- or low-achievement schools TABLE 1
Characteristics of Teachers With Special Education Credentials in 2014–2015
Percentile
10th Median 90th Overalla
All districts (n = 868)
Master’s or higher 0.000 0.442 0.750 0.504
Novice teacher 0.000 0.131 0.400 0.140
Tenured position 0.143 0.750 1.000 0.781
Credentials, ≥2 0.318 0.565 1.000 0.514
Minority 0.000 0.138 0.500 0.291
Largest districts (n = 438)
Master’s or higher 0.250 0.477 0.718 0.512
Novice teacher 0.054 0.143 0.313 0.137
Tenured position 0.542 0.765 0.923 0.791
Credentials, ≥2 0.375 0.530 0.714 0.510
Minority 0.056 0.217 0.474 0.303
Note. Values presented as proportions.
based on the upper and lower quartiles of each student charac-teristic at the school level. We then present the proportion of teachers with special education credentials with a given attri-bute for each school type. The results show that teachers in high-poverty schools were less likely to have a master’s degree or hold multiple teaching subject credentials than those in low-poverty schools. The differences are statistically sig-nificant but with small effect sizes (d = 0.06–0.09). One nota-ble finding is that teachers of color with special education credentials were much more likely to teach in high-poverty (42%) than low-poverty schools (18%; d = 0.54). In high-minority schools, teachers with special education credentials were less likely to have a master’s degree (48% vs. 50%) and possess multiple teaching credentials (57% vs. 47%) than in low-minority schools. We also see that teachers of color with special education credentials were more likely to teach in high-minority schools (43% vs. 12%). In our last panel, we found similar results in that teachers with special education credentials in low-achieving schools were less likely to have master’s degrees (48% vs. 56%) and hold multiple credentials (47% vs. 54%) than those working in high-achieving schools. The last row indicates that teachers of color with special edu-cation credentials were more likely to teach in low- than high-achieving schools (37% vs. 19%).
Discussion
Shortages in the supply of teachers have been well docu-mented in the United States, but few studies have examined diversity within the SET workforce and the distribution of SETs. Unlike previous studies, ours examined trends in the composition and unequal sorting of all teachers with special education credentials in California. We extended the litera-ture by describing trends at the school and district levels and how teachers are distributed in terms of school poverty, racial composition, and achievement level.
Diversity in SETs
Cultural and racial diversity within the SET workforce is important given demographic changes in the school popula-tion and the persistent racial disparities in special educapopula-tion enrollment (Tyler et al., 2004). Our results indicate that while the percentage of teachers of color with special educa-tion credentials (29%) is still much lower than the minority special education student population (74%), this gap is a reflection of the concurrent decrease in the number of White special education students and increase in minority special education students, rather than a failure to increase teachers of color in special education. Indeed, the number of teachers of color with special education credentials has nearly dou-bled from 2002 to 2014, compared with 27% for the minor-ity special education student population. These findings indicate a workforce that is becoming more racially diverse in California, and they show signs of approximating the need for more minority adult role models and teachers who under-stand the cultural perspectives of students in general and special education (Artiles et al., 2002). The growing diver-sity in the California SET workforce also mirrors national trends for all teachers. Using the School and Staffing Survey, Ingersoll, Merill, and Stuckey (2014) found that the total number of minority teachers in the country doubled from 1987 to 2007. Overall, the results indicate that the push toward diversifying the SET workforce has improved.
Distribution of Teachers
In addition to concerns about the diversity of teachers, a related challenge for students is access to qualified SETs. We found wide disparities across districts in terms of the profes-sional backgrounds of teachers with special education cre-dentials in the state. A number of districts, for instance, had no teachers with a master’s degree, while others had gener-ally novice teachers. Although few studies focus on SET qualifications, research on the distribution of general educa-tion teacher quality indicates similar disparities across schools (e.g., Clotfelter et al., 2005). When examining how teachers with special education credentials were distributed across schools, districts, and counties, we found that much of the variability in teacher quality is among districts within counties. This contrasts with Lankford and colleagues’ (2002) study of all teachers in New York State, which showed that much of the variability in teacher quality is among schools within districts. One possible reason for the discrepancy is that the current study is based on the 58 regional counties in California as the highest unit of analysis, which is conceptu-ally different from the eight regional labor markets that Lankford et al. used in New York State. Thus, our results may be more generalizable to other studies that examine geo-graphic county regions. Our main findings suggest that dis-trict policies, such as hiring practices and salaries, are likely a more important factor than school-specific conditions in the TABLE 2
Variance Decomposition of Select Qualifications and
Characteristics of Teachers With Special Education Credentials in 2014–2015
Characteristics
Among counties
Among districts within
counties
Among schools within
districts
Master degree or higher
0.183 0.212 0.052
Novice teacher, ≤3 years
0.014 0.092 0.143
Tenured 0.066 0.184 0.162
Credentials, ≥2 0.078 0.093 0.059
Minority 0.458 0.497 0.046
sorting or preferences of teachers with special education cre-dentials. Another key finding is that minority teachers were more likely to be distributed by counties and districts within counties, rather than schools. This indicates that geography may play a more influential role in the employment prefer-ences of minority teachers who are in special education.
Sorting of Teachers by Schools
In our last analyses, we examined the extent to which dis-advantaged schools may have less access to quality SETs. In general, schools characterized by high poverty, high minor-ity, and low student achievement tended to employ teachers
with special education credentials who have fewer other pro-fessional qualifications, which is consistent with other stud-ies (e.g., Lankford et al., 2002; Mason-Williams, 2015). One new finding in this study is that teachers of color with special education credentials overwhelmingly taught in schools serv-ing high-poverty and high-minority student populations with low average achievement. Given the challenges that these schools face in recruiting teachers in general (Allensworth, Ponisciak, & Mazzeo, 2009), the findings suggest that nation-wide efforts to recruit SETs of color in hard-to-staff schools have been successful and that the characteristics of schools appear influential in minority SETs’ employment decisions. Combined with our earlier finding about the overall increase
FIGURE 6. A comparison of select special education teacher attributes from 1997 to 2014 from the California Department of
Education. Data not available for 2009–2011.
TABLE 3
Comparison of Qualifications and Characteristics of Teachers With Special Education Credentials by School Composition in 2014–2015
Poverty Minority API
Characteristics Low High d Low High d Low High d
Master’s or higher 0.542 0.496 0.093 0.504 0.484 0.040 0.476 0.561 −0.171
Novice teacher 0.147 0.132 −0.034 0.167 0.147 −0.053 0.123 0.142 −0.044
Tenured position 0.789 0.780 0.021 0.751 0.752 −0.003 0.773 0.799 −0.063
Credentials, ≥2 0.538 0.508 0.060 0.569 0.473 0.192 0.470 0.544 −0.148
Minority 0.181 0.420 −0.540 0.125 0.434 −0.750 0.374 0.194 0.406
Cooc and Yang
in teachers of color, these trends are promising for not only diversifying the field but also addressing schools in need. These trends also reflect a larger pattern of diversity across all public school teachers. Ingersol and May (2011) found that, nationally, 50% of teachers of color taught in high-pov-erty schools, compared with 20% of White teachers. One important caveat is that this pattern of teachers of color with special education credentials teaching in high-poverty and high-minority schools may also be indicative of systemic racial issues in the hiring process of minority teachers. That is, it may be more difficult for teachers of color to obtain jobs in low-minority schools due to biases in school or district policies.
Limitations
This study contains several limitations related to the data source. Primarily, the California staffing data limited our identification of SETs to whether a teacher possessed a cre-dential in special education. Previous national studies, how-ever, identified SETs based on whether a teacher’s main assignment was in special education, which is a more accu-rate assessment of the current supply of SETs. Since our definition of SETs includes teachers who possess a special education credential but may not necessarily be teaching special education at the time, our estimates should be inter-preted as the total number of teachers qualified to teach spe-cial education in a given year. State databases are needed that can link teacher histories and main teaching assign-ments. While the number of teachers identified here is likely higher than the actual number of SETs working in special education positions, the majority of teachers with special education credentials do appear to teach special education, according to other data sets (Bureau of Labor Statistics, n.d.; School & Staffing Survey, 2011).
Our analysis of SET quality was also limited by the avail-able variavail-ables in the data set. Studies examining teacher edu-cation levels have included measures of whether a teacher graduated from a competitive college and degree major (e.g., Lankford et al., 2002), which were not available in our California data set. Test scores on state teaching exams and subject-specific assessments are potential indicators of apti-tude and teacher quality. The extent that SETs may be sorted by these measures of aptitude and achievement across schools or districts is unclear. Although we used similar measures of teacher quality as other studies, research indi-cates that common qualifications (e.g., degrees) are weak predictors of student achievement (Feng & Sass, 2013). We were unable to use more direct measures of teacher quality related to instruction and pedagogy or value-added models linked to student test scores. In addition, the data set did not contain information on teacher salary and other work condi-tions, which likely influence school choice and attrition for SETs and those with special education credentials (Fall &
Billingsley, 2011). Given that teacher salary is probably cor-related with teaching experience, the distribution of teachers with special education credentials by salary may be reflected in the results.
Another limitation of the study is that the data could not be linked at the individual level across years. This prevented an analysis of trends related to attrition and turnover (e.g., Billingsley, 2004), such as the number of teachers in California who remained at their school from year to year. For policies aimed at recruitment and retention, it is critical to know whether teachers leave a school but remain in the district or leave the profession all together. Analyzing attri-tion and turnover is especially important for SETs of color, who are also more likely to leave the profession within the first three years (Ingersoll & May, 2011). Longitudinal data are needed to examine how these employment trajectories of SETs may change over time.
Last, this study focuses on the supply of teachers with special education credentials in a state that is unique in its student and teacher demographics. However, the generaliz-ability of the findings is relevant to other highly populated states, such as New York and Texas, where minority students make up nearly half of the school population and teachers in general remain majority White (Aud et al., 2011). The results are also pertinent to states and communities that have in recent years experienced increases in terms of overall popu-lation and racial diversity (Teixeria et al., 2015) and may encounter similar challenges with staffing special education positions or providing special education students with quali-fied teachers.
Implications for Policy and Future Research
Diversity and Equity in Special Education
and have been effective in recruiting teachers of color and men (Sindelar et al., 2012). SETs from these programs also tend to remain in special education longer than those from traditional programs, which can help develop a more stable and experienced workforce (Sindelar et al., 2012). In short, developing ways to improve alternative programs should be considered a part of larger efforts to address the distribution and quality of SETs.
Changes to policies will depend on other areas for future research. First, as the supply of SETs becomes more racially diverse, an important question is how this trend may affect students with disabilities. One rationale for a more diverse SET workforce is the assumption that cultural mismatch between teachers and students in terms of teaching and learning styles is a contributing factor to current racial dis-parities in special education (Artiles et al., 2002). Thus, future research on whether racial disparities continue to per-sist in districts or communities with a more diverse SET population is important for policy decisions and teacher recruitment. A related question is whether academic achieve-ment for students with disabilities may be affected with a more diverse SET staff due to similar theories about cultural mismatch and support. In terms of cost-effectiveness, dis-trict decisions to increase the diversity in the SET workforce may need to be evaluated in relation to training teachers in culturally responsive teaching.
Another area for research relates to better understanding why teachers of color with special education credentials are selecting schools that serve high-minority student popula-tions. School preferences have implications for not only creating a more diverse SET workforce but also ensuring that this diversity is distributed across schools. While teach-ers of color may have a pteach-ersonal interest in assisting chil-dren from similar cultural backgrounds, research shows that teachers tend to work in schools that are, on average, 15 miles away from the districts in which they graduated (Loeb & Reininger, 2004). If proximity to home is a factor in school preference for SETs of color, then this will likely affect how they are distributed to schools and districts. Furthermore, if few students of color from these communi-ties become SETs, then this will affect both the supply and the distribution (Reininger, 2012). External incentives may be needed to recruit SETs of color from outside the com-munity in these cases. More research is needed to distin-guish geographic preferences from other intrinsic considerations for SETs of color. Future studies should also examine whether current district and school policies may be excluding SETs of color from consideration for recruitment and hiring. As noted earlier, teachers may select schools according to personal preference, but districts and schools also play role in what opportunities are available. More research is needed in disentangling personal preference from structural issues within districts and schools that limit professional choices for SETs of color.
Third, more research should focus on the employment history of SETs of color, particularly early in their careers. Overall, teachers of color are entering teaching at a higher rate than White teachers, but they are also switching schools or leaving the profession altogether at a higher rate. Research shows that teachers’ attrition appears related to the work-place conditions of their schools (Ingersoll & May, 2011). More studies are needed on whether this pattern of turnover is similar for SETs of color or potentially higher, given some of the additional challenges of teaching in special education. Future research should also explore whether the predictors of attrition for general teachers are similar for SETs.
Fourth, to further understand the distribution of SETs, better administrative data are needed that link information on students with disabilities at the individual level to their teachers. This can help address whether students with dis-abilities are more likely than students without disdis-abilities to have access to qualified teachers. Furthermore, this discus-sion of students in special education acknowledges but over-looks the range of disability categories. State databases that link individual-level data to teachers can address whether students with learning disabilities, as compared with stu-dents with speech language impairment, are taught in class-rooms with qualified teachers. Such data can disentangle the influence of student disability, race, and home poverty on the sorting of teachers and help answer what contributes to the variance in teacher qualifications among schools, dis-tricts, and counties found in this study.
Finally, this study documents the extent of teacher sorting, but there is much to learn about why this occurs and for devel-oping effective policy interventions. High-poverty and low-achieving schools are less likely to employ more teachers with special education credentials who have more qualifications, a pattern that is also consistent in general education. In California, studies have found evidence that economic incen-tives can be effective in attracting talented and new teachers to work in hard-to-staff schools and districts (e.g., Strunk & Zeehandelaar, 2011). Whether such policies extend to SETs and can remain viable in the long term without consistent state funding are critical questions for ensuring that all students with disabilities have access to an equitable education. This analysis of teachers in California serves as a reminder that efforts to improve educational outcomes for children with dis-abilities will require researchers and policy makers to address both the composition and distribution of SETs.
Conclusion
Cooc and Yang
increasing diversity within the SET workforce are further influenced by the unequal distribution of qualified SETs. This study provides new insight into changes within the SET workforce in the most populous state in the country over the last 13 years. Despite improvements in increasing the diver-sity of the SET workforce, we show that equity in the distri-bution of teachers with special education credentials remains a problem at multiple institutional levels. The findings pro-vide avenues that policy makers and researchers can explore to ensure that children with disabilities have access to per-haps the most important school-based resource in their edu-cational experience.
Acknowledgments
We would like to thank Inheok Lee and Micheal Sandbank for helpful comments on earlier drafts.
Note
1. We use “teachers of color” and “minority teachers” interchangeably.
References
Allensworth, E., Ponisciak, S., & Mazzeo, C. (2009). The schools teachers leave: Teacher mobility in Chicago Public Schools. Chicago, IL: Consortium on Chicago.
Artiles, A. J., Harry, B., Reschly, D. J., & Chinn, P. C. (2002). Over-identification of students of color in special education: A critical overview. Multicultural Perspectives, 4(1), 3–10. http:// dx.doi.org/10.1207/S15327892MCP0401_2
Aud, S., Hussar, W., Kena, G., Bianco, K., Frohlich, L., Kemp,
J., . . . Tahan, K. (2011). The conditions of education 2011
(Report No. 2011-033). Washington, DC: National Center for Education Statistics.
Billingsley, B. S. (2004). Special education teacher retention and attrition: A critical analysis of the research literature. The Journal of Special Education, 38(1), 39–55. http://dx.doi.org/1 0.1177/00224669040380010401
Boe, E. E. (2006). Long-term trends in the national demand, sup-ply, and shortage of education teachers. The Journal of Special Education, 40, 138–150. http://dx.doi.org/10.1177/002246690 60400030201
Boe, E. E., deBettencourt, L. U., Dewey, J., Rosenberg, M., Sindelar, P., & Leko, C. (2013). Variability in demand for spe-cial education teachers: Indicators, explanations, and impact.
Exceptionality: A Special Education Journal, 21, 103–125. http://dx.doi.org/10.1080/09362835.2013.771563
Bureau of Labor Statistics. (n.d.). Occupational employment statis-tics for special education teachers. Retrieved from http://www. bls.gov/ooh/education-training-and-library/special-education-teachers.htm#tab-7
California Department of Education. (n.d.). Data quest. Retrieved from http://data1.cde.ca.gov/dataquest/
Campbell-Whatley, G. D. (2003). Recruiting and retaining of cul-turally and linguistically diverse groups in special education.
Teacher Education and Special Education, 26(4), 255–263. http://dx.doi.org/10.1177/088840640302600402
Chetty, R., Friedman, J. N., & Rockoff, J. E. (2014). Measuring the impacts of teachers II: Teacher value-added and student
outcomes in adulthood. American Economic Review, 104(9),
2633–2679. http://dx.doi.org/10.3386/w19424
Clotfelter, C. T., Glennie, E. J., Ladd, H. F., & Vigdor, J. L. (2008). Teacher bonuses and teacher retention in low-performing schools: Evidence from the North Carolina $1,800 teacher bonus program. Public Finance Review, 36(1), 63–87. http:// dx.doi.org/10.1177/1091142106291662
Clotfelter, C. T., Ladd, H. F., & Vigdor, J. (2005). Who teaches
who? Race and the distribution of novice teachers. Economics
of Education Review, 24, 377–392. http://dx.doi.org/10.1016/j. econedurev.2004.06.008
Clotfelter, C. T., Ladd, H. F., Vigdor, J. L., & Wheeler, J. (2006).
High-poverty schools and the distribution of teachers and principals. Retrieved from http://www.caldercenter.org/ PDF/100157_High_Poverty.pdf
Dee, T. (2004). Teachers, race, and student achievement in a
randomized experiment. Review of Economics and Statistics,
86(1), 195–210. http://dx.doi.org/10.3386/w8432
Diana vs. State Board of Education, C-70-37 RFP memorandum and order (U.S. District Court, Northern District of California, May 24, 1974)
Egalite, A., Kisida, B., & Winters, M. A. (2015). Representation in the classroom: The effect of own-race teachers on student
achievement. Economics of Education Review, 45, 44–52.
http://dx.doi.org/10.1016/j.econedurev.2015.01.007
Fall, A. M., & Billingsley, B. (2011). Disparities in work condi-tions among early career special educators in high- and low-poverty districts. Remedial and Special Education, 32, 64–78. http://dx.doi.org/10.1177/0741932510361264
Feng, L., & Sass, T. R. (2013). What makes special-education teachers special? Teacher training of students with disabilities.
Economics of Education Review, 36, 122–134. http://dx.doi. org/10.1037/e721902011-001
Grissom, J., & Redding, C. (2016). Discretion and disproportional-ity: Explaining the underrepresentation of high-achieving stu-dents of color in gifted programs. AERA Open, 2, 1–25. http:// dx.doi.org/10.1177/2332858415622175
Hibel, J., Farkas, G., & Morgan, P. L. (2010). Who is placed into special education? Sociology of Education, 83(4), 312–332. Individuals with Disabilities Education Act, Pub. L. No. 108-446,
118 Stat. 2647 (2004).
Ingersoll, R. M., & May, H. (2011). Recruitment, retention and the minority teacher shortage (Research Report No. RR-69). Philadelphia, PA: Consortium for Policy Research in Education. http://dx.doi.org/10.12698/cpre.2011.rr69
Ingersoll, R., Merrill, L., & Stuckey, D. (2014). Seven trends: The transformation of the teaching force. Philadelphia, PA: Consortium for Policy Research in Education. http://dx.doi. org/10.1037/e579212012-001
Ingersoll, R., & Perda, D. (2010). Is the supply of
mathemat-ics and science teachers sufficient? American Educational
Research Journal, 47(3), 563–594. http://dx.doi.org/10.3102/ 0002831210370711
Diversity and Equity in Special Education
Larry P. vs. Riles, No. C-71-2270 RFP (U.S. District Court, Northern District of California, December 12, 1979).
Lipscomb, S. (2009). Students with disabilities and California’s
special education program. San Francisco, CA: Public Policy Institute of California.
Loeb, S., & Reininger, M. (2004). Public policy and teacher labor markets: What we know and why it matters. East Lansing: Michigan State University.
MacMillan, D. L., Hendrick, I. G., & Watkins, A. V. (1988). Impact of Diana, Larry P., and P.L. 94-142 on minority students. Exceptional Children, 54(5), 426–432. doi:10.1177/001440298805400505 Mason-Williams, L. (2015). Unequal opportunities: A
pro-file of the distribution of special education teachers.
Exceptional Children, 81(2), 247–262. http://dx.doi. org/10.1080/09500799109533296
Morgan, P. L., Farkas, G., Hillemeier, M. M., Mattison, R., Maczuga, S., Li, H., & Cook, M. (2015). Minorities are dispro-portionately underrepresented in special education. Educational Researcher, 44(5), 278–292.
National Center for Education Statistics. (n.d.). Digest of educa-tion: Total fall enrollment in degree-granting postsecondary institutions. Washington, DC: Author.
Patton, J. M., Williams, B. T., Floyd, L. O., & Cobb, T. R. (2003). Recruiting and retaining culturally and linguistically diverse teachers in special education: Models for successful personnel preparation. Teacher Education and Special Education, 26(4), 288–303. http://dx.doi.org/10.1177/088840640302600405 Reininger, M. (2012). Hometown disadvantage? It depends on
where you’re from: Teachers’ location preferences. Educational Evaluation and Policy Analysis, 34(2), 127–145. http://dx.doi. org/10.3102/0162373711420864
Rosenberg, M. S., & Sindelar, P. T. (2005). The proliferation of
alternative routes to certification in special education. The
Journal of Special Education, 39, 117–127. http://dx.doi.org/10 .1177/00224669050390020201
Schools and Staffing Survey. (2011). Teacher’s race/ethnicity by
main teaching assignment field using PowerStats. Washington, DC: National Center for Education Statistics.
Sindelar, P. T., Daunic, A. P., & Rennells, M. S. (2004). Comparisons of traditionally and alternatively trained teach-ers. Exceptionality, 12, 209–223. http://dx.doi.org/10.1207/ s15327035ex1204_3
Sindelar, P. T., Dewey, J. F., Rosenberg, M. S., Corbett, N. L., Denslow, D., & Lotfinia, B. (2012). Cost effective-ness of alternative route special education teacher
prepa-ration. Exceptional Children, 79(1), 25–42. doi: 10.1177/
001440291207900102
Skiba, R. J., Artiles, A. J., Kozleksi, E. B., Losen, D. J., & Harry, E. G. (2016). Risks and consequences of oversimplifying educational inequities: A response to Morgan et al. (2015).
Educational Researcher, 45(3), 221–225. doi:10.3102/00131 89X16644606
Snyder, T. D., & Dillow, S. A. (2015). Digest of education sta-tistics 2013. Washington, DC: U.S. Department of Education. http://dx.doi.org/10.1037/e672832007-016
Sullivan, A. L., Van Norman, E. R., & Klingbeil, D. A. (2014). Exclusionary discipline of students with disabilities. Remedial and Special Education, 35(4), 199–210. http://dx.doi. org/10.1177/0741932513519825
Strunk, K. O., & Zeehandelaar, D. (2011). Differentiated com-pensation: How California use economic incentives to target teachers. Journal of Education Finance, 36(3), 268–293. http:// dx.doi.org/10.1353/jef.2011.0002
Teixeira, R., Frey, W. H., & Griffin, R. (2015). States of change: The demographic evolution of the American electorate, 1974–
2060. Washington, DC: Center for American Progress.
Tyler, N. C., Yzquierdo, Z., Lopez-Reyna, N., & Flippin, S. S. (2004). Cultural and linguistic diversity and the special educa-tion workforce. The Journal of Special Education, 38, 22–38. http://dx.doi.org/10.1177/00224669040380010301
U.S. Department of Education. (n.d.). IDEA Section 618 data
products Retrieved from http://www2.ed.gov/programs/ osepidea/618-data/state-level-data-files/index.html#bp
U.S. Department of Education. (2013). Digest of education
sta-tistics: Table 209.10. Washington, DC: Author. http://dx.doi. org/10.5860/choice.51-5366
U.S. Department of Education. (2014). New accountability
frame-work raises the bar for state special education programs. Washington, DC: Author.
U.S. Department of Education. (2015a). Teacher shortage areas
nationwide listing 1990–1991 through 2015–2016. Washington, DC: Author.
U.S. Department of Education. (2015b). Thirty-seventh annual
report to Congress on the implementation of the Individuals with Disabilities Education Act. Washington, DC: Author. U.S. Department of Education. (2016a). Racial and ethnic
dispari-ties in special education: A multiyear disproportionality analy-sis by state, analyanaly-sis category, and race/ethnicity. Washington, DC: Author.
U.S. Department of Education. (2016b). The state of racial diver-sity in the educator workforce. Washington, DC: Author. Villegas, A. M., & Irvine, J. J. (2010). Diversifying the teaching
force: An examination of major arguments. Urban Review, 42, 175–192. http://dx.doi.org/10.1007/s11256-010-0150-1 Yell, M. L., & Crockett, J. B. (2011). Free appropriate public
edu-cation. In J. M. Kauffman & D. P. Hallahan (Eds.), Handbook of special education (pp. 77–90). New York, NY: Routledge. http://dx.doi.org/10.4324/9780203837306.ch7
Authors
NORTH COOC is an assistant professor of special education at The University of Texas at Austin (1 University Station, Stop 5300, Austin, TX 78712; [email protected]). His research focuses on racial disparities in special education enrollment and the aca-demic trajectories of children with disabilities.