Escola de Veterinária
Colegiado de Pós-Graduação em Zootecnia
EXIGÊNCIA EM PROTEÍNA PARA CORDEIRAS
DESLANADAS EM CRESCIMENTO
Luigi Francis Lima Cavalcanti
Luigi Francis Lima Cavalcanti
Exigência em proteína para cordeiras deslanadas em crescimento
Tese apresentada ao Colegiado do Programa de Pós Graduação em Zootecnia da Escola de Veterinária da Universidade Federal de Minas Gerais, como requisito parcial para obtenção do título de Doutor em Zootecnia
Área de concentração: Nutrição Animal
Orientador: Iran Borges
Co-Orientadores: Ana Luiza C. C. Borges
Lúcio Carlos Gonçalves
Belo Horizonte – Minas Gerais – Brasil
Escola de Veterinária da UFMG
Cavalcanti, Luigi Francis Lima, 1986-
C376e Exigência em proteína para cordeiras deslanadas em crescimento / Luigi Francis Lima Cavalcanti – 2014.
67 p. : il.
Orientador: Iran Borges
Co-orientadores: Ana Luiza C.C. Borges, Lúcio Carlos Gonçalves
Tese (doutorado) –Universidade Federal de Minas Gerais, Escola de Veterinária Inclui bibliografia
1. Cordeiro – Alimentação e rações – Teses. 2. Proteínas na nutrição animal – Teses. 3. Nutrição animal – Teses. 4. Alometria – Teses. I. Borges, Iran. II. Borges, Ana Luiza da Costa Cruz. III. Gonçalves, Lúcio Carlos. IV. Universidade Federal de Minas Gerais. Escola de Veterinária. V. Título.
A conclusão do doutorado foi um passo muito importante na minha carreira e só foi possível graças a uma sucessão de fatos que são consequência da participação de vários personagens na minha vida, e portanto agradeço:
Primeiramente a Deus por ter iluminado todo este caminho;
Àqueles que apoiaram minha pessoa, sem saber ou não se importarem com o que era exigência, ovelha, respirometria ou minha tese... entre eles:
Aos meus Pais Pedro Zanoni e Maria Cleide pelo incentivo e torcida incondicional ao longo desses anos, além do exemplo máximo de dedicação aos filhos e a família;
Aos meus irmãos Analuppe e Yves, que sempre me apoiaram e incentivaram desde quando me faziam encenar peças não tão ortodoxas em nosso quarto, vocês lembram? Eu lembro... rs... Muito obrigado! Lembrem-se que agora tenho sobrinhos e eles irão também brincar muito com o dindo e tio... rs... Beijos Marina, Fernando e Guilherme... Aproveito e agradeço a Letícia e Gustavo, que entraram como as peças que faltavam no nosso núcleo familiar!!
À minha companheira da vida e colega, e que por isso sabia em que eu estava me metendo, Dra. Mariana, que me aguentou ainda que chegasse com o odor sui generis de galpão em sua casa, e que tem sido cúmplice fiel em toda nossa trajetória. Te amo!
À minha família nordestina por entenderem nossa ausência mas apoiarem e nos receberem sempre como toda família deve receber os seus. Amo vocês...
À minha família de amigos vendanovenses, que de fato são amigos e me fazem sentir em casa mesmo estando em seus lares! Em especial meus caros Diógenes, Matheus (e família Correia Diniz), Thiago, Alexandre, Ângelo e Leandro.
Aos amigos da Escola de Veterinária, que de fato deixam um gosto de saudade toda vez que me lembro do campinho, do galpão, do laboratório, D.A. e da boa e velha cantina... Destaco aqui entre muitos, Helena, Túlio, Samuca, Hemilly, Fernando, Joana e Felipe (Doriva)... Valeu pessoal!
Aos que sabiam no que eu estava mexendo:
Professor Iran! Meu prezado orientador, conselheiro, companheiro e amigo. Muito obrigado por estes anos de convivência e agradeço de antemão os futuros. Eu sei que sou um orientando não muito fácil, mas sei também que construímos muito juntos... afinal tenho o orgulho de ter sido fundador e primeiro presidente do NEPPER! E já se vão quase 10 anos! Com o senhor aprendi o quanto é importante ser humano com os colegas e alunos... Vou sentir muita falta das estórias e aulas...
Professora Ana Luiza, muito obrigado pelas várias dicas ao longo do caminho, e por abrir tantas portas, como a do hemisfério norte, ponto crucial na minha trajetória. Serei sempre grato pelas aulas intrigantes que sempre me faziam sair com dez pulgas atrás da orelha.
Professor Lúcio, muito obrigado pelos conselhos pra vida profissional... pelas longas conversas de cantina, onde aprendi muito sobre os meandros do meio universitário e científico. O senhor sempre será lembrado...
Aproveito para agradecer ao convívio com os colegas, hoje amigos, de College Station, com quem tive o prazer de trabalhar e aprender muito... Mozart, valeu pela hospitalidade mineira, e pelos longos papos, você é um grande amigo... Michele e Gilson, vocês me ensinaram muito e me proporcionaram muitas histórias alegres... Paulo, valeu demais, você leu o livro?? Leanne, Harley and Nitin, thank you very much! Gabriella Serra, grazie! Aos demais brasileiros que se aventuraram nos “states” conosco, valeu demais!! Leonardo e Mariana, Bernardo e Victoria, William e Marina, Rodrigo e Samila, Igor, Davi e Clement, meus roomates... muito obrigado!
Aos professores da pós-graduação que tanto me ensinaram neste tempo, em especial ao amigo Fabio Toral, que posso considerar meu co-orientador ao longo do doutorado. Também aos queridos mestres que sempre acompanharam meu dia a dia na escola, Décio, Ronaldo, Ricardo, Leonardo, Baião, Idalmo, Eloísa, Sandra, Edgard, Kleber, José Sérgio, Nelson, Último, Paulo Ricardo, Elias (Lobão), Lívio, Monique, Cláudia, Marcelo, entre outros...
Aos funcionários da escola e do programa em especial Heloisa, Toninho, Sr. Nilson e Roberto.
Por fim, aos co-autores desta tese:
Ao colega de experimento, Vandenberg, por toda a paciência e humildade ao longo destes anos. Fizemos um bom trabalho!
Aos contemporâneos de pós-graduação: Fredson, Hemilly, Luciana, Alexandre Araújo, Hélio, Leonardo, Pedro, Fernando, Alexandre Lima entre outros...
Aos alunos de iniciação e estagiários: Isabela Maciel, Isabella Melo, Felipe Santos, Dalvana, Diogo, Rafael, Marília, Emmanuel, Fabiane, Luiza, Ana Faiha e Gustavo. Vocês foram essenciais para este projeto e me orgulho por terem se sentido parte dele! Valeu!!!!
Dedico essa tese à minha família, aos mestres,
“Doutores” ou não, que me guiaram nesse trajeto e
O Rei dos Animais
Saiu o leão a fazer sua pesquisa estatística, para verificar se ainda era o Rei das Selvas. Os tempos tinham mudado muito, as condições do progresso alterado a psicologia e os métodos de combate das feras, as relações de respeito entre os animais já não eram as mesmas, de modo que seria bom indagar. Não que restasse ao Leão qualquer dúvida quanto à sua realeza. Mas assegurar-se é uma das constantes do espírito humano, e, por extensão, do espírito animal. Ouvir da boca dos outros a consagração do nosso valor, saber o sabido, quando ele nos é favorável, eis um prazer dos deuses. Assim o Leão encontrou o Macaco e perguntou: "Hei, você aí, macaco - quem é o rei dos animais?" O Macaco, surpreendido pelo rugir indagatório, deu um salto de pavor e, quando respondeu, já estava no mais alto galho da mais alta árvore da floresta: "Claro que é você, Leão, claro que é você!".
Satisfeito, o Leão continuou pela floresta e perguntou ao papagaio: "Currupaco, papagaio. Quem é, segundo seu conceito, o Senhor da Floresta, não é o Leão?" E como aos papagaios não é dado o dom de improvisar, mas apenas o de repetir, lá repetiu o papagaio: "Currupaco... não é o Leão? Não é o Leão? Currupaco, não é o Leão?".
Cheio de si, prosseguiu o Leão pela floresta em busca de novas afirmações de sua personalidade. Encontrou a coruja e perguntou: "Coruja, não sou eu o maioral da mata?" "Sim, és tu", disse a coruja. Mas disse de sábia, não de crente. E lá se foi o Leão, mais firme no passo, mais alto de cabeça. Encontrou o tigre. "Tigre, - disse em voz de estentor -eu sou o rei da floresta. Certo?" O tigre rugiu, hesitou, tentou não responder, mas sentiu o barulho do olhar do Leão fixo em si, e disse, rugindo contrafeito: "Sim". E rugiu ainda mais mal humorado e já arrependido, quando o leão se afastou.
Três quilômetros adiante, numa grande clareira, o Leão encontrou o elefante. Perguntou: "Elefante, quem manda na floresta, quem é Rei, Imperador, Presidente da República, dono e senhor de árvores e de seres, dentro da mata?" O elefante pegou-o pela tromba, deu três voltas com ele pelo ar, atirou-o contra o tronco de uma árvore e desapareceu floresta adentro. O Leão caiu no chão, tonto e ensangüentado, levantou-se lambendo uma das patas, e murmurou: "Que diabo, só porque não sabia a resposta não era preciso ficar tão zangado".
MORAL: CADA UM TIRA DOS ACONTECIMENTOS A CONCLUSÃO QUE BEM ENTENDE.
Resumo Geral ... 10
Abstract ... 11
Introdução Geral ... 11
Literature review ... 13
Chapter 1 - Body composition and net protein requirement for weight gain of Brazilian hair ewe lambs and evaluation of international nutritional models ... 17
ABSTRACT: ... 18
1. Introduction ... 19
2. Material and Methods ... 20
2.1. Location, animals and experimental design ... 20
2.2. Feeds, diet chemical composition and digestibility trial ... 21
Table 1 ... 21
2.3. Slaughter procedure and body composition analyses ... 22
2.4. Calculations ... 23
2.5. Models evaluation ... 24
2.6. Statistical analyses ... 25
3. Results and discussion ... 26
3.1. Animals performance and diet digestibility ... 26
Table 2 ... 27
Table 3 ... 29
3.2. Empty body weight composition ... 30
Table 4 ... 31
Figure 1 ... 32
Table 5 ... 33
3.3. Models evaluation ... 33
Table 6 ... 34
Figure 2 ... 35
4. Conclusion ... 35
5. Conflict of interest ... 35
6. Acknowledgements ... 35
Chapter 2 - Evaluation of nutritional plane and slaughter weight effect on carcass characteristics and multivariate allometric growth of Brazilian hair ewe lambs ... 36
ABSTRACT:... 37
1. Introduction ... 38
2. Material and Methods ... 39
2.1. Location, animals and experimental design ... 39
2.2. Feeds and diet chemical composition ... 40
3. Results ... 44
3.1. Body weight, carcass traits ... 44
Table 2 ... 45
3.2. Carcass composition and fat depots ... 46
Figure 2 ... 47
Table 3 ... 48
3.3. Allometric growth ... 49
Table 4 ... 49
4. Discussion ... 50
Figure 3 ... 53
Figure 4 ... 55
5. Conclusion ... 55
6. Conflict of interest ... 56
7. Acknowledgements ... 56
Thesis References ... 57
Appendix A ... 64
PRC.inf –Principal components’s inferences ... 64
Description ... 64
Usage ... 64
Default ... 64
Arguments ... 64
Function ... 64
Essa tese é composta por dois estudos. O primeiro trabalho objetivou determinar as exigências
líquidas de proteína (NPg) para cordeiras Santa Inês em crescimento, e secundariamente avaliar
as predições de cinco sistemas nutricionais. Cinquenta e sete cordeiras foram abatidas seguindo
os procedimentos comuns a técnica de abate comparativo, sendo 21 abatidas no início do
experimento e as demais divididas em um delineamento inteiramente ao acaso, em arranjo
fatorial 2 x 3 (dois regimes alimentares, ad libitum e restrito, e três pesos ao abate, 20, 28 ou
36 kg, seis animais por grupo). A composição corporal dos animais foi obtida, e o teor e massa
dos nutrientes foram modeladas utilizando as funções matemáticas de Huxley e von
Bertalanffy. Paralelamente, as predições para NPg dos sistemas AFRC (1993), CSIRO (2007),
NRC (1985), NRC (2007) e SRNS (2010) foram avaliadas. As assíntotas estimadas pelas
funções ajustadas de von Bertalanffy apresentaram valores razoáveis. A estimativa da NPg
conforme a função de Huxley foi 12,5 g/100 g de peso de corpo vazio em animais com 30 kg.
A avaliação dos sistemas revelou que os modelos nutricionais tendem a subestimar a NPg de
cordeiras Santa Inês. O sistema SRNS apresentou a melhor acurácia para estimativa do NPg
(CCC = 0.948, r = 0.985 , Cb = 0.963, RMSEP = 1.80 g). O segundo trabalho objetivou avaliar
os efeitos do peso ao abate e do manejo nutricional sobre a carcaça e desenvolvimento corporal
de cordeiras Santa Inês. Foram utilizados os mesmos animais do estudo anterior. Modelos
lineares foram ajustado para acessar o efeito nutricional e do peso ao abate sobre as variáveis
quantitativas. Um estudo alométrico multivariado foi realizado para visualização da relação
entre partes corporais associadas ao efeito nutricional durante o crescimento. Concomitante ao
crescimento do peso ao abate, a condição corporal, gordura subcutânea e intracavitária, peso
de carcaça fria e cortes também aumentaram. O plano nutricional influenciou o peso de carcaça
quente e fria (P ≤ 0,002), assim como o peso da perna, paleta, costelas/flanco e pescoço, que
apresentaram menores pesos para animais sob restrição (P < 0,05). O estudo alométrico revelou
que os componentes corporais crescem em diferentes taxas e que o plano nutricional afeta
alguma delas, como a costela/flanco. Ademais, o desenvolvimento dos depósitos adiposos no
corpo não se dá de forma isométrica, e um plano nutricional alto pode direcionar a energia
ingerida para gordura visceral ao invés da carcaça. Animais sob restrição apresentaram um
melhor equilíbrio na distribuição da gordura corporal, o que indica que as exigências
nutricionais recomendadas por sistemas nutricionais em voga podem superestimar as
verdadeiras exigências de ovinos brasileiros, e possivelmente reduzem a eficiência de sistemas
produtivos.
This thesis was composed of two studies. The first work was conducted to determine the net
protein requirements for gain (NPg) of Santa Inês female lambs, and secondarily, evaluate five
feed systems predictions for this characteristic. Fifty-seven female lambs were slaughtered
following common procedures of comparative slaughter technique, being twenty-one
slaughtered at the beginning of trial and the remaining animals were assigned in a completely
randomized design with a 2 x 3 factorial arrangement (two nutritional planes, ad libitum or
restricted, versus, three slaughter weights, 20, 28 or 36 kg, six animals per group). Animals’
body composition was assessed, and nutrients percentage and amount were modelled by means of Huxley’s and von Bertalanffy’s mathematical functions. Besides, the predictions from AFRC (1993), CSIRO (2007), NRC (1985), NRC (2007) and SRNS (2010) were evaluated.
The estimated asymptotes from fitted von Bertalanffy function were in a reasonable value for the evaluated animals. The net protein requirements derived from Huxley’s function resulted in an average NPg of 12.5 g/100 g o EBW gain in animals with 30 kg of shrunk BW. The
models evaluation showed that Santa Inês female lambs present a higher NPg compared to the
feed systems predictions. Moreover, the SRNS (2010) presented the best accuracy for NPg
estimative (CCC = 0.948, r = 0.985 , Cb = 0.963, RMSEP = 1.80 g). The second study aimed
to evaluate the effect of slaughter weight and feeding management on carcass and body
development of Santa Inês female lambs. The same animals from first study were used. Linear
models were fit to assess nutritional and slaughter weight effects on body traits, carcass yields
and composition. Also, a multivariate allometric study was performed to visualize the
relationship between body parts associated to nutritional regimen during growth. Concurrent
with an increase of slaughter weight body condition score, fat thickness, visceral fat depots,
cold carcass weight, cuts and carcass composition also increased. Nutritional plane influenced
hot and cold carcass weights (P ≤ 0.002), as well as hindlimb, blade, rib/flank and neck, which
presented lower weights for restricted animals compared to ad libitum ones (P < 0.05). The
allometric study revealed that body parts grow in different rates and nutritional plane influences
some parts such as ribs/flank. Moreover, fat distribution among depots is not isometric, and a
higher nutritional regimen may drive the energy intake to visceral fat rather than to carcass.
Restricted animals presented a better balance on fat distribution, what indicates that common
nutritional systems may overestimate nutrient demands for Brazilian sheep and possibly reduce
livestock system efficiency.
Introdução Geral
A caprino-ovinocultura brasileira representa uma atividade pecuária de grande
relevância por garantir segurança alimentar a pequenos produtores e ainda poder gerar lucro a
empreendimentos agrários, principalmente em regiões pressionadas por desafios
edafoclimáticos (e.g., semi-árido, aclives) que impossibilitam o sucesso de outras atividades.
Por outro lado, esse setor carece de desenvolvimento de tecnologia apropriada e também de
treinamento de recursos humanos capazes de tornar tais sistemas o mais eficiente possível.
Neste cenário, a ciência animal brasileira tem se dedicado a definir critérios e técnicas
que possam ser aplicadas de forma mais acurada aos sistemas de criação de pequenos
ruminantes em voga no país, bem como avaliar se estes sistemas são de fato os mais adequados.
Ainda que a aplicação de tecnologias estrangeiras, oriundas de países com mais tradição na
criação de pequenos ruminantes, possam trazer vantagens, a adaptação de tais técnicas bem
como o desenvolvimento de ferramentas customizadas devem ser o foco da pesquisa brasileira.
Essa tese apresenta dois trabalhos que buscam entender melhor como se expressam as
exigências proteicas de cordeiras Santa Inês, e ainda frente ao atendimento desses requisitos,
como se dá o desempenho desses animais.
O primeiro capítulo intitulado “Body composition and net protein requirement for weight gain of Brazilian hair ewe lambs and evaluation of international nutritional models” apresenta o resultado da exigência proteica para ganho em cordeiras deslanadas estimado a
partir do abate de 57 animais do genótipo Santa Inês, com peso de abate entre 20 e 37 kg.
Ademais, o trabalho avalia a aplicabilidade de modelos de crescimento para modelagem da
participação de nutrientes no peso de corpo vazio desses animais, e ainda, avalia a acurácia e
precisão de cinco modelos nutricionais para predição da exigência proteica para ganho baseado
nos dados obtidos pelo trabalho.
O segundo capítulo dessa tese apresenta os resultados relativos ao desempenho dos
animais que foram submetidos a dois planos nutricionais, ad libitum ou restrito, em função do
experimento de exigência nutricional. Neste trabalho foram avaliados os rendimentos cárneos
bem como a distribuição de depósitos adiposos. Para esta segunda hipótese, foi realizado um
estudo multivariado de alometria ontogênica, onde componentes principais foram estimados a
partir da matriz de covariância dos resultados obtidos para as partes em estudo. O estudo
multivariado permite de forma concisa avaliar-se não só a relação de partes com o todo (e.g.,
efeito dos planos nutricionais sobre os parâmetros alométricos, uma abordagem bootstrapp foi
desenvolvida a fim de criarem-se intervalos de confiança para os coeficientes estimados, e
dessa forma testa-se a hipótese de igualdade do grupo de animais alimentados à vontade e
Literature review
The first studies on protein requirements for cattle were must likely conducted in the
first decades of the 20th century. Those experiments were based on feed trials, therefore any protein recommendations were supported by cattle productive response when fed with feeds
with known quantity of nitrogen, (i.e., protein) (Tedeschi et al., 2013). Later, with additional
studies, the Subcommitte on Animal Nutrition, chaired by Dr. Mitchell in 1926 provided a
detailed report with enough evidence that the protein composition, what means, different amino
acids proportions, would influence protein digestibility and use (Mitchell, 1926). Therein, in
1929, the first guidelines for minimum protein requirements for cattle, based on a factorial
approach, were outlined (Mitchell, 1929).
These first evidences of different protein demands and feed composition started a long
research field on protein requirements and use by ruminants. This history was described in
details by Tedeschi et al. (2013). Moreover, it is interesting to understand that researchers all
around the globe started to investigate this theme, and however they presented some
discrepancies between protein requirements for different species, production stages and
regions, they all tended to share the same factorial approach. An effort to represent the intricate
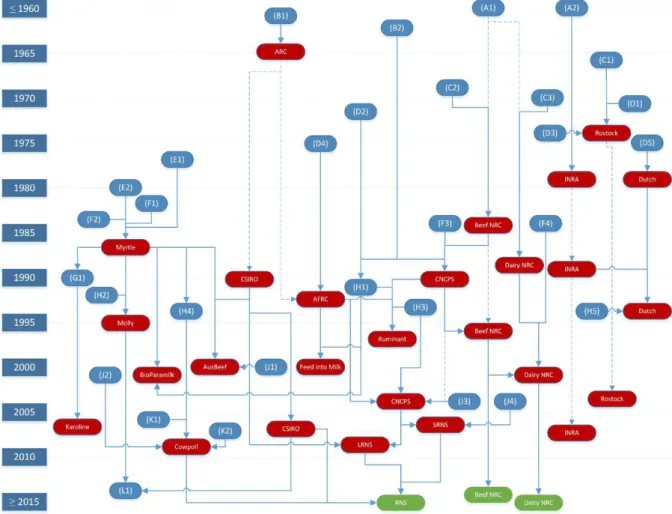
relationship between research centers investigating nutrient requirements is depicted in Figure
1 (Tedeschi et al., 2014).
From figure 1 is possible to understand that some studies had a major impact over
nutrition models development, such as the classical papers of Blaxter (1962), NRC (1945a,
1945b), and Baldwin et al. (1977), which provided the fundamental basis for the development
of British, and North American models, respectively. It is also possible to realize that, in the
beginning of 21st century, the presence of horizontal lines become more frequent, what indicates a more intense exchange of information between models, and systems like LRNS
(i.e., Large Ruminant Nutrition System) arrived. This exchange of information may be improve model’s prediction quality, since most likely will expand its use in different conditions. Such hypothesis was tested by Tedeschi et al. (2014) that evaluated different models using an
independent dataset with information regarding milk production all around the world. In this
Figure 1. Chronological evolution of mathematical nutrition models (red boxes) and key references (blue boxes). Year of publication or release is shown on the left. The green boxes represent models not yet released to the public. The solid line represents a direct relationship of influence, and the dashed line represents that at least one other version or edition was released in between the marks. References are: (A1) NRC(1945a, 1945b), (A2) Leroy (1954), (B1) Blaxter (1962), (B2) Van Soest (1963a, 1963b), (C1) Nehring et al. (1966), (C2) Lofgreen and Garrett (1968), (C3) Moe et al. (1970), (D1) Schiemann et al. (1971), (D2) Waldo et al. (1972), (D3) Hoffmann
et al. (1974), (D4) Ministry of Agriculture, Fisheries and Food (1975), (D5) Van Es (1975), (E1) Baldwin et al.
(1977), (E2) Baldwin et al. (1980), (F1) France et al. (1982), (F2) Gill et al. (1984), (F3) Fox and Black (1984), (F4) Conrad et al. (1984), (G1) Danfær (1990), (H1) Illius and Gordon (1991), (H2) France et al. (1992), (H3) Russell et al. (1992), Sniffen et al. (1992), and Fox et al. (1992), (H4) Dijkstra et al. (1992), Neal et al. (1992),and Dijkstra (1993), (H5) Tamminga et al. (1994), (J1) Nagorcka et al. (2000), (J2) Mills et al. (2001), (J3) Fox et al. (2004), (J4) Cannas et al. (2004),(K1) Bannink et al. (2006), (K2) Bannink et al. (2008), and (L1) Gregorini et
al. (2013). RNS is the Ruminant Nutrition System. Adapted from (Tedeschi et al., 2014).
With small ruminants, this scenario is quite similar, and most of traditional
nutritional systems adopted the same approach used by cattle researchers. One clear example
of this fact is the evolution of Small Ruminant Nutrition System - SRNS (Tedeschi et al., 2010),
which was first denominated as “The Cornell Net Carbohydrate and Protein System for Sheep,
CNCPS-S” (Cannas et al., 2004), obviously, an allusion to the cattle nutritional system
developed by Dr. Danny Fox and colleagues, CNCPS (Fox et al., 2004). In the same way, the
Research Organisation, CSIRO (2007), presented only different values for equations’
coefficients used for all species in their compendium.
Nevertheless, this scientific field is far from an ending. Not just because some gaps still
exist about protein metabolism, but because nowadays a new concern about protein usage has
arrived, being the dietary nitrogen use efficiency the main subject, since its excretion in the
environment contributes to the greenhouse effect (Koenig and Beauchemin, 2013; Waldrip et
al., 2013) by increasing nitrous oxide production (Eckard et al., 2010).
In Brazil, there are few researchers in the field of nutrient requirements for ruminants.
For cattle, the first nutritional Brazilian system was recently released (Valadares Filho et al.,
2006), and was denominated Br-CORTE, with a large database, mainly dedicated to Zebu
cattle. The second revised edition, with more data and crossings, was released four years later
(Valadares Filho et al., 2010). On the other hand, for small ruminants, there is not a Brazilian
system well defined, even though an increasing number of studies were conducted in the last
decade (Resende et al., 2010)and some were published (Galvani et al., 2008; Regadas Filho et
al., 2011a; Regadas Filho et al., 2011b; Regadas Filho et al., 2013).
Brazilian lamb production still incipient, what can be concluded in face of the low
production (84 thousand tons/year) combined to a low per capita consumption (700 g/year),
but in opposition, with a steady importation of meat from neighbors countries, such as Uruguay
and Argentina. Notwithstanding, the Brazilian herd is not as small as its production and
consumption (16.81 million heads; IBGE, 2010), what may indicate a low efficiency of
conversion of animals in products. This condition is partially explained by the low level of
technology applied by producers associated to the type of animals with natural low production,
such as hair sheep.
One of the most common breeds in Brazil is the Santa Inês. This sheep is characterized
by ewes with small to medium frame size, weighing around 50 kg when mature and in medium
body condition score. Most likely, this animal is the result of crossings between Italian
Bergamacia ewes and Brazilian northeastern native sheep, and present a good maternal ability,
rusticity and adaptation to tropical conditions. Moreover, Santa Inês females are less sensitive
to photoperiod, therefore allowing a more flexible window for reproduction. Consequently,
this breed have been explored by Brazilian producers as dams in crossings with meat breeds,
such as Dorper and Texel, where both male and female offspring are directed to slaughter.
technicians tend to associate their empirical experience to international nutritional
recommendations, such as those from North American, Australian, British, and French
committees. (e.g., Institute National de la Recherche Agronomique (1988); Agricultural and
Food Research Council (1993); Commonwealth Scientific and Industrial Research
Organisation (2007); National Research Council (2007)). Because of region discrepancies and
probably because of animal type, those models, although present good accuracy have been
pointed out as imprecise when evaluated with Brazilian sheep (Galvani et al., 2008; Regadas
Filho et al., 2011a). This result is even worse when dealing with hair sheep, such as Santa Inês,
due to its vast heterogeneity of phenotypes.
The knowledge of growth behavior of livestock animals is a key information for
technicians that intend to produce meat. In a simple view, the growth is depicted as the increase
in size, but this increase is not similar among all body parts (Widdowson, 1980). Classically,
the body growth is divided as a function of tissues growth, where the skeleton is the first to
develop, followed by muscle and adipose tissue (Fowler, 1980). Moreover, not all members
develop together, so understand this phenomenon is a key step to achieve desired cuts and traits
yields.
The study of allometry is classically used by biologists to better understand
evolutionary shape and morphology of species by interpreting their relative growth of body
parts (Stevens, 2009). This technique was basically classified into three categories: (i) Static or
size allometry, (ii) ontogenetic or growth allometry, and (iii) evolutionary allometry
(Klingenberg, 1996). It is obvious that when the interest is on growth pattern, the second
technique is the most appropriate, by using longitudinal data, and/or cross-sectional data with
different specimens in several known stages. Due to possible changes on rate of growth of
different body parts for different experimental units at dissimilar stages of life, the linear
bivariate approach proposed by Huxley (1932), often sufficient for explaining the relationship
between body parts (Stevens, 2009), may not hold. Therefore, Klingenberg (1996) presented a
multivariate technique using principal components which is supported by the frequent find that
the first eigenvector 𝛃 estimated by a principal component analysis (PCA), often contains
the largest proportion of the total variance. This approach allows both comparisons between
groups using 𝛃 estimated from absolute weights of parts and also the overall isometry between
parts tested together. This way, this technique can be used to compare the growth of all parts
in a one-step approach, and simultaneously investigate possible differences due to different
Chapter 1 - Body composition and net protein requirement for
weight gain of Brazilian hair ewe lambs and evaluation of
international nutritional models
L. F. L. Cavalcantia*, I. Borgesa, L. O. Tedeschib, A. L. C. C. Borgesa, V. L. Silvaa, F. S. Santosa
a Departamento de Zootecnia, Veterinary School, UFMG, Belo Horizonte, MG 30.161-970, Brazil
b Department of Animal Science, Texas A&M University, College Station, TX 77845-2471, USA
*Corresponding author: Present addresses: Av. Antônio Carlos 6627, P.O. Box 567, Campus Pampulha da UFMG, ZIPCODE: 30.161-970. Belo Horizonte, MG. +55 31 34092184. E-mail:
ABSTRACT: This experiment was conducted to determine the net protein requirements for
gain (NPg) of Santa Inês female lambs, and secondarily, evaluate international feed systems
predictions for this characteristic. Fifty-seven weaned lambs were acquired from local farms.
Twenty-one were slaughtered at the beginning of trial to give information about initial empty
body weight and composition for the remaining animals, following comparative slaughter
methodology. The latter lambs were assigned in a completely randomized design with a 2 x 3
factorial arrangement (two nutritional planes, ad libitum or restricted, versus, three slaughter weights, 20, 28 or 36 kg, six animals per group). Animals’ body composition was assessed, and nutrients percentage and amount were modelled by means of Huxley’s and von
Bertalanffy’s mathematical functions. The net protein requirements for gain was obtained from
the first derivative of Huxley’s function. Besides, the predictions from AFRC (1993), CSIRO (2007), NRC (1985), NRC (2007) and SRNS (2010) were evaluated. Lambs from restricted
group presented lower intake compared to ad libitum (~30% less, P < 0.001), also lower weight at slaughter and smaller average daily gain (P < 0.001). The von Bertalanffy’s growth function was successfully fitted to nutrient percentage on empty body weight, and provided valuable
information regarding body composition changes. The estimated asymptotes were in a
reasonable value for the evaluated animals. The net protein requirements derived from
Huxley’s function resulted in an average NPg of 12.5 g/100 g o EBW gain in animals with 30
kg of shrunk BW. The models evaluation showed that Santa Inês female lambs present a higher
NPg compared to the international feed systems predictions. Moreover, the SRNS (2010)
presented the best accuracy for NPg estimative (CCC = 0.948, r = 0.985 , Cb = 0.963, RMSEP
= 1.80 g).
1. Introduction
Historically, the production of small ruminants is highly associated to developing countries all
around the world. In such places, raising sheep and goat, due to their multifunctional
characteristic, represent a livestock activity that may support both financial and food security,
mainly in smallholder systems (Hilali et al., 2011; Devendra and Liang, 2012; Oluwatayo and
Oluwatayo, 2012). Nonetheless, the low production efficiency in this scenario, becomes a
challenge in times of climate change and global policies to promote sustainable intensification
(Thornton et al., 2009; Herrero et al., 2010; Garnett et al., 2013; Herrero et al., 2014; Vervoort
et al., 2014). In this sense, information about feed quality and nutrient requirements of farm
animals are essential to improve feed-use efficiency.
This situation is even worst in either developing countries or semiarid regions (Herrero et
al., 2013). The caatinga is the predominant biome in the northeast of Brazil, characterized by a
semiarid climate condition, with irregular rainfall distribution and low stocking rates (Santos
et al., 2010). In this region prevails the biggest percentage of Brazilian sheep herd, where hair
native breeds with small to medium mature size are typical, such as Santa Inês. It is believed
that this genotype was originated from crossings between Italian Bergamacia ewes and
Brazilian northeastern native breeds, and it is depicted as adult ewes with medium mature size,
around 50 kg of live weight (LW) at body condition score of 3.0 (i.e. scale from 0 to 5). They
are also known for its rusticity, good maternal ability and, adaptation to tropical conditions,
being usually used in pure breed systems or on crossings with specialized meat breeds (Sousa
et al., 2003). Besides, for this sheep, the photoperiod dependency for reproduction is less
pronounced, which gives a big advantage and flexibility to farmers when use them as dams,
justifying its popularity all over the country. However, information about nutritional
requirements of this hair sheep, and others native breeds, are scarce in the literature(Regadas
Filho et al., 2013).
Protein is a key nutrient in livestock systems since it respond to a large cost in farm input
resources and at the same time, explain the value aggregation in the final products (e.g., milk,
meat, wool). Moreover, the waste of these compounds may cause in both economical and
energy loss, also environmental impact (Montes et al., 2013). Rearing female lambs for either
ewe replacement or to slaughtering, demands good knowledge of protein requirements, mainly
for maintenance and tissue gain. For the last, its net requirement is highly dependent on body
composition, thus on characteristics such as breed, gender, and life stage (Cannas et al., 2004).
Although, due to the lack of information for Brazilian hair lambs requirements and body
international committees (NRC, 1985a; AFRC, 1993; CSIRO, 2007; NRC, 2007). There are
several differences among these feeding systems, such as feeds used, animals evaluated, and
modeling approach as well (Tedeschi et al., 2013), which may interfere on requirements
accuracy and prediction (Tedeschi et al., 2014).
The main objective of this work was to use body composition data from Santa Inês female
lambs to estimate their net protein requirement for live weight gain. Secondarily, the feed
systems from North-America (NRC, 1985a; NRC, 2007; SRNS;Tedeschi et al., 2010), United
Kingdom (AFRC, 1993) and Australia (CSIRO, 2007) were evaluated regarding their precision
and accuracy in predicting protein requirements for Santa Inês lambs weight gain.
2. Material and Methods
Animal procedures were approved by the Animal Experimentation Committee of
Universidade Federal de Minas Gerais, Belo Horizonte, Brazil (Protocol 197/2010, Appendix
B).
2.1.Location, animals and experimental design
The experiment was conducted, between December 2010 and March 2011, in the
Laboratory of Metabolism and Calorimetry at Veterinary School of Universidade Federal de
Minas Gerais, Brazil. Fifty-seven Santa Inês weaned female lambs, about three months age,
were acquired from local farms. On arrival (d -15±7), the lambs were brought to the working
facility, where they were 1) weighed individually, 2) identified with a uniquely numbered ear
tag, 3) vaccinated against clostridium spp. and 4) treated for parasites with closantel. Animals
were assigned in three groups, lighter, intermediate and heavier, based on their initial live
weight and body condition score (16.5±2.4, 21.3±2.5, 28.2±1.87 kg, respectively). Within each
group, 12 animals were randomly selected and divided in two groups of six lambs each, where
the first (AL) had ad libitum access to diet (allowance of 15 % of refusal), whereas for the
second (R) it was imposed an intake restriction initially targeted at 30 % of the computed daily
intake of animals with unrestricted access to feed (i.e., [ = ̅̅̅̅̅̅̅̅ × . , ⁄ . ]).
The animals from lighter, intermediate and heavier groups were fattened to achieve the
following slaughter weights: 20, 28 or 36 kg of LW. Every time an animal from AL group
achieved its target weight, it and a previously selected animal from restricted group were
simultaneously slaughtered. The animals were housed in a large room with controlled
water and salt containers. These cages also had a slated floor to allow excrete collection. Every
morning, last day orts were collected and weighed, and first meal was offered, therefore daily
intake could be computed. The remaining 21 lambs were slaughtered on day 0 of the trial. These animals’ body composition were used to estimate initial empty body weight and composition for the animals that continued in the experiment.
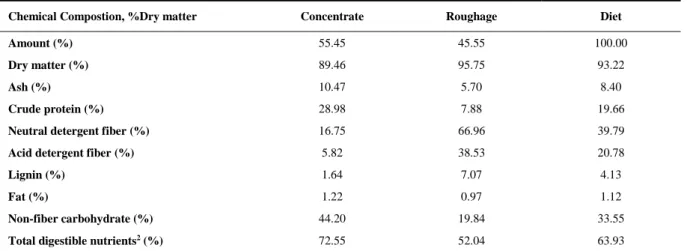
2.2. Feeds, diet chemical composition and digestibility trial
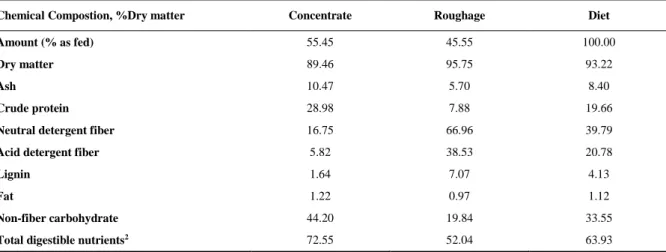
The experimental diet (Table 1) consisted of corn meal, soybean meal, chopped Tifton hay
(Cynodon spp., 2 cm length) and minerals. Nutrient requirements were obtained from Small
Ruminant Nutritional System (Tedeschi et al., 2010), simulating a condition of live weight gain
around 200 g/d for animals weighing 30 kg BW. The roughage was cut in a stationary forage
chopper before being fed. Concentrate and hay were offered simultaneously, and diet was split
into two equal meals fed at 8:00 am and 4:00 pm. The amount fed was weekly adjusted, after
lambs weighing.
Table 1 – Chemical composition of experimental diet
Chemical Compostion, %Dry matter Concentrate Roughage Diet
Amount (% as fed) 55.45 45.55 100.00
Dry matter 89.46 95.75 93.22
Ash 10.47 5.70 8.40
Crude protein 28.98 7.88 19.66
Neutral detergent fiber 16.75 66.96 39.79
Acid detergent fiber 5.82 38.53 20.78
Lignin 1.64 7.07 4.13
Fat 1.22 0.97 1.12
Non-fiber carbohydrate 44.20 19.84 33.55
Total digestible nutrients2 72.55 52.04 63.93
1 – Diet composition, % Dry matter: Corn meal = 26.06, soybean meal = 27.39, dicalcium phosphate = 0.08, limestone = 1.03, sodium-bicarbonate = 0.89, cynodon hay = 44.56. 2 – Calculated based on NRC (2001).
In the last week prior to slaughter, during five days, feed, refusals (whenever existed),
feces and urine were collected, weighed and sampled (10% by day), being stored at -17ºC. A
solution of 6M HCl was daily added to the urine bucket in a quantity of 100 mL, to avoid
nitrogen loss by volatilization. At the end of the collection period, each material was
homogenized to form a composite by animal representing the five days of collection. All
in a Wiley mill to pass a 1-mm screen. Urine density was measured using a refractometer. All
samples were analyzed for gross energy (GE) using a bomb calorimeter, and also for nitrogen
content (Kjeldahl method), following AOAC (1990). The diet metabolisable energy (ME,
Mcal/kg) was computed by subtracting from feed GE, the gross energy presented on urine,
feces and methane emission. The last one was estimated following recommendation of Blaxter
and Clapperton (1965). A linear model was fitted to evaluate the relation between ME content
and metabolic body weight (kg0.75).
2.3.Slaughter procedure and body composition analyses
The slaughter day for each pair of animals (i.e., one from AL and one from R group) was
defined based on the expected day when the animal from AL group would reach its respective
target weight (20, 28 or 36 kg LW). This prediction was possible based on the animal weekly
weighing history. Feed was withdraw for 16 h previous to slaughter, when the shrunk BW was
obtained, as well the BCS at slaughter accordingly to NRC (2007) scale. Lambs were stunned
by percussion, hooked and exsanguinated by cutting main vessels of the neck, following
common humane slaughtering procedures. Blood was collected in a bucket, weighed and
sampled. All body components (carcass, head, fore and hind feet, hide, tong, traquea and
esophagus, lungs, heart, rumen, reticulum, omasum, abomasum, small and large intestInês,
liver, bladder, gallbladder, pancreas, kidneys, spleen, diaphragm, uterus, mammary gland, and
visceral fat) were weighed separately and stored in cooling chamber (-17 ºC) . The digestive
tract, also bladder and gallbladder were weighed before and after emptying, in order to obtain
digestive content weight, thus, by subtracting its weight from SBW was obtained the empty
body weight (EBW).
Lambs carcasses were split at the midline using a band saw. The right side half was passed
three times through an industrial meat grinder (plate with 0.32 cm holes), homogenized and
sampled. This same procedure was done with head, fore and hind feet and hide. Organs and
viscera were cut in small pieces and sampled following proportional weight in relation to EBW.
They were mixed and passed three times through meat grinder, homogenized and sampled. All
components were air dried in oven (55 ºC, 72 h), following immersion in petroleum ether for
48 h to be obtained the pre-defatted dry weight by weight difference. This material was ground
to pass a 1-mm screen. Samples were analyzed for fat (final ether extraction was obtained in
soxhlet apparatus), nitrogen content (Dumas combustion using LECO FP-528), and ash by
2.4.Calculations
Total nutrients amount in EBW was calculated following equation 1.
= ∑ 𝑃 𝑃 / =
[ 1 ]
Where NA is the nutrient amount in the EBW of the ith animal (g), BP is the weight of the
jth body part (g) in the ith animal, and NP is the nutrient percentage on the jth body part of the
ith animal (%), and n is the number of body parts.
The initial EBW of animals that continued in the experiment was estimated based on a
linear model regression of all animals EBW against their SBW, as depicted on equation 2.
𝑊 = + × 𝑊 + 𝜀 [ 2 ]
Where EBW is the estimative of empty body weight for the ith animal (kg), SBW is the shrunk body weight of the ith animal (kg), whereas α is the intercept (kg), β is the slope
(dimensionless) and εi corresponds to the randomerror associated to the ith observation.
Due to the asymptotic nature of body components growth, the von Bertalanffy’s nonlinear
function was fitted to data in order to predict water, ash, protein and fat percentages relative to
EBW, following equation 3. Models’ parameters were estimated by least square method, using
Gauss-Newton algorithm.
𝑃 = × − × 𝑝−𝜅 × 𝑊 + 𝜀 [ 3 ]
Where, NP is the jth nutrient percentage in a specific EBW (kg) of the ithanimal, is the
asymptote (%), is a constant related to the intercept and its sign defines whether NP will
increase or decrease with the change in the values of EBW (%), and 𝜅 is the deposition rate
(1/%).
Net protein requirements for growth were estimated according to ARC (1980) by
establishing the allometric relationship between protein amount (g) and EBW (kg), by means
of Huxley (1932) mathematical function, as follows (Equation 4). Allometric coefficients were
estimated by least square method, using Gauss-Newton algorithm. To calculate protein
𝑃 = × 𝑊 𝛽+ 𝜀 [ 4 ]
𝑃 = ̂ × ̂ × 𝑊 𝛽̂− × [ 5 ]
Where PA is protein amount (g) in the EBW (kg) of the ith animal, and are allometric
coeffcients, while 𝜀 represent the random error associated to the ith observation. NPg is protein
(g) accreted into EBW (kg) accordingly to an average daily gain (ADG, kg), based on
parameters estimated by equation 4.
2.5.Models evaluation
The estimated net protein requirements for gain computed for each animal in the present
study, by means of equation 5, was used to evaluate five feed systems: AFRC-1993,
CSIRO-2007, NRC-1985, NRC-2007 and SRNS-2010. The equations used to compute the
requirements by each committee are presented in equations 6 to 11.
AFRC (1993) 𝑃 = . − . 𝑊 + . 𝑊 [ 6 ]
CSIRO (2007) and
SRNS (2010)
= . 𝑊. − . ⁄. [ 7 ]
𝑃 = 𝑊⁄ [ 8 ]
𝑃 𝐼 / = ( − − − +− − −− . ) [ 9 ]
NRC (1985) 𝑃 = − . 𝑊
.
× [ 10 ]
NRC (2007) 𝑃 = . ( . − . /( + − − . ) ) [ 11 ]
Where NPg is the net protein requirement for gain (g), ADG is the average daily gain of
full body weight (kg) and, BW is the body weight (BW). The L factor, necessary for
CSIRO-2007, SRNS-2010 and NRC-2007 systems, stand for the intake of metabolisable energy above
maintenance requirement. The latter was estimated following NRC (2007) recommendations,
while the former was obtained by calculating the daily intake of metabolisable energy during
rate between current BW and BW at mature size, which was assumed as 50 kg in the present
study. The A parameter in Equation 9 assumes the value of 120 in SRNS model and 140 in
CSIRO.
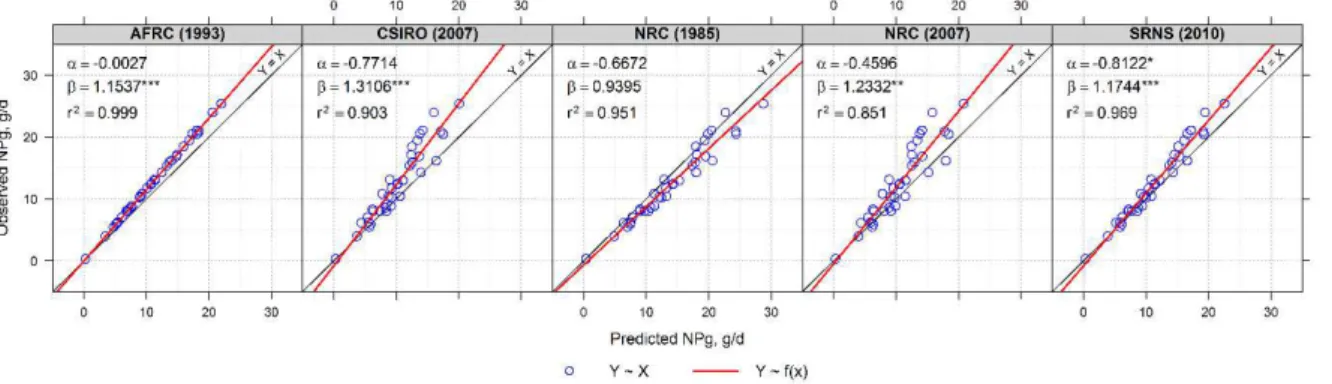
Models evaluations were performed by plotting and regressing the observed values for net
protein accretion on the EBW of each animal over the predicted by each system (Equation 12).
𝑌 = + × + 𝜀 [ 12 ]
Where, Y is the ith observed value, and are the intercept and slope, respectively,
represents the ith output from the jth model, while the 𝜀 coefficient stands for the random error
(i.e., residue) associated to the ith paired data point, which is independent and identically distributed ~ ℕ , 𝜎 .
The fitted linear regression coefficients and were tested for the null hypothesis of
equality to 0 and 1, respectively. Additionally, were computed the following statistics as
suggested by (Tedeschi, 2006): Mean square error of prediction (MSEP), Root mean square
error (RMSE), Mean bias (MB), and, Concordance correlation coefficient (CCC) decomposed
in correlation coefficient (r) and bias correction factor (Cb), in order to evaluate model precision and accuracy, respectively. These analyses were performed by means of the Model Evaluation
System (http://nutritionmodels. tamu.edu/mes.htm, verified November 2014).
2.6. Statistical analyses
Variables obtained through digestibility trial and for body composition were analyzed as
a completely randomized design with a 2 x 3 factorial arrangement. The statistical model used
is shown below:
= 𝜇 + + + + 𝜀 [ 13 ]
Where is the measured variable for the ith nutritional plane in the jth slaughter weight for the kth repetition, 𝜇 is the overall mean, is the fixed effect, is the fixed effect for,
is the interactive effect, and 𝜀 represents the error term. The degree of freedom (df) for this
model includes 5 df for nutritional planes plus slaughter weight (i.e., 1 df for diet, 2 df for live
weight at slaughter, and 2 df for interaction). Linear and quadratic contrasts were used for the
effect of slaughter weight (20, 28 or 36 kg LW) within each nutritional plane.
3. Results and discussion
3.1. Animals performance and diet digestibility
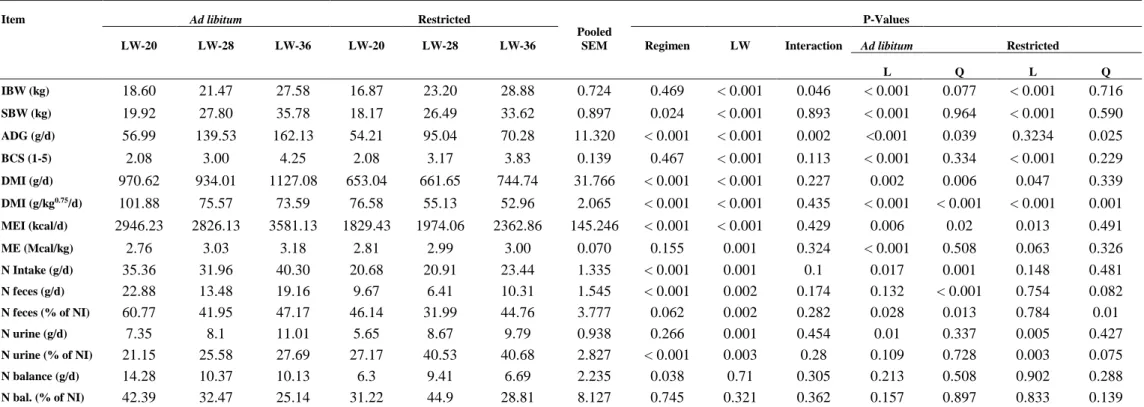
Results of animal performance and digestibility trial are presented in Table 2. Even though
animals from different regimens started the trial with the same weight (P > 0.05), nutritional
restriction did reduce average daily gain (ADG), thus reducing shrunk body weight at slaughter
weight (P < 0.05). Body condition score, however, was not affected by regimen, but was
linearly increased as lambs got heavier. The average daily gain was slightly lower than the
predicted by SRNS at the moment of diet calculation (i.e., 200 g/d). However not evaluated in
this paper, similar result was found by Regadas Filho et al. (2011a) who worked with Santa
Inês male lambs, and conclude that in average, SRNS tended to overestimate average daily
gain for this sheep. On the other hand, Galvani et al. (2008) working with Texel crossbred
lambs in Brazilian conditions found that CNCPS-S ((Cannas et al., 2004), latter revised and
renamed to SRNS by Tedeschi et al. (2010)) under predicted the ADG of these lambs. These
authors agreed that such differences might be the result of both animal and environmental
discrepancies between Brazilian scenery and that one used throughout SRNS development.
Moreover, these results indicate that even a mechanistic approach such that used by SRNS may
result in inaccuracy and imprecision when evaluated using independent data sets, therefore it
is fundamental to evaluate such models constantly so they can evolve.
As expected, dry matter intake was reduced by influence of nutritional plane, in an average
ratio of 73% of intake of animals from the AL group (g/kg0.75), close to designed restriction
(i.e., 30 %). Nevertheless, all registered intake were in the range of DMI observed in the data
bank collected by Vieira et al. (2013) (i.e., 2.3 to 5.4% LW) that conducted a meta-analysis to
study the intake of Santa Inês male lambs reared in Brazilian feedlot condition. In addition,
DMI was also quadratically reduced in animals with unrestricted access to feed (P < 0.001) as
slaughter weight increased. This result is in agreement with CSIRO (2007) approach regarding
Table 2 – Animal performance and digestibility trial results
Item Ad libitum Restricted
Pooled SEM
P-Values
LW-20 LW-28 LW-36 LW-20 LW-28 LW-36 Regimen LW Interaction Ad libitum Restricted
L Q L Q
IBW (kg) 18.60 21.47 27.58 16.87 23.20 28.88 0.724 0.469 < 0.001 0.046 < 0.001 0.077 < 0.001 0.716
SBW (kg) 19.92 27.80 35.78 18.17 26.49 33.62 0.897 0.024 < 0.001 0.893 < 0.001 0.964 < 0.001 0.590
ADG (g/d) 56.99 139.53 162.13 54.21 95.04 70.28 11.320 < 0.001 < 0.001 0.002 <0.001 0.039 0.3234 0.025
BCS (1-5) 2.08 3.00 4.25 2.08 3.17 3.83 0.139 0.467 < 0.001 0.113 < 0.001 0.334 < 0.001 0.229
DMI (g/d) 970.62 934.01 1127.08 653.04 661.65 744.74 31.766 < 0.001 < 0.001 0.227 0.002 0.006 0.047 0.339
DMI (g/kg0.75/d) 101.88 75.57 73.59 76.58 55.13 52.96 2.065 < 0.001 < 0.001 0.435 < 0.001 < 0.001 < 0.001 0.001
MEI (kcal/d) 2946.23 2826.13 3581.13 1829.43 1974.06 2362.86 145.246 < 0.001 < 0.001 0.429 0.006 0.02 0.013 0.491
ME (Mcal/kg) 2.76 3.03 3.18 2.81 2.99 3.00 0.070 0.155 0.001 0.324 < 0.001 0.508 0.063 0.326
N Intake (g/d) 35.36 31.96 40.30 20.68 20.91 23.44 1.335 < 0.001 0.001 0.1 0.017 0.001 0.148 0.481
N feces (g/d) 22.88 13.48 19.16 9.67 6.41 10.31 1.545 < 0.001 0.002 0.174 0.132 < 0.001 0.754 0.082
N feces (% of NI) 60.77 41.95 47.17 46.14 31.99 44.76 3.777 0.062 0.002 0.282 0.028 0.013 0.784 0.01
N urine (g/d) 7.35 8.1 11.01 5.65 8.67 9.79 0.938 0.266 0.001 0.454 0.01 0.337 0.005 0.427
N urine (% of NI) 21.15 25.58 27.69 27.17 40.53 40.68 2.827 < 0.001 0.003 0.28 0.109 0.728 0.003 0.075
N balance (g/d) 14.28 10.37 10.13 6.3 9.41 6.69 2.235 0.038 0.71 0.305 0.213 0.508 0.902 0.288
N bal. (% of NI) 42.39 32.47 25.14 31.22 44.9 28.81 8.127 0.745 0.321 0.362 0.157 0.897 0.833 0.139
This committee assumes that potential intake increases in a quadratic fashion as animals
become mature, achieving the maximum when they reach 85% of mature weight, in a scale
denominated relative size. It is believed that Santa Inês ewes have mature weight around 50
kg, what corroborates the last inference, since the heavier animals in the present study would
be close to 85% for relative size.
Since the same diet was given to all animals, nutrients absolute intake accompanied the
DMI, as may be seen from results for metabolisable energy intake and nitrogen intake.
However, ME content was linearly affected by slaughter weight (P < 0.1), getting higher as
animals become heavier. This relationship was modelled by a linear first order regression
between ME content and body metabolic weight, that presented the following results:
𝑐𝑎⁄𝑔 = , ± . + . ± . 𝑊 . ; = . , =
. 𝑐𝑎 𝑔
⁄ , 𝑃 < . .
[ 14 ]
This increase in diet metabolisability may be related to a more developed gastro intestinal
tract, as reported by Cavalcanti et al. (2014), thus improving feed-use efficiency. Otherwise, it
can also be a result of diet selection, since heavier animals received a larger portion of feed,
they tend to eat more concentrate and refuse roughage, this way increasing the metabolisable
energy of diet by increasing concentrate portion on actual intake. Indeed, the effect of age over
diet metabolisability is well documented (Vermorel and Bickel, 1980), and energy digestibility
tends to be lower in growing animals compared to adults, mainly in lambs. However, none feed
system allows any correction in this sense.
Nitrogen excretion, feces plus urine, did not follow the same pattern of N intake, but in
general were affected by nutritional plane, where N on feces was lower in an absolute scale for
animals from the R group (P < 0.001) and also tended to be lower in a relative manner (P =
0.062), whereas for urinary N, only the relative excretion was influenced, being higher for
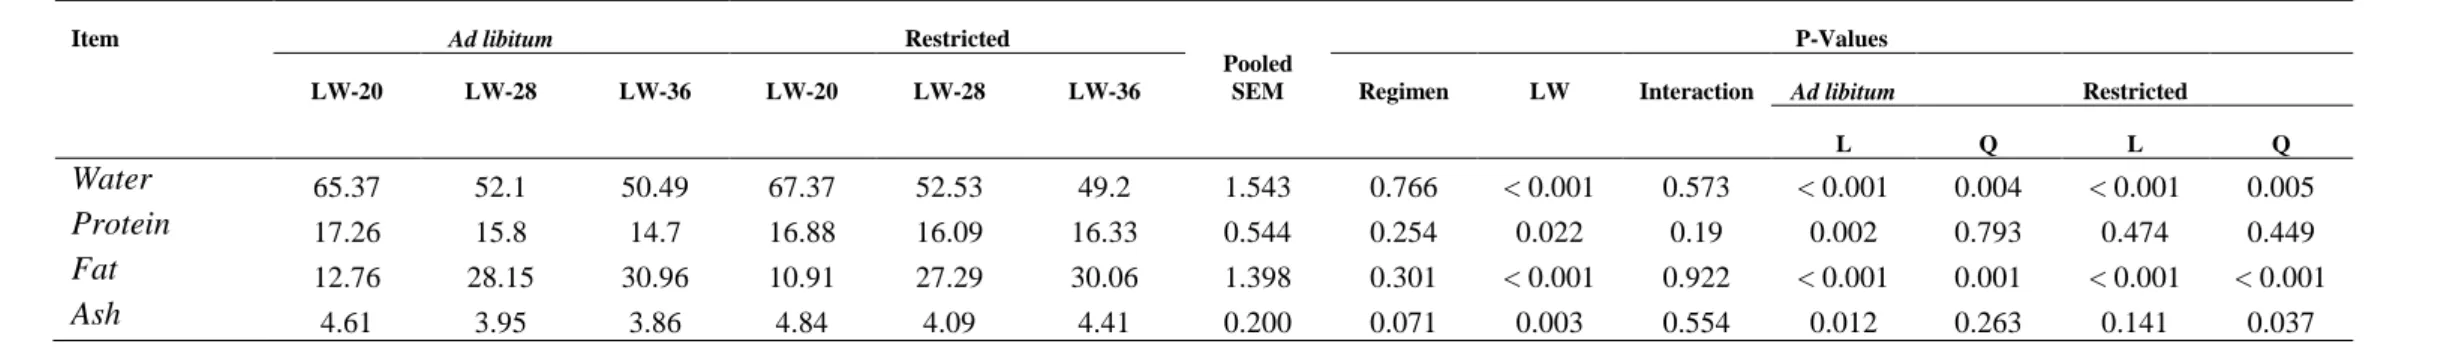
Table 3 – Body composition in percentage of empty body weight
Item Ad libitum Restricted
Pooled SEM
P-Values
LW-20 LW-28 LW-36 LW-20 LW-28 LW-36 Regimen LW Interaction Ad libitum Restricted
L Q L Q
Water 65.37 52.1 50.49 67.37 52.53 49.2 1.543 0.766 < 0.001 0.573 < 0.001 0.004 < 0.001 0.005
Protein 17.26 15.8 14.7 16.88 16.09 16.33 0.544 0.254 0.022 0.19 0.002 0.793 0.474 0.449
Fat 12.76 28.15 30.96 10.91 27.29 30.06 1.398 0.301 < 0.001 0.922 < 0.001 0.001 < 0.001 < 0.001 Ash 4.61 3.95 3.86 4.84 4.09 4.41 0.200 0.071 0.003 0.554 0.012 0.263 0.141 0.037
Regimen also influenced on nitrogen balance, being lower for animals in restricted group
(g/d, P < 0.05). However, in relation to N intake, balance was not affected by neither slaughter
weight nor by regimen. Ruminants have a notorious ability to retain nitrogen in levels necessary
to maintain both rumen microbial activity and also support host maintenance requirements
(Obitsu and Taniguchi, 2009). Starke et al. (2012) showed that goats’ kidneys responds to a
lower nitrogen income by upregulating urea transporters in renal cortex, thus increasing urea
reabsorption. In the present study, lambs under restriction presented a bigger excretion of
nitrogen in urine compared to AL animals, therefore, differing from last authors finds.
Notwithstanding, even restricted animals from this work received a large amount of nitrogen
since diet had a high crude protein concentration (> 19% on DM basis). Therefore, it is possible
that the imposed restriction was more effective in reducing energy availability than crude
protein to rumen microbes, thus causing an asynchrony between nitrogen release and microbial
growth, resulting in higher ammonia absorption and eventually nitrogen wastage (Hristov et
al., 2005), probably overcoming kidneys capacity of reabsorption in restricted animals.
3.2. Empty body weight composition
The equation for empty body weight estimative is presented below.
𝑊 = − . ± . + . ± . × 𝑊; = . , = , 𝑃 < . [ 15 ]
Following this equation, EBW of animals with 20 and 40 kg of SBW would be 15.7 and
33.49 kg, respectively, thus between 78 and 83% of SBW. This result is slightly lower than the
value adopted by SRNS model, where the EBW is computed as a fixed rate of 85.1% of SBW
(Cannas et al., 2004). On the other hand, this values are close to the one found by Regadas
Filho et al. (2011b) (i.e., 80.36% of BW) who worked with Santa Inês male lambs in a similar
slaughter weight range.
The body composition is presented in Table 3. It is possible to notice that none of body
components were affected by regimen when evaluated as a percentage of empty body weight.
However, in relation to live weight, all components, with exception of fat tended to decrease
as body weight got heavier.
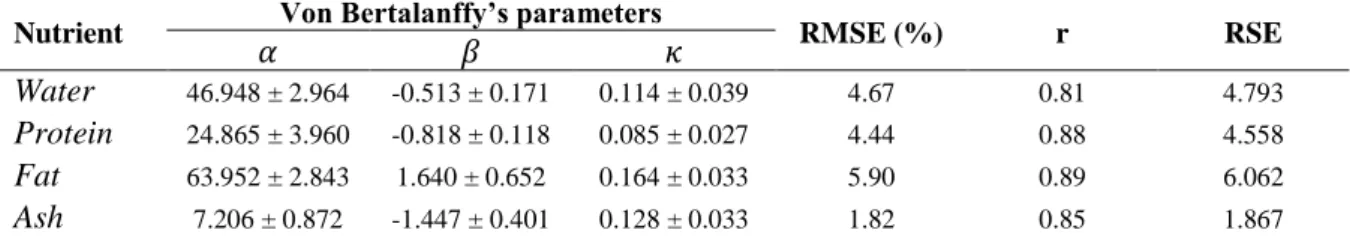
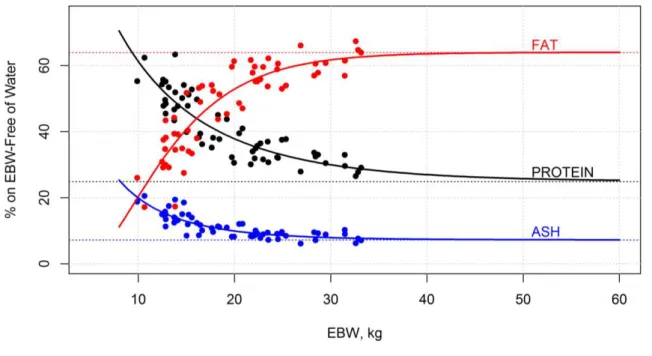
The results for von Bertalanffy’s parameters fitted to water, protein, fat and ash percentage
on empty body weight are presented in Table 4, and depicted in Figure 1. All models presented
RMSE. Moreover, the high values for correlations between predicted and observed values
denote a high precision. These results indicate that the growth model used is sufficient to
explain body composition changes of growing lambs. Additionally, the estimated values for
parameter in each model shows that only for fat, this coefficient had a positive value, what
corroborates the fact that as animals become heavier, fat percentage tends to get higher whereas
the others, although being deposited on tissue gain, are accreted in lower rates, thus having
their proportion reduced as EBW increases. In addition, the significance of parameter
indicates that all nutrients were reaching a plateau as animals got heavier. This asymptotic-like
pattern is typical for animals getting close to maturity, when all tissues weight tends to became
steady. In Figure 1, the x axis (i.e., empty body weight, kg) was extended to values not found
in the present data bank. This approach was used to evidence the asymptote in each fitted
model. Also, the dashed lines shows the exactly value of α. It is possible to notice that, with
exception of protein, the heavier animals in data set were close to the asymptote. Furthermore,
it is also possible to realize that all lambs would have all nutrients percentage steady when they
reach an EBW around 50 kg, what agrees with the common find of Santa Inês ewes with this
body weight when adults. Obviously, a more complete data bank, with animals slaughtered in
more advanced ages would be necessary to confirm this technique, since extrapolations out of
explored x-space are somewhat dangerous (Draper and Smith, 1981). However, these results
indicate that this approach may be used with success to define a mature weight of a population
based on their body composition. Moreover, this modeling process can be useful to predict
body composition as function of body weight, and probably, adding covariables to this model,
such as body condition score, would improve its accuracy and precision.
Table 4 – Von Bertalanffy’s function fitted to water, protein, fat and ash percentage on empty body weight.
Nutrient Von Bertalanffy’s parameters RMSE (%) r RSE
𝜅
Water 46.948 ± 2.964 -0.513 ± 0.171 0.114 ± 0.039 4.67 0.81 4.793
Protein 24.865 ± 3.960 -0.818 ± 0.118 0.085 ± 0.027 4.44 0.88 4.558
Fat 63.952 ± 2.843 1.640 ± 0.652 0.164 ± 0.033 5.90 0.89 6.062
Ash 7.206 ± 0.872 -1.447 ± 0.401 0.128 ± 0.033 1.82 0.85 1.867
RMSE = Square root of mean square error, r = correlation between observed and predicted values, RSE = Model’s residual standard error.
𝑃 = . ± . × 𝑊 . ± . ;
= . , = . , 𝑃 < . [ 16 ]
𝑃 = . × . 𝑊− . × [ 17 ]
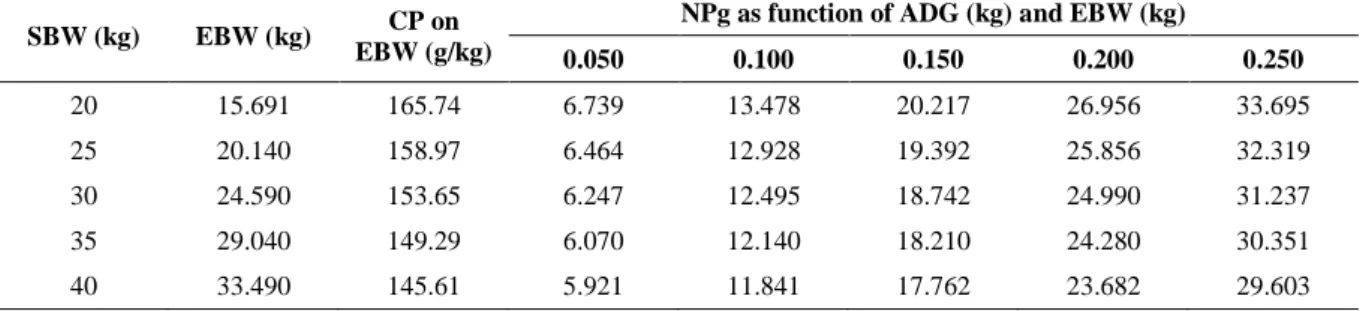
Equation 16 presented a good adjustment, with a high coefficient of determination, and
relative low square root of mean square error. From these equations is possible to estimate net
protein requirements for gain, as presented in Table 5. The values for protein requirements are
quite close to the ones found by Regadas Filho et al. (2011b) that worked with Santa Inês lambs
in similar condition. In fact, these authors presented slightly higher values for protein accretion
on empty body weight gain, what is appropriate since they worked with males. From Table 5
is also possible to observe that protein content on EBW gain tends to decrease as animals get
heavier. This result corroborates the ones obtained through modelling body composition using
von Bertalanffy’s growth function. Such pattern was also found by Silva et al. (2010) and
Gonzaga Neto et al. (2005) who worked with Santa Inês castrated males lambs in Caatinga
condition and with Morada Nova lambs (i.e., other hair lamb genotype), respectively. As well
as Regadas Filho et al. (2011b), these authors found a slightly higher net protein requirements
for gain than the ones showed in the present study, what can be partially explained by gender
effect.
Table 5 – Protein on empty body weight and net protein requirements for weight gain of Santa Inês
ewe lambs
SBW (kg) EBW (kg) CP on EBW (g/kg)
NPg as function of ADG (kg) and EBW (kg)
0.050 0.100 0.150 0.200 0.250
20 15.691 165.74 6.739 13.478 20.217 26.956 33.695 25 20.140 158.97 6.464 12.928 19.392 25.856 32.319 30 24.590 153.65 6.247 12.495 18.742 24.990 31.237 35 29.040 149.29 6.070 12.140 18.210 24.280 30.351 40 33.490 145.61 5.921 11.841 17.762 23.682 29.603
SBW = Shrunk body weight, EBW = Empty body weight, CP = Crude protein, NPg = Net protein requirements for gain, ADG = Average daily gain.
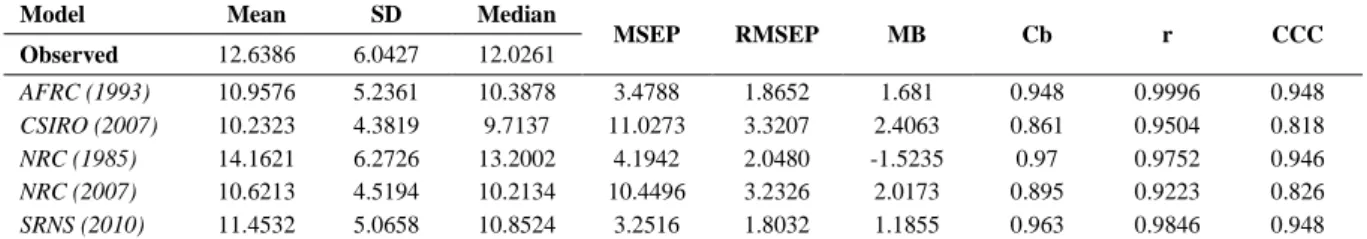
3.3. Models evaluation
As pointed out by Tedeschi et al. (2014) most intercomparisons of the adequacy of livestock mathematical models’ predictions are made only as needed, and often are conducted in order to promote a single model rather than highlight important gaps and
models’ application in different scenarios. In this sense, such comparisons tend to overvalue
the use of a specific model, mostly when its accuracy and precision is evaluated using
datasets similar to those ones used throughout model development. However, recently,
nutritional models development has been based on mechanistic and stochastic approach,
which may provide a more generalist application (Baldwin, 1995). Although, most models
evolved their mechanistic approach more on the nutrient supply side than in nutrient
requirements or efficiency of use of protein, and old values of reference (ARC, 1980; NRC,
1985b; CSIRO, 1990). still being adopted (Tedeschi et al., 2013). Such imbalance was
mainly caused because there was a greater advance in the field of feed analysis and nutrient
supply with the advent of carbohydrate and protein fraction systems (Russell et al., 1992;
Fox et al., 2004), that was not followed by research on protein requirements. With the global
pressure for nitrogen wastage mitigation in livestock systems, most likely, more researchers
will engage on protein metabolism studies and new data will surge in the upcoming years
(Eckard et al., 2010).
Regarding protein requirements for sheep live weight gain, the evaluated models in this
study use a common approach based on the protein content in empty body weight. Moreover,
the most recent models (i.e., NRC (2007), CSIRO (2007) and SRNS (2010)) added a correction
factor for relative size, thus animals with different frame sizes can be better compared, and the
last two, included a factor for interaction between protein and energy metabolism. As depicted
on Figure 2, the NRC (1985) and SRNS (2010) seems to be the most accurate models, since