www.clim-past.net/10/393/2014/ doi:10.5194/cp-10-393-2014
© Author(s) 2014. CC Attribution 3.0 License.
Climate
of the Past
Accumulation reconstruction and water isotope analysis for
1736–1997 of an ice core from the Ushkovsky volcano, Kamchatka,
and their relationships to North Pacific climate records
T. Sato1, T. Shiraiwa1, R. Greve1, H. Seddik1, E. Edelmann2, and T. Zwinger2
1Institute of Low Temperature Science, Hokkaido University, Kita-19, Nishi-8, Kita-ku, Sapporo 060-0819, Japan 2CSC – IT Center for Science, P.O. Box 405, 02101 Espoo, Finland
Correspondence to:T. Sato ([email protected])
Received: 19 March 2013 – Published in Clim. Past Discuss.: 17 April 2013
Revised: 10 January 2014 – Accepted: 14 January 2014 – Published: 21 February 2014
Abstract.An ice core was retrieved in June 1998 from the Gorshkov crater glacier at the top of the Ushkovsky volcano, in central Kamchatka. This ice core is one of only two recov-ered from Kamchatka so far, thus filling a gap in the regional instrumental climate network. Hydrogen isotope (δD) anal-yses and past accumulation reconstructions were conducted for the top 140.7 m of the core, spanning 1736–1997. Two ac-cumulation reconstruction methods were developed and ap-plied with the Salamatin and the Elmer/Ice firn-ice dynam-ics models, revealing a slightly increasing or nearly stable trend, respectively. Wavelet analysis shows that the ice core records have significant decadal and multi-decadal variabil-ities at different times. Around 1880 the multi-decadal vari-ability ofδD became lost and its average value increased by 6 ‰. The multi-decadal variability of reconstructed lation rates changed at around 1850. Reconstructed accumu-lation variations agree with ages of moraines in Kamchatka. Ice core signals were significantly correlated with North Pa-cific sea surface temperature (SST) and surface temperature (2 m temperature).δD correlates with the North Pacific Gyre Oscillation (NPGO) index after the climate regime shift in 1976/1977, but not before that. Therefore, our findings imply that the ice core record contains various information on the local, regional and large-scale climate variability in the North Pacific region. Understanding all detailed mechanisms be-hind the time-dependent connections between these climate patterns is challenging and requires further efforts towards multi-proxy analysis and climate modelling.
1 Introduction
Alpine ice core records have two important roles. One is to provide data for studying local climate characteristics. The other is to fill geographic gaps in the network of glacio-chemical and climatic records used to reveal how regions are affected by global climate change (Wagenbach, 1989; Cecil et al., 2004). There are several glacial regions around the North Pacific Ocean that can provide ice cores for paleo-climate reconstructions. The Ushkovsky/K2 ice core is one of two ice cores recovered from Kamchatka (Shiraiwa et al., 2001; Matoba et al., 2011). It is a paleoclimate record for this region that complements regional climate reconstructions from ice cores in Alaska and Yukon (e.g. Holdsworth et al., 1989; Wake et al., 2002; Shiraiwa et al., 2003; Fisher et al., 2004; Yasunari et al., 2007; Fukuda et al., 2011) (Fig. 1a).
Important characteristics of climate in the North Pa-cific region are decadal climate variabilities, the PaPa-cific Decadal Variability (PDV) or North Pacific Decadal Variabil-ity (NPDV). One is the Pacific Decadal Oscillation (PDO), the first leading mode of North Pacific sea surface tempera-ture variability (Mantua et al., 1997; Minobe, 1997). Another is the North Pacific Gyre Oscillation, the second mode of sea surface height anomalies (Di Lorenzo et al., 2008). These variabilities play important roles in modulating precipitation, temperature and other climatic elements around the North Pacific Ocean (e.g. Mantua and Hare, 2002; Di Lorenzo et al., 2008).
150˚ 150˚
160˚ 160˚
170˚ 170˚
180˚ 180˚
−170˚ −170˚
−160˚ −160˚
−150˚ −150˚
−140˚ −140˚
−130˚ −130˚
50˚ 50˚
60˚ 60˚
70˚ 70˚
IC US
WR
LO AU
EC
(a)
160˚ 50˚ 60˚ K
U
Gorshkov Crater
Bilchenok Glacier Herz Crater
(b)
Fig. 1. (a)Deep ice core sites around the subpolar Pacific. US: Ushkovsky (Shiraiwa et al., 2001), IC: Ichinsky (Matoba et al., 2011), LO: Logan (Holdsworth et al., 1989; Shiraiwa et al., 2003; Fisher et al., 2004), EC: Logan Eclipse (Wake et al., 2002), WR: Wrangell (Yasunari et al., 2007), AU: Aurora Peak (Fukuda et al., 2011).(b) The north face of Ushkovsky volcano and the summit craters. Bilchenok Glacier is the main outlet from the summit ice cap. Inset the location of Ushkovsky volcano (U) and the nearby weather station, Kljuchi (K).
proxies. North Pacific climate variability has therefore been reconstructed using tree rings from the Northeast Pacific re-gion (e.g. Biondi et al., 2001; D’Arrigo et al., 2001). Summer mean maximum temperature reconstructed from Kunashir tree-ring width indices (Jacoby et al., 2004) is negatively cor-related with the summer PDO index (Mantua et al., 1997) and has similar multi-decadal spectral properties. Climate vari-ability has also been detected from glaciers in Alaska and Kamchatka that changed their mass balance at the climate regime shift in 1976/1977 (Hodge et al., 1998; Shiraiwa and Yamaguchi, 2002), a timing that coincides with a major PDO shift (Hartmann and Wendler, 2005; Josberger et al., 2007). Holdsworth et al. (1989) reconstructed snow accumulation rates at Mt. Logan and found a shift in the dominant period
of accumulation variation around 1850. The accumulation increased notably after the mid-19th century, paralleled by a warming over northwestern North America (Moore et al., 2002).
To provide a further climate proxy for the western North Pacific we analysed water isotope ratios and recon-structed accumulation rates from the Ushkovsky/K2 ice core (Shiraiwa et al., 2001). Ushkovsky volcano (56.04◦N,
160.28◦E, 3903 m a.s.l.) is located in the central part of the
Kamchatka Peninsula (Fig. 1b). The summit of the volcano is covered by a glacier of 43 km2. Two craters, Gorshkov and Herz, lie near the highest part and are both filled by glacier ice. The larger, Gorshkov, is∼750 m in diameter with a max-imum depth of∼240 m determined by ice-penetrating radar (Matsuoka et al., 1999). In June 1998, at the K2 site near to this deepest point, a 211.7 m long ice core was drilled (Shiraiwa et al., 2001). It was the first ice core drilled in the western North Pacific region.
The firn temperature was measured continuously for a year at the BH1 site∼200 m south of K2. At 10 m depth the an-nual mean firn temperature is−15.8◦C. The monthly mean surface temperature is −5.8◦C at its maximum in August.
Melting occurs only in the surface layer and the meltwa-ter refreezes in the surface snow due to its low temperature. Melting does not, therefore, significantly disturb the annual stratigraphy preserved in the core (Shiraiwa et al., 2001). The average accumulation rate from 1969 to 1996 was deter-mined as 0.57 m w.eq. a−1(w.eq.: water equivalent) by shal-low ice core analysis (Shiraiwa et al., 1997).
The isotopes δ18O and δD in the K2 core have already been analysed from the surface down to 110 m. The ice at this depth fell as snow in approximately 1823 based on dated layers of volcanic ash and counting of annual layers iden-tified by changes in the water isotope ratio (Shiraiwa and Yamaguchi, 2002). Accumulation in Ushkovsky correlates with the Kliuchi meteorological station winter and hydrolog-ical year precipitation (Solomina et al., 2007).
2 Methods
2.1 Isotope measurement and dating
To measure isotope values the K2 ice core was sliced in the low temperature room (−20◦C) at the Institute of Low
Tem-perature Science, Hokkaido University. To ensure that an-nual layers could be accurately identified, slices were taken at intervals small enough to provide at least eight samples for each annual layer. The intervals varied in thickness from
∼100 mm near the top of the core,∼50 mm near the middle of the core, and∼30 mm near the bottom of the core. After slicing, each ice sample was melted in an individual sealed plastic bag. The resulting water was stored in 30–50 mL glass vials pending isotope measurements.
The water isotopes for samples from the first 110 m were measured with a Finnigan MAT Delta S mass spectrometer at the Graduate School of Environmental Science, Hokkaido University. Absolute measurement errors were 0.1 ‰ for
δ18O and 1 ‰ forδD (both at 2σ confidence). The isotopes in slices from 110.0–140.7 m were measured at the Institute of Low Temperature Science. Theδ18O isotope was mea-sured using a Finnigan Delta Plus mass spectrometer (error 0.06 ‰ at 2σ confidence), andδD using an Isoprime-PyrOH mass spectrometer (error 0.3 ‰ at 2σ confidence). Two sub-standard water probes (secondary water sub-standards) were used in each analysis, and results were corrected by the SMOW-SLAP scale (Hagemann et al., 1970).
The annual layers in the K2 core were dated by reference to four volcanic ash layers. The ages of these ash layers are known based on their chemistry (Murav’yev et al., 2007, Fig. 7). They are also identi-fied by their mineral composition and stratigraphic fea-tures (Ovsyannikov et al., 2001). These layers are from the 1985 Bezymianny eruption (12.04 m below surface), 1956 Bezymianny (35.49 m), 1829 Klyuchevskoy (102.82 m), and 1737 Bezymianny (138.45 m). The tephrochronolog-ical interpretation of the dates of the four ash layers is also supported by analytical calculations (Salamatin et al., 2000). Shiraiwa and Yamaguchi (2002) confirmed the ages of the 1737 Bezymyanni, 1829 Klyuchevskoi and 1956 Bezymyanni layers by counting annual layers in the ice core. They were identified by locating the minima of the sea-sonally varying amounts ofδD. The dating error is±2 yr at 102.82 m depth (Shiraiwa and Yamaguchi, 2002).
2.2 Accumulation-rate reconstruction
The accumulation rate, i.e. the amount of snow that falls each year, is reconstructed by combining core data with models. The core data provide the age of the annual lay-ers and their thickness. The thinning rate, how quickly an-nual layers compact, can be estimated using ice flow mod-els, measured vertical velocities, and radio echo sounding re-sults (Paterson and Waddington, 1984; Raymond et al., 1996;
Schwerzmann et al., 2006). Shiraiwa and Yamaguchi (2002) reconstructed past accumulation rates with the glacier flow model of Salamatin et al. (2000) that includes firn dynam-ics. We applied two accumulation reconstruction methods for glacier flow models with firn dynamics; the Lagrangian back-trajectory method for the Salamatin model and the Eulerian method for the Elmer/Ice model.
2.2.1 Salamatin model
Salamatin et al. (2000) devised a firn and ice flow model for a crater glacier and applied it to the Gorshkov crater glacier. It is a thermo-mechanically coupled two-dimensional glacier flow-line model that considers the effects of a flow tube of variable width. Isotropic polycrystalline ice behaves as a linear-viscous body at small stresses (Lipenkov et al., 1997; Salamatin et al., 1997). This linear rheology relating stresses and strain rates (Salamatin and Duval, 1997) is in-cluded in the model. Using a normalized ice-equivalent ver-tical coordinate, analyver-tical solutions for the velocities and consequently the strain rates are obtained. The settings of the glacier model are given in Salamatin et al. (2000) and Shiraiwa et al. (2001).
The trajectories of ice particles can be computed with the velocity field given by the analytical solution of the model. It is therefore possible to estimate the change in annual layer thickness by using the back-trajectory method. The origin (position at time t0= June 1998) of the back-trajectory of each annual layer is set to the central point of the layer at positionxc(wherex= (x,y,z) is the position vector,x and
y span the horizontal plane andz points upward), and the end of the trajectory is at the glacier surface. The back-trajectory of an annual layer is given by
x =xc−
t
Z
t0
vdt, (1)
where the integration is carried out backward in time,t, until the glacier surface is reached, andvis the analytical solution for the velocity field provided by the Salamatin model. The vertical strain rate,Dzz, along each trajectory follows as
Dzz(x)=
∂vz(x)
∂z . (2)
The thinning function,R(xc), is defined as the ratio of the annual layer thickness at the positionxc in the glacier and at the surface, both counted in metres of ice equivalent. It is obtained by the exponential of the integral of the vertical strain rate along the back-trajectory,
1
R (xc) =exp
ts
Z
t0
Dzzdt
, (3)
corresponds to an annual layer at positionxcwith thickness
h(in metres of water equivalent) is
as =
h
R (xc). (4)
2.2.2 Elmer/Ice
Elmer/Ice is a thermo-mechanically coupled, three-dimensional flow model (e.g. Gagliardini and Zwinger, 2008; Durand et al., 2009; Zwinger and Moore, 2009; Seddik et al., 2011, 2012). It is based on the open-source multi-physical simulation software Elmer (elmerice.elmerfem.org) which employs the finite element method. In the version we used (Zwinger et al., 2007), Elmer/Ice accounts for com-pressible firn (firn model by Gagliardini and Meyssonnier, 1997). It diagnostically solves the full Stokes equations for the Gorshkov crater glacier using the density profile from the K2 borehole and the present-day surface temperature. We have improved the approach by Zwinger et al. (2007) in two major ways:
– In order to avoid the necessity of describing a bound-ary condition at the northern outflow of the crater glacier, we have added to the model domain a 500 m long downhill slab with a constant thickness of 50 m and a slope of 0.2 (estimated from the map shown in Fig. 2 of Shiraiwa and Yamaguchi, 2002).
– In parameterizing the geothermal heat flux (Zwinger et al., 2007, Eq. 27), we optimized the parameters
qgeomin (minimum geothermal heat flux at the deepest point of the crater glacier) and m (exponent of the bed elevation) for best agreement with the tempera-ture measured and the age profiles at K2. Optimizing was carried out with APPSPACK (“Asynchronous Par-allel Pattern Search”) software and produced values of
qgeomin= 17.578 mW m−2andm= 2.3359.
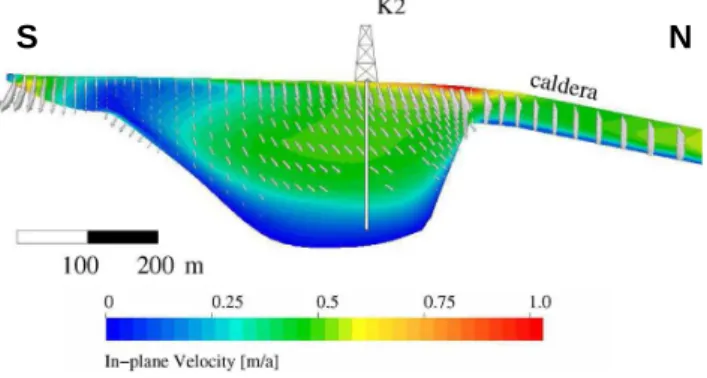
Applying the model provided a velocity field in the north– south transect of the crater glacier through the K2 drillsite (Fig. 2).
In order to compute layer thinning in the Gorshkov glacier from the three-dimensional velocity field from the Elmer/Ice simulation, we applied the thinning functionR(x) introduced above. It is equal to unity at the surface,
R|s =1, (5)
and decreases with depth. In contrast to the Salamatin model, the argument ofRis not limited to the positionsxcof annual layers in the K2 ice core; it can now be any positionxin the June 1998 configuration of the glacier.
Whereas the computed velocity field accounts for com-paction, this is neglected in the definition of the thinning function R(x). Therefore, an auxiliary thinning function
˜
R(x) is defined by
˜
R(x)= ρi
ρ(d)R(x), (6)
S
N
Fig. 2.Velocity field (absolute values as texture and direction vec-tors) simulated with Elmer/Ice in a north–south transect of the Gor-shkov crater glacier through the K2 drillsite.
whereρi= 910 kg m−3 is the density of pure ice andρ(d)
the variable density of the firn at depthd. This function is governed by the equation
dR˜
dt =vx ∂R˜
∂x +vy
∂R˜
∂y +vz
∂R˜
∂z = ˜R Dzz. (7)
The vertical strain rate is given byDzz=∂vz/∂z. According
to Eqs. (5) and (6) the surface boundary condition for Eq. (7) is
˜ R|s = ρi
ρs
, (8)
whereρs is the firn density at the glacier surface. We set
ρs= 0.45ρi(Zwinger et al., 2007).
We implemented the numerical solution of Eq. (7) for
˜
R(x) in Elmer/Ice, and the original thinning functionR(x) results from Eq. (6). For a dated annual layer at position x=xcwith thicknessh(in metres of ice equivalent), the ac-cumulation rateasis given by Eq. (4).
3 Results and discussion
3.1 Isotope (δD) record and accumulation-rate reconstruction
Annual layers were more than adequately sampled. There were 1461 samples covering the 170 yr 1828–1997, equiva-lent to 8.55 samples per annual layer. There were 1132 sam-ples from the 92 yr 1736–1827, equivalent to 11.44 samsam-ples per layer.
1998 1950 1900 1850 1800 1750 ‑225
‑200 ‑175 ‑150 ‑125 ‑100
Year A.D.
δ
D (‰)
1985
o 1956o 1829o 1737o
0 20 40 60 80 100 120 140
‑30 ‑25 ‑20 ‑15 ‑10
δ
O
18
(‰)
Depth (m)
Fig. 3.Measured water isotope profiles with dating results. Upper line:δ18O, lower line:δD. Dotted lines with year number indicate dated volcanic ash layers (Murav’yev et al., 2007).
-160 -150 -140
δD
(
‰
)
20 yr mean δD Annual mean δD
-180 -170 -160 -150 -140
2000 1950 1900 1850 1800 1750
δD
(
‰
)
Year A.D. 20 yr mean δD Annual mean δD
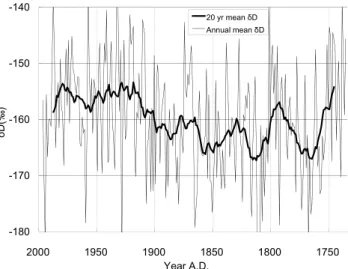
Fig. 4.Annual mean (thin line) and 20 yr mean (thick line)δD pro-files. Note that the average isotope ratio increases from the late 19th to the early 20th century.
ratio from 1736–1997 was−160.1 ‰. The 20 yr meanδD in-creased from the late 19th to the early 20th century. There is a change in meanδD values in the late 19th century. The years 1735–1880 and 1880–1997δD differ by 6.0 ‰. The mean for 1735–1880 was−162.1 ‰ and that for 1880–1997 was
−156.1 ‰. The multi-decadalδD fluctuation persisted from the early 18th century to the late 19th century and became weak in the 20th century.
We also determined the deuterium excessd=δD−8δ18O because this is a good indicator of changes in atmospheric circulation, precipitation seasonality and moisture source (Dansgaard, 1964). However, the standard deviation of the annual mean deuterium excess was small,∼1.3 ‰, for the entire period (although there were seasonal cycles). Because
0.4 0.5 0.6 0.7 0.8 0.9 1 0
20
40
60
80
100
120
140
Thinning rate
Depth (m)
Fig. 5.Thinning rates calculated by the Salamatin (dotted line) and Elmer/Ice (solid line) models.
0.2 0.3 0.4 0.5 0.6 0.7 0.8 0.9
2000 1950 1900 1850 1800 1750
AL
T
/Ac
c
um
ula
tion
(m
w
.eq.
y
r
-1)
Year A.D.
Annual layer thickness Salamatin Elmer/Ice
Fig. 6. Reconstructed 20 yr mean accumulation rates and annual layer thickness (ALT) profiles.
the measurement errors are large (Sect. 2.1), it is difficult to analyse the annual mean deuterium excess of the ice core in a reasonable way.
Year A. D.
Period (year)
1997 1950 1900 1850 1800 1750
2
4
8
16
32
64
Log
2
(Power)
−12 −10 −8 −6 −4 −2 0 2
(a)
0 200 400 600
2
4
8
16
32
64
Power Global Wavelet Spectrum
Period (
Year
)
(b)
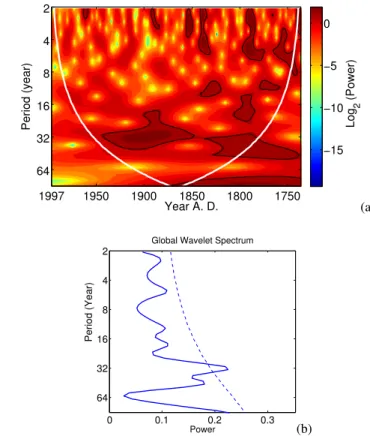
Fig. 7. (a)Wavelet plot forδD: binary logarithm of the power (ab-solute square of the wavelet transform) in ‰2. Black contours rep-resent the 95 % confidence level against red noise (Torrence and Compo, 1998). Areas outside the cone of influence (indicated by the thick white line) are to be discarded.(b)Global wavelet spec-trum forδD. The thin dashed line indicates the 95 % confidence level against red noise.
The trend of the accumulation rate has been nearly sta-ble (Elmer/Ice) or slightly increasing (Salamatin) over the last 260 years (Fig. 6). The mean accumulation rates from 1736 to 1997 were 0.62 m w.eq. in the Elmer/Ice model, and 0.51 m w.eq. in the Salamatin model. There were clear multi-decadal fluctuations of both reconstructed accumulation rates (20 yr running mean). They were strong in∼1730–1850 and became weak after 1950.
3.2 Wavelet analysis
Morlet wavelet analysis was applied to detrended (i.e. we re-moved the linear trend over the entire period of the signal) annual meanδD (Fig. 7a) and detrended reconstructed accu-mulation rates (Fig. 8a) in order to examine in more detail decadal and multi-decadal oscillations and its variation. The global wavelet spectrums are also shown (Figs. 7b and 8b). These were tested for significance at the 95 % confidence level against red noise (Torrence and Compo, 1998). Wavelet results for accumulation rate reconstructions derived by the Salamatin model and Elmer/Ice are roughly the same, since
Year A. D.
Period (year)
1997 1950 1900 1850 1800 1750
2
4
8
16
32
64
Log
2
(Power)
−15 −10 −5 0
(a)
0 0.1 0.2 0.3
2
4
8
16
32
64
Power Global Wavelet Spectrum
Period (
Year
)
(b)
Fig. 8. a) Wavelet plot for reconstructed accumulation rates (Elmer/Ice): binary logarithm of the power (absolute square of the wavelet transform) in m2a−2. Black contours represent the 95 % confidence level against red noise (Torrence and Compo, 1998). Ar-eas outside the cone of influence (indicated by the thick white line) are to be discarded.(b)Global wavelet spectrum for reconstructed accumulation rates (Elmer/Ice). The thin dashed line indicates the the 95 % confidence level against red noise.
the linear detrending operation removes their greatest differ-ence, and so only the Elmer/Ice results are plotted here.
The isotope δD expresses decadal (10–20 yr band) and multi-decadal (40–60 yr band) variabilities that are statisti-cally significant. Similar variabilities are found in the global wavelet spectrum for periods of 11–13 and 35–52 yr. The re-constructed accumulation rates also show significant decadal (10–20 yr band, before 1850) and multi-decadal (20–50 yr band) variabilities (28–35 yr in the global wavelet spectrum). ForδD, the multi-decadal variabilities decrease after∼1840 and fall below the confidence interval at∼1880. It matches the shift in average value ofδD. Both mean values and the dominant periods ofδD changed between the end of the Lit-tle Ice Age and the present. The variability of the recon-structed accumulation rates also shows this change in signif-icance. Multi-decadal significant variability (40–60 yr band) found in∼1740–1830 weakens thereafter. Then the 20–40 yr domain becomes significant in∼1860–1940.
of precipitation after the mid-19th century. Reconstructed accumulation rates derived from the Mt. Logan ice core (Holdsworth et al., 1989) also show that the dominant time period changed in the mid-19th century. There was a 36 yr peak before 1860 but it became less significant after that pe-riod whereas there were 4, 11 and 21 yr peaks after 1880. Tree ring records in western North America (Gedalof and Smith, 2001; Gray et al., 2003) also show the shift of multi-decadal variabilities in the mid-19th century. The match of the Ushkovsky/K2 ice core results with other paleoclimatic studies in this region demonstrates that the mid-19th cen-tury climate change affected North Pacific surface precipi-tation conditions. However, the mechanism is not necessar-ily the same in both places. Water isotope records from the Mt. Logan Eclipse ice core suggest the shift between mixed and zonal flow regimes of water vapour transport occurred around 1840 (Fisher et al., 2004). However, there is a clear difference between the water isotope ratios of the Mt. Logan core and the Ushkovsky core. They decrease in the Mt. Lo-gan core but increase in the Ushkovsky core between the Lit-tle Ice Age and the present. Increasing ratios were also found in the Altai ice core and this increase was interpreted as a warming signal (Henderson et al., 2006).
3.3 Comparison with local climate and glaciation data
We compared the annual mean δD with precipitation and air temperature records from the Kljuchi weather station (56.32◦N, 160.83◦E, approx. 40 m a.s.l., WMO Global Surface Network). Monthly precipitation (1961–1991) and monthly mean air temperature (1967–1989) were used to calculate the annual mean air temperature and annual to-tal precipitation. The annual meanδD was not significantly correlated with the annual mean air temperature (r=−0.22, n.s.) or the annual total precipitation (r=−0.14, n.s.). Here and below we lowered the effective degrees of freedom in order to reduce the effect of the autocorrelations in the two time series being correlated which would otherwise inflate the probability of obtaining significant correlations (Trenberth, 1984). The monthly-precipitation-weighted tem-perature (Steig et al., 1994) was derived to account for sea-sonal variation in precipitation. This was significantly corre-lated with the weighted annual mean temperature at Kljuchi station andδD (r= 0.45,p <0.05) in 1967–1989. This sug-gests thatδD reflects seasonal variation of precipitation rates and temperature though it is difficult to obtain a simple rela-tionship betweenδD and temperature.
There are peaks at 1810–1860, 1920 and 1970 in the 20 yr mean reconstructed accumulation rates. There are troughs around 1760–1770 followed by a steady increase to large val-ues at∼1850. This again indicates that the reconstructed ac-cumulation rate is related to the history of glacier advance and retreat in the region. The peaks of ∼1810–1860 and 1920 coincide with glacier advances on Kamchatka Penin-sula in the mid-19th and early 20th century (Solomina et al.,
1995). Increases around 1970 coincide with positive mass balances of glaciers in Kamchatka (Shiraiwa and Yamaguchi, 2002). Reconstructed, detrended annual accumulation from this ice core coincides to a degree with past winter accumu-lation rates reconstructed using a model of Koryto glacier, located halfway up the east coast of Kamchatka (Yamaguchi et al., 2008).
Solomina et al. (2007) found that the Ushkovsky accumu-lation record is in phase with the regional tree ring chronol-ogy KAML for∼1830–1880. Our results show that this is also the case for∼1730–1830. The mass balance phase of Kozelsky glacier is generally in phase with the Ushkovsky accumulation. There is an anti-phase relationship between Ushkovsky accumulation rates and Asian PDO expression (D’Arrigo and Wilson, 2006). This is consistent with the anti-phase relation between accumulation rates and PDO index (Shiraiwa and Yamaguchi, 2002).
3.4 Comparison with large-scale climate data
We also compared ourδD signal and reconstructed accumu-lation rates with surface temperatures (ECMWF ERA-40 re-analysis, 2 m monthly mean temperature fields for the pe-riod 1958–1996, in 3 yr means; Uppala et al., 2005). ForδD, there is a significant positive correlation with mid-latitude North Pacific (20–30◦N) surface temperatures, and a
signifi-cant negative correlation with subpolar (40–50◦N) North
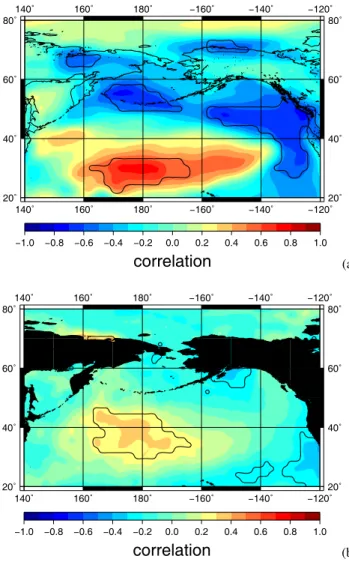
Pa-cific surface temperatures (Fig. 9a). The correlation map of reconstructed accumulation rates and ERA-40 2 m air tem-peratures shows a significant negative correlation with the subpolar North Pacific (40–60◦N, 180–150◦W), and a sig-nificant positive correlation with the western coast of North America (40◦N, 125◦W and 60◦N, 145◦W) (Fig. 10a). This evidence indicates that the ice coreδD records reflect extrat-ropical North Pacific surface climate conditions.
The pattern of the correlation map of δD resembled the second leading mode of the North Pacific surface tempera-ture (Bond et al., 2003), which is related to the North Pa-cific Gyre Oscillation (NPGO) (Di Lorenzo et al., 2010; Furtado et al., 2011). The correlation of annual mean δD with the annual mean NPGO index (Di Lorenzo et al., 2008) was r= 0.27 (p <0.10) for 1950–1997 and r= 0.70 (p <0.01) for 1979–1997. These results suggest thatδD re-flects the NPGO after the climate regime shift in 1976/1977, but not before that. Since then, the location of the Aleu-tian Low was shifted westward and the central pressure was deepened (Nitta and Yamada, 1989; Trenberth, 1990). The reconstructed accumulation rates also correlated with the NPGO index for 1950–1997 (r= 0.29, p <0.10); however, for 1979–1997 the correlation was smaller (r= 0.21, n.s.) than that forδD.
140˚
140˚
160˚
160˚
180˚
180˚
−160˚
−160˚
−140˚
−140˚
−120˚
−120˚
20˚ 20˚
40˚ 40˚
60˚ 60˚
80˚ 80˚
−1.0 −0.8 −0.6 −0.4 −0.2 0.0 0.2 0.4 0.6 0.8 1.0
correlation
(a)140˚ 140˚
160˚ 160˚
180˚ 180˚
−160˚
−160˚
−140˚
−140˚
−120˚
−120˚
20˚ 20˚
40˚ 40˚
60˚ 60˚
80˚ 80˚
−1.0 −0.8 −0.6 −0.4 −0.2 0.0 0.2 0.4 0.6 0.8 1.0
correlation
(b)Fig. 9. (a)Correlation map of the ice coreδD with ERA-40 3 yr mean surface (2 m) temperature for 1958–1996 (39 yr). Black con-tours indicate the land-water margin and the 90 % confidence level. b)Correlation map of the ice coreδD with ERSST 3 yr mean sea surface temperature for 1854–1995 (142 yr). Black contours indi-cate the land-water margin and the 90 % confidence level.
141 yr). ForδD, there is a significant positive correlation with mid to high latitude Northwest Pacific (30–45◦N, 165◦E–
165◦W) surface temperatures, and a significant negative cor-relation with offshore California (20–35◦N, 120–130◦W), and a part of the Gulf of Alaska (55–60◦N, 145–155◦W) (Fig. 9b). The structure is close to the first leading mode of the SST anomaly, PDO, rather than NPGO. The corre-lation map of reconstructed accumucorre-lation rates and ERSST (Fig. 10b) showed a significant positive correlation with the region 35–45◦N, 155–165◦E (east of Japan) and a signif-icant negative correlation with the region 25–30◦N, 165– 175◦E (further southeast in the subtropics).
Water vapour transport analysis showed that almost 80 % of winter precipitation and 50 % of summer precipita-tion over eastern Siberia originates from the North Pacific
140˚
140˚
160˚
160˚
180˚
180˚
−160˚
−160˚
−140˚
−140˚
−120˚
−120˚
20˚ 20˚
40˚ 40˚
60˚ 60˚
80˚ 80˚
−1.0 −0.8 −0.6 −0.4 −0.2 0.0 0.2 0.4 0.6 0.8 1.0
correlation
(a)140˚
140˚
160˚
160˚
180˚
180˚
−160˚ −160˚
−140˚ −140˚
−120˚ −120˚
20˚ 20˚
40˚ 40˚
60˚ 60˚
80˚ 80˚
−1.0 −0.8 −0.6 −0.4 −0.2 0.0 0.2 0.4 0.6 0.8 1.0
correlation
(b)Fig. 10. (a)Correlation map of reconstructed accumulation rates (Elmer/Ice) with ERA-40 3 yr mean surface (2 m) temperature for 1958–1996 (39 yr). Black contours indicate the land-water margin and the 90 % confidence level.(b)Correlation map of reconstructed accumulation rates (Elmer/Ice) with ERSST 3 yr mean sea surface temperature for 1854–1995 (142 yr). Black contours indicate the land-water margin and the 90 % confidence level.
(Numaguti, 1999). The ocean is thus the main source of wa-ter vapour for the Kamchatka Peninsula, particularly in win-ter. The precipitation record at Kljuchi showed that winter precipitation is higher than during other seasons, which sug-gests that there might be high winter precipitation ratios in the annual layers of the K2 ice core.
and Siberia. Therefore, one of the main water vapour sources is the Northwest Pacific. By contrast, the Arctic Ocean is not a main source, even though it is important for the material transport.
The NPGO index is defined by the sea surface height anomaly of the California current region in the Northeast Pacific (Di Lorenzo et al., 2008). However, it is not di-rectly reflected in the ice core records because of interven-ing processes. Transportation of the signal via the ocean through Rossby wave propagation takes several years at least (Ceballos et al., 2009). Other possibilities are connections via the atmosphere. There is a significant correlation between the low-passed North Pacific Oscillation (NPO) (Walker and Bliss, 1932; Rogers, 1981) and the SST anomaly around Kamchatka (Furtado et al., 2012). This represents atmo-spheric forcing of the NPGO (Ceballos et al., 2009; Furtado et al., 2011, 2012). Linkin and Nigam (2008) showed that this sea level pressure pattern, NPO, is linked with the upper-air west Pacific connection pattern (WP pattern; Wallace and Gutzler, 1981), and that the NPO/WP is a prominent mode of winter mid-latitude variability. The correlation of the win-ter win-term (January–March) WP index with annual meanδD is significant (r= 0.50, p <0.05) for 1977–1997, though it is not significant for 1950–1997 (r= 0.13, n.s.). This implies that the correlation betweenδD and the NPGO index after the climate regime shift in 1976/1977 reflects that beween
δD and the WP index.
In contrast, the relationship between δD and SST for 1854–1995 differs significantly from that between δD and the ECMWF ERA-40 surface temperatures for 1958–1996 discussed above (Fig. 9b). (This difference also occurs if the ERA-40 surface temperatures are replaced by SST for 1958–1996; not shown. The crucial point is thus the different time scale.) The structure shown in Fig. 9b resembles that of the PDO. There is a negative correlation between the winter (November–April) PDO index and precipitation and temper-ature in Kamchatka (Mantua and Hare, 2002). Winter precip-itation increases and decreases cause corresponding changes in annual meanδD through changes in winter layer thick-ness. One of the reasons for the structure of Fig. 9b would be this precipitation-weight effect. The negative relationship between winter precipitation in Kamchatka and PDO index (Mantua and Hare, 2002) also agrees with the negative phase relationship between reconstructed accumulation and PDO index (Shiraiwa and Yamaguchi, 2002).
The water isotope ratio of precipitation depends on its sources and the condensation temperatures during transport (Dansgaard, 1964). Although variation inδD is caused by its dependence on the source conditions, this is not the cause since it also depends on the precipitation-weighted local tem-perature, as suggested above. Detailed water isotope mod-elling analysis (cf. Field et al., 2010; Porter et al., 2014) of Kamchatka and this ice core site can improve understanding of the detailed mechanism behind water isotope variation.
4 Summary and conclusions
We presented and analysed water isotope records for the top 140.7 m of the Ushkovsky/K2 ice core. The average level of
δD changed by 6.0 ‰ from 1736–1880 to 1910–1997. This may well have been caused by an increase in average temper-ature between the end of the Little Ice Age and the present. It is difficult, however, to ascertain a simple relationship with annual mean temperature because annualδD is modified by seasonal precipitation change, as is suggested by the compar-ison with precipitation-weighted temperature.
Lagrangian and Eulerian accumulation reconstruction methods were developed for the thermo-mechanical coupled 2-D Salamatin (Salamatin et al., 2000) and 3-D Elmer/Ice (Zwinger et al., 2007) glacier models including firn dynam-ics. These reconstructions showed that the layer of snow de-posited in a year on the surface compresses by 0.50 to 0.75 at 140 m depth at the K2 drillsite. Reconstructed accumulation rates in the late Little Ice Age were slightly less than, or al-most the same, as today. One of the large uncertainties is the different firn and ice rheology employed in the two models. Glaciological observations of firn properties at the site and transient simulations using a firn layer model would improve the accumulation reconstruction. The highest reconstructed accumulation rates, at∼1810–1850, 1910 and 1970, coin-cide with glacier advances and mass balance changes and moraine records in glaciers in Kamchatka (Solomina et al., 1995; Yamaguchi et al., 2008). Therefore, the variation in ac-cumulation can be used as a proxy for glacier acac-cumulation changes in central Kamchatka. It is thus likely that Siberian High and Aleutian Low activities affect the changes of Kam-chatkan glaciers (Barr and Solomina, 2013). Analysis of the activity of these pressure systems, their spatial extent and el-evation will improve understanding of the forcing factors for glacier mass balance in the region.
The δD record and the reconstructed accumulation rates show significant decadal and multi-decadal variabilities and changes of multi-decadal time periods in the mid to late 19th century. The time at which the multi-decadal oscillation signal inδD was lost coincided with changes in its average value between the end of the Little Ice Age and the present. The shifts of the dominant time period for the reconstructed accumulation also appears in the 1850s.
We found significant correlations between the ice core records and ERA-40 surface temperatures in the North Pa-cific, somewhat more pronounced forδD than for the recon-structed accumulation rates. The significant relationship be-tween theδD record and the winter NPGO index is caused by its correlation with the winter WP index; the NPO/WP pat-tern is the forcing of NPGO (Ceballos et al., 2009; Furtado et al., 2011, 2012).
this time scale. To determine which components are most im-portant for the region, atmosphere-ocean interaction analysis for precipitation or temperature in this region would be re-quired. Long-term isotope climate modelling will further en-hance understanding of the relationships betweenδD and the PDV or other connection patterns and, more generally, of cli-mate change between the Little Ice Age and the present.
The NPGO and WP indices are only defined since the 1950s due to a lack of observations. Past NPGO and WP re-constructions based on models would therefore be required to extend our analysis. Comparison of the water isotope records from the Ushkovsky/K2 ice core with coral records in the Northwest Pacific (Felis et al., 2009, 2010) could also help further understanding of the connection between the source of water vapour and precipitation in Kamchatka.
Acknowledgements. We thank Yaroslav Murav’yev for his support
of the ice core project, Sumito Matoba for guidance on water isotope measurements at the Institute of Low Temperature Science, Hokkaido University, and Jessica Lundin and Heinz Blatter for helpful discussions and for checking earlier versions of the manuscript. ECMWF ERA-40 data used in this study were obtained from the ECMWF Data Server (http://data-portal.ecmwf.int/). The wavelet software was provided by Christopher Torrence and Gilbert P. Compo (http://atoc.colorado.edu/research/wavelets). Thoughtful and constructive comments by the scientific editor, Allegra N. LeGrande, reviewer Olga Solomina and two anonymous reviewers helped to improve the manuscript considerably. Andrew Davis of English Experience Language Services (Jena, Germany) edited the English. Support by Grants-in-Aid for Scientific Re-search B (Nos. 16403005 and 19340137) and A (No. 22244058) from the Japan Society for the Promotion of Science, JSPS, is gratefully acknowledged. This publication is contribution no. 12 of the Nordic Centre of Excellence SVALI, “Stability and Variations of Arctic Land Ice”, funded by the Nordic Top-Level Research Initiative (TRI).
Edited by: A. N. LeGrande
References
Barr, I. D. and Solomina, O.: Pleistocene and Holocene glacier fluc-tuations upon the Kamchatka Peninsula, Global Planet. Change, 113, 110–120, doi:10.1016/j.gloplacha.2013.08.005, 2013. Biondi, F., Gershunov, A., and Cayan, D. R.: North Pacific decadal
climate variability since 1661, J. Climate, 14, 5–10, 2001. Bond, N. A., Overland, J. E., Spillane, M., and Stabeno, P.: Recent
shifts in the state of the North Pacific, Geophys. Rev. Lett., 30, 2183, doi:10.1029/2003GL018597, 2003.
Ceballos, L. I., Di Lorenzo, E., Hoyos, C. D., Schneider, N., and Taguchi, B.: North Pacific Gyre Oscillation synchronizes climate fluctuations in the eastern and western boundary systems, J. Cli-mate, 22, 5163–5174, doi:10.1175/2009JCLI2848.1, 2009. Cecil, L. D., Green, J. R., and Thompson, L. G.: Earth
Paleoenvi-ronments: Records Preserved in Mid- and Low-latitude Glaciers, Springer, New York, 2004.
Dansgaard, W.: Stable isotopes in precipitation, Tellus, 16, 436– 468, 1964.
D’Arrigo, R. and Wilson, R.: On the Asian expression of the PDO, Int. J. Climatol., 26, 1607–1617, doi:10.1002/joc.1326, 2006. D’Arrigo, R., Villalba, R., and Wiles, G.: Tree-ring estimates of
Pacific decadal climate variability, Clim. Dynam., 18, 219–224, 2001.
Di Lorenzo, E., Schneider, N., Cobb, K. M., Franks, P. J. S., Chhak, K., Miller, A. J., McWilliams, J. C., Bograd, S. J., Arango, H., Curchitser, E., Powell, T. M., and Rivière, P.: North Pacific Gyre Oscillation links ocean climate and ecosystem change, Geophys. Res. Lett., 35, L08607, doi:10.1029/2007GL032838, 2008. Di Lorenzo, E., Cobb, K., Furtado, J., Schneider, N., Anderson, B.,
Bracco, A., Alexander, M., and Vimont, D.: Central Pacific El Niño and decadal climate change in the North Pacific Ocean, Nat. Geosci., 3, 762–765, 2010.
Durand, G., Gagliardini, O., Zwinger, T., Le Meur, E., and Hind-marsh, R. C. A.: Full Stokes modeling of marine ice sheets: influ-ence of the grid size, Annals of Glaciology, 50, 109–114, 2009. Felis, T., Suzuki, A., Kuhnert, H., Dima, M., Lohmann, G., and
Kawahata, H.: Subtropical coral reveals abrupt early-twentieth-century freshening in the western North Pacific Ocean, Geology, 37, 527–530, 2009.
Felis, T., Suzuki, A., Kuhnert, H., Rimbu, N., and Kawahata, H.: Pa-cific Decadal Oscillation documented in a coral record of North Pacific winter temperature since 1873, Geophysical Res. Lett., 37, L14605, doi:10.1029/2010GL043572, 2010.
Field, R. D., Moore, G., Holdsworth, G., and Schmidt, G. A.: A GCM-based analysis of circulation controls on δ18O in the southwest Yukon, Canada: Implications for climate re-constructions in the region, Geophys. Res. Lett., 37, L05706, doi:10.1029/2009GL041408, 2010.
Fisher, D. A., Wake, C., Kreutz, K., Yalcin, K., Steig, E., Mayewski, P., Anderson, L., Zheng, J., Rupper, S., Zdanowicz, C., De-muth, M., Waszkiewicz, M., Dahl-Jensen, D., Goto-Azuma, K., Bourgeois, J. B., Koerner, R. M., Sekerka, J., Osterberg, E., Abbott, M. B., Finney, B. P., and Burns, S. J.: Stable isotope records from Mount Logan, Eclipse ice cores and nearby Jelly-bean Lake. Water cycle of the north Pacific over 2000 years and over five vertical kilometres: sudden shifts and tropical connections, Géographie Physique et Quaternaire, 58, 337–352, doi:10.7202/013147ar, 2004.
Fukuda, T., Sugiyama, S., Matoba, S., and Shiraiwa, T.: Glacier flow measurement and radio-echo sounding at Aurora Peak, Alaska, in 2008, Ann. Glaciol., 52, 138–142, 2011.
Furtado, J. C., Di Lorenzo, E., Schneider, N., and Bond, N.: North Pacific decadal variability and climate change in the IPCC AR4 models, J. Climate, 24, 3049–3067, doi:10.1175/2010JCLI3584.1, 2011.
Furtado, J. C., Di Lorenzo, E., Anderson, B. T., and Schneider, N.: Linkages between the North Pacific Oscillation and central trop-ical Pacific SSTs at low frequencies, Clim. Dynam., 39, 2833– 2846, doi:10.1007/s00382-011-1245-4, 2012.
Gagliardini, O. and Meyssonnier, J.: Flow simulation of a firn-covered cold glacier, Ann. Glaciol., 24, 242–248, 1997. Gagliardini, O. and Zwinger, T.: The ISMIP-HOM benchmark
Gedalof, Z. and Smith, D.: Interdecadal climate variability and regime-scale shifts in Pacific North America, Geophys. Res. Lett., 28, 1515–1518, 2001.
Gray, S. T., Betancourt, J. L., Fastie, C. L., and Jack-son, S. T.: Patterns and sources of multidecadal oscillations in drought-sensitive tree-ring records from the central and southern Rocky Mountains, Geophys. Res. Lett., 30, 1316, doi:10.1029/2002GL016154, 2003.
Hagemann, R., Nief, G., and Roth, E.: Absolute isotopic scale for deuterium analysis of natural waters, Absolute D/H ratio for SMOW, Tellus, 22, 712–715, 1970.
Hartmann, B. and Wendler, G.: The significance of the 1976 Pacific climate shift in the climatology of Alaska, J. Climate, 18, 4824– 4839, 2005.
Henderson, K., Laube, A., Gäggeler, H. W., Olivier, S., Papina, T., and Schwikowski, M.: Temporal variations of accumulation and temperature during the past two centuries from Belukha ice core, Siberian Altai, J. Geophys. Res.-Atmos., 111, D03104, doi:10.1029/2005JD005819, 2006.
Hodge, S. M., Trabant, D. C., Krimmel, R. M., Heinrichs, T. A., March, R. S., and Josberger, E. G.: Climate variations and changes in mass of three glaciers in western North America, J. Climate, 11, 2161–2179, 1998.
Holdsworth, G., Krouse, H. R., Nosal, M., Spencer, M. J., and Mayewski, P. A.: Analysis of a 290-year net accumulation time series from Mt. Logan, Yukon, in: Snow Cover and Glacier Vari-ations, IAHS Publication No. 183, International Association of Hydrological Sciences, Proceedings of the Baltimore Sympo-sium, May 1989, Maryland, 71–79, 1989.
Jacoby, G., Solomina, O., Frank, D., Eremenko, N., and D’Arrigo, R.: Kunashir (Kuriles) Oak 400-year reconstruction of tempera-ture and relation to the Pacific Decadal Oscillation, Palaeogeogr. Palaeocl., 209, 303–311, 2004.
Josberger, E. G., Bidlake, W. R., March, R. S., and Kennedy, B. W.: Glacier mass-balance fluctuations in the Pacific Northwest and Alaska, USA, Ann. Glaciol., 46, 291–296, 2007.
Kawamura, K., Izawa, Y., Mochida, M., and Shiraiwa, T.: Ice core records of biomass burning tracers (levoglucosan and dehydroa-bietic, vanillic and p-hydroxybenzoic acids) and total organic carbon for past 300 years in the Kamchatka Peninsula, Northeast Asia, Geochim. Cosmochim. Acta, 99, 317–329, 2012. Linkin, M. E. and Nigam, S.: The north pacific oscillation-west
Pa-cific teleconnection pattern: Mature-phase structure and winter impacts, J. Climate, 21, 1979–1997, 2008.
Lipenkov, V. Y., Salamatin, A. N., and Duval, P.: Bubbly-ice densi-fication in ice sheets: II. Applications, J. Glaciol., 43, 397–407, 1997.
Mantua, N. J. and Hare, S. R.: The Pacific decadal oscillation, J. Oceanogr., 58, 35–44, 2002.
Mantua, N. J., Hare, S. R., Zhang, Y., Wallace, J. M., and Fran-cis, R. C.: A Pacific interdecadal climate oscillation with impacts on salmon production, B. Am. Meteorol. Soc., 78, 1069–1080, 1997.
Matoba, S., Shiraiwa, T., Tsushima, A., Sasaki, H., and Muravyev, Y.: Records of sea-ice extent and air temperature at the Sea of Okhotsk from an ice core of Mount Ichinsky, Kamchatka, Ann. Glaciol., 52, 44–50, 2011.
Matsuoka, K., Horikawa, S., Shiraiwa, T., Muravyev, Y. D., Sala-matin, A. N., Ovsyannikov, A. A., Maeno, H., and Ohi, M.: Ra-dio echo soundings at the summit ice cap of the Ushkovsky vol-cano, Kamchatka, in: Cryospheric Studies in Kamchatka II – Pro-ceedings of the International Workshop on Cryospheric Studies in Kamchatka, January 1998, edited by: Naruse, R., Institute of Low Temperature Science, Hokkaido University, Sapporo, 20– 24, 1999.
Minobe, S.: A 50–70 year climatic oscillation over the North Pacific and North America, Geophys. Res. Lett., 24, 683–686, 1997. Moore, G. W. K., Holdsworth, G., and Alverson, K.: Climate
change in the North Pacific region over the past three centuries, Nature, 420, 401–403, 2002.
Murav’yev, Y. D., Ovsyannikov, A. A., and Shiraiwa, T.: Activity of the northern volcano group according to drilling data in the Ushkovsky crater glacier, Kamchatka, J. Volcanol. Seismol., 1, 42–52, doi:10.1134/S0742046307010034, 2007.
Nitta, T. and Yamada, S.: Recent warming of tropical sea surface temperatures and its relationship to the Northern Hemisphere cir-culation, J. Meteorol. Soc. Jpn., 67, 375–383, 1989.
Numaguti, A.: Origin and recycling processes of precipitating water over the Eurasian continent: Experiments using an atmospheric general circulation model, J. Geophys. Res., 104, 1957–1972, 1999.
Ovsyannikov, A. A., Murav’yev, Y. D., and Yamagata, K.: Com-position peculiarities of the volcanic ash from the crater of Ushkovsky Volcano, in: Proceedings of the International Sym-posium Atmosphere–Ocean–Cryosphere Interaction in the Sea of Okhotsk and the Surrounding Environment, edited by: Wakat-suchi, M. and Hara, T., Institute of Low Temperature Science, Hokkaido University, Sapporo, 134–135, 2001.
Paterson, W. S. B. and Waddington, E. D.: Past precipitation rates derived from ice core measurements: methods and data analysis, Rev. Geophys., 22, 123–130, 1984.
Porter, T. J., Pisaric, M. F., Field, R. D., Kokelj, S. V., Ed-wards, T. W., Healy, R., and LeGrande, A. N.: Spring-summer temperatures since AD 1780 reconstructed from stable oxy-gen isotope ratios in white spruce tree-rings from the Macken-zie Delta, northwestern Canada, Clim. Dynam., 42, 771–785, doi:10.1007/s00382-013-1674-3, 2014.
Raymond, C., Weertman, B., Thompson, L., Mosley-Thompson, E., Peel, D., and Mulvaney, R.: Geometry, motion and mass balance of Dyer Plateau, Antarctica, J. Glaciol., 42, 510–518, 1996. Rogers, J. C.: The north Pacific oscillation, J. Climatol., 1, 39–57,
1981.
Salamatin, A. N. and Duval, P.: Creep flow and pressure relaxation in bubbly medium, Int. J. Solid. Struct., 34, 61–78, 1997. Salamatin, A. N., Lipenkov, V. Y., and Duval, P.: Bubbly-ice
densi-fication in ice sheets: I. Theory, J. Glaciol., 43, 387–396, 1997. Salamatin, A. N., Murav’yev, Y. D., Shiraiwa, T., and Matsuoka, K.:
Modelling dynamics of glaciers in volcanic craters, J. Glaciol., 46, 177–187, 2000.
Seddik, H., Greve, R., Zwinger, T., and Placidi, L.: A full Stokes ice flow model for the vicinity of Dome Fuji, Antarctica, with in-duced anisotropy and fabric evolution, The Cryosphere, 5, 495– 508, doi:10.5194/tc-5-495-2011, 2011.
Seddik, H., Greve, R., Zwinger, T., Gillet-Chaulet, F., and Gagliar-dini, O.: Simulations of the Greenland ice sheet 100 years into the future with the full Stokes model Elmer/Ice, J. Glaciol., 58, 427–440, doi:10.3189/2012JoG11J177, 2012.
Shiraiwa, T. and Yamaguchi, S.: Reconstruction of glacier mass bal-ances and climate changes in the Kamchatka Peninsula, J. Geogr. Tokyo, 111, 476–485, 2002.
Shiraiwa, T., Muravyev, Y. D., and Yamaguchi, S.: Stratigraphic features of firn as proxy climate signals at the summit ice cap of Ushkovsky Volcano, Kamchatka, Russia, Arct. Alp. Res., 29, 414–421, 1997.
Shiraiwa, T., Murav’yev, Y. D., Kameda, T., Nishio, F., Toyama, Y., Takahashi, A., Ovsyannikov, A. A., Salamatin, A. N., and Yama-gata, K.: Characteristics of a crater glacier at Ushkovsky volcano, Kamchatka, Russia, as revealed by the physical properties of ice cores and borehole thermometry, J. Glaciol., 47, 423–432, 2001. Shiraiwa, T., Goto-Azuma, K., Matoba, S., Yamasaki, T., Segawa, T., Kanamori, S., Matsuoka, K., and Fujii, Y.: Ice core drilling at King Col, Mount Logan 2002, Bull. Glaciol. Res., 20, 57–63, 2003.
Smith, T. M., Reynolds, R. W., Peterson, T. C., and Lawrimore, J.: Improvements to NOAA’s historical merged land-ocean surface temperature analysis (1880–2006), J. Climate, 21, 2283–2296, 2008.
Solomina, O., Wiles, G., Shiraiwa, T., and D’Arrigo, R.: Multiproxy records of climate variability for Kamchatka for the past 400 years, Clim. Past, 3, 119–128, doi:10.5194/cp-3-119-2007, 2007. Solomina, O. N., Muravyev, Y. D., and Bazanova, L. I.: “Little Ice Age” glaciers in Kamchatka, northeastern Russia, Ann. Glaciol., 21, 240–244, 1995.
Steig, E. J., Grootes, P. M., and Stuiver, M.: Seasonal precipi-tation timing and ice core records, Science, 266, 1885–1886, doi:10.1126/science.266.5192.1885, 1994.
Torrence, C. and Compo, G. P.: A practical guide to wavelet analy-sis, B. Am. Meteorol. Soc., 79, 61–78, 1998.
Trenberth, K. E.: Some effects of finite sample size and persis-tence on meteorological statistics, Part I: Autocorrelations, Mon. Weather Rev., 112, 2359–2368, 1984.
Trenberth, K. E.: Recent observed interdecadal climate changes in the northern hemisphere, B. Am. Meteorol. Soc., 71, 988–993, doi:10.1175/1520-0477(1990)071<0988:ROICCI>2.0.CO;2, 1990.
Uppala, S. M., Kållberg, P. W., Simmons, A. J., Andrae, U., Bech-told, V. D. C., Fiorino, M., Gibson, J. K., Haseler, J., Hernandez, A., Kelly, G. A., Li, X., Onogi, K., Saarinen, S., Sokka, N., Al-lan, R. P., Andersson, E., Arpe, K., Balmaseda, M. A., Beljaars, A. C. M., Berg, L. V. D., Bidlot, J., Bormann, N., Caires, S., Chevallier, F., Dethof, A., Dragosavac, M., Fisher, M., Fuentes, M., Hagemann, S., Hólm, E., Hoskins, B. J., Isaksen, L., Janssen, P. A. E. M., Jenne, R., Mcnally, A. P., Mahfouf, J.-F., Mor-crette, J.-J., Rayner, N. A., Saunders, R. W., Simon, P., Sterl, A., Trenberth, K. E., Untch, A., Vasiljevic, D., Viterbo, P., and Woollen, J.: The ERA-40 re-analysis, Q. J. Roy. Meteorol. Soc., 131, 2961–3012, doi:10.1256/qj.04.176, 2005.
Wagenbach, D.: Environmental records in Alpine glaciers, in: The Environmental Record in Glaciers and Ice Sheets, edited by: Oeschger, H. and Langway, C. C., John Wiley & Sons, Chich-ester, 69–83, 1989.
Wake, C. P., Yalcin, K., and Gundestrup, N. S.: The climate sig-nal recorded in the oxygen-isotope, accumulation and major-ion time series from the Eclipse ice core, Yukon Territory, Canada, Ann. Glaciol., 35, 416–422, 2002.
Walker, G. T. and Bliss, E. W.: World weather V, Memoirs Roy. Meteorol. Soc., 4, 53–84, 1932.
Wallace, J. M. and Gutzler, D. S.: Teleconnections in the geopo-tential height field during the Northern Hemisphere winter, Mon. Weather Rev., 109, 784–812, 1981.
Yamaguchi, S., Naruse, R., and Shiraiwa, T.: Climate reconstruction since the Little Ice Age by modelling Koryto glacier, Kamchatka Peninsula, Russia, J. Glaciol., 54, 125–130, 2008.
Yasunari, T. J., Shiraiwa, T., Kanamori, S., Fujii, Y., Igarashi, M., Yamazaki, K., Benson, C. S., and Hondoh, T.: Intra-annual vari-ations in atmospheric dust and tritium in the North Pacific region detected from an ice core from Mount Wrangell, Alaska, J. Geo-phys. Res., 112, D10208, doi:10.1029/2006JD008121, 2007. Zwinger, T. and Moore, J. C.: Diagnostic and prognostic
simula-tions with a full Stokes model accounting for superimposed ice of Midtre Lovénbreen, Svalbard, The Cryosphere, 3, 217–229, doi:10.5194/tc-3-217-2009, 2009.